. 2019 Dec;33(12):13398-13411.
doi: 10.1096/fj.201901366R. Epub 2019 Sep 17.

IDH2 reprograms mitochondrial dynamics in cancer through a HIF-1α - regulated pseudohypoxic state

Affiliations

IDH2 reprograms mitochondrial dynamics in cancer through a HIF-1α - regulated pseudohypoxic state

Yuan Wang et al. FASEB J. 2019 Dec.

Abstract

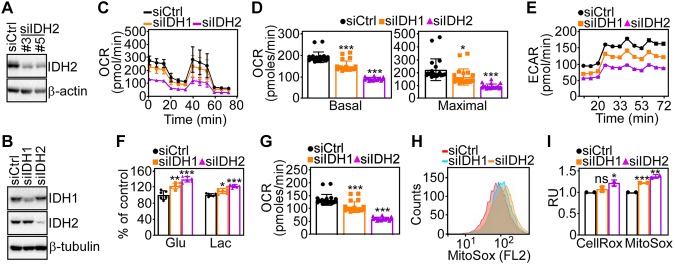
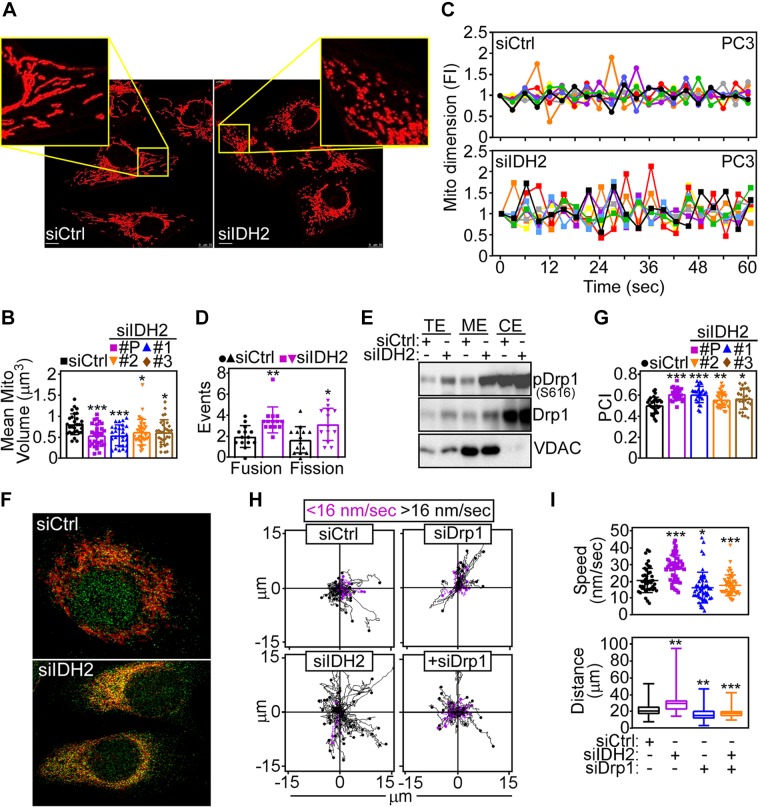
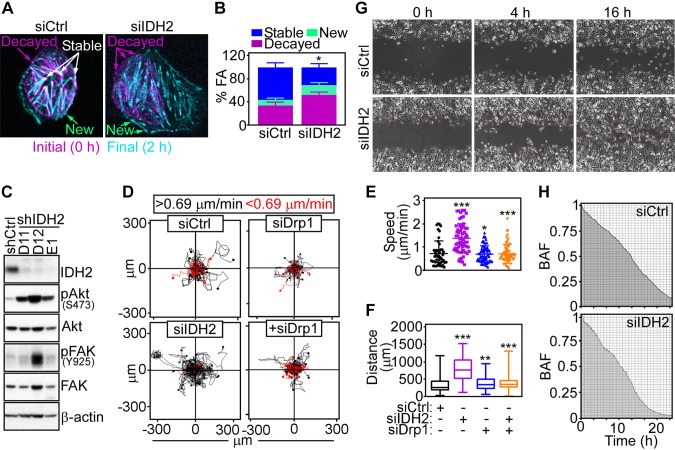
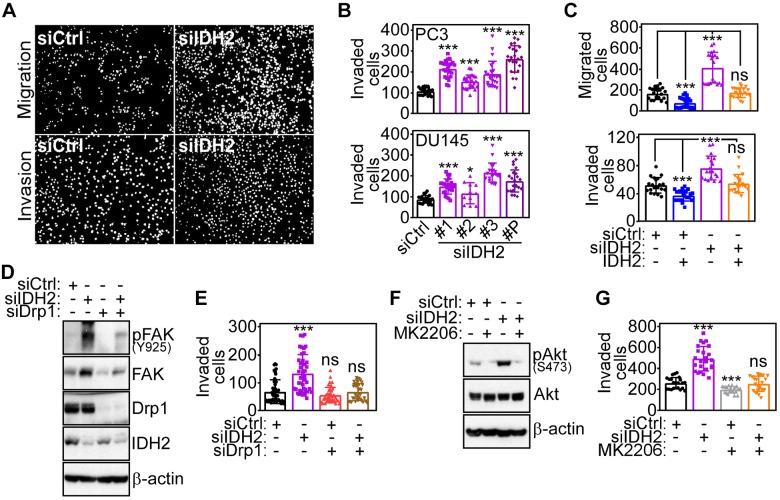
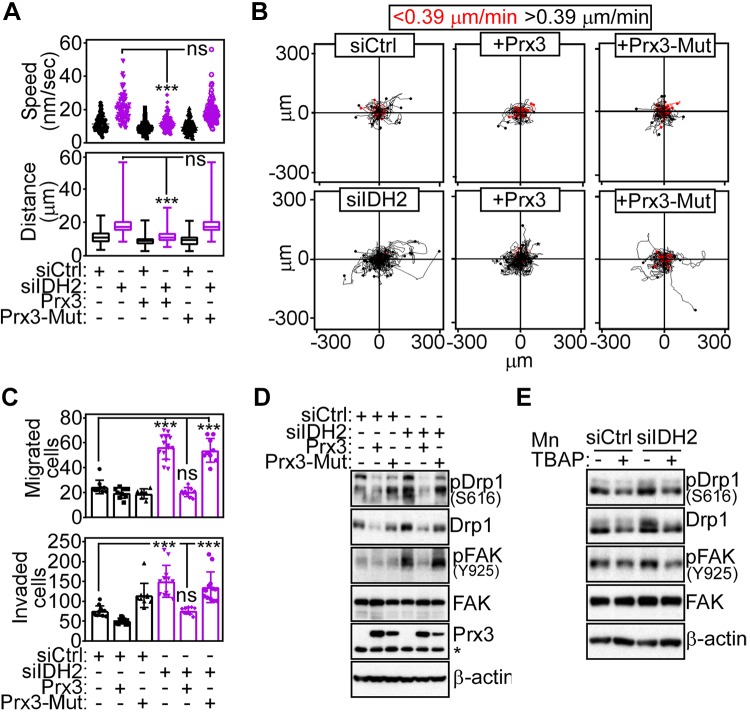
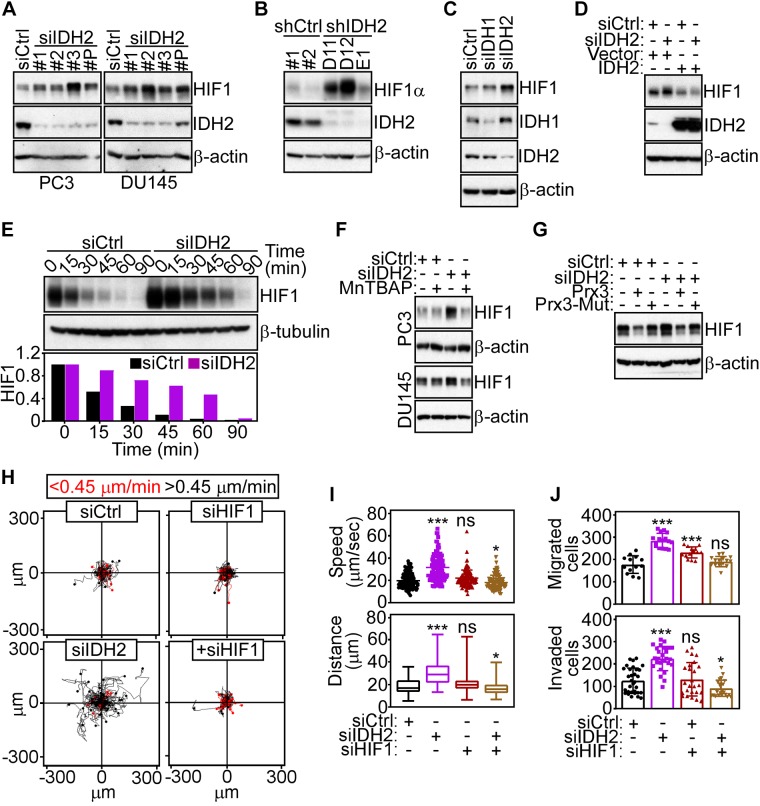
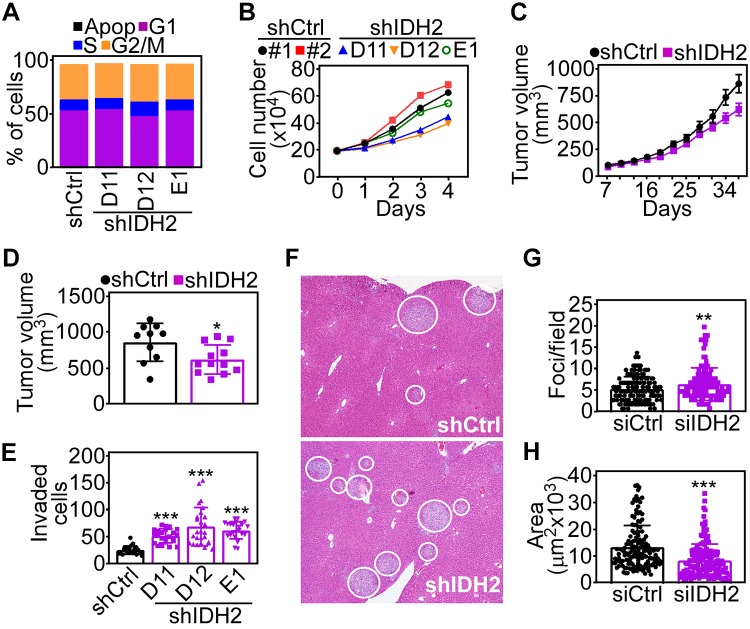
The role of mitochondria in cancer continues to be debated and paradoxically implicated in opposing functions in tumor growth and tumor suppression. To understand this dichotomy, we explored the function of mitochondrial isocitrate dehydrogenase (IDH)2, a tricarboxylic acid cycle enzyme mutated in subsets of acute leukemias and gliomas, in cancer. Silencing of IDH2 in prostate cancer cells impaired oxidative bioenergetics, elevated reactive oxygen species (ROS) production, and promoted exaggerated mitochondrial dynamics. This was associated with increased subcellular mitochondrial trafficking, turnover of membrane focal adhesion complexes, and enhanced tumor cell migration and invasion, without changes in cell cycle progression. Mechanistically, loss of IDH2 caused ROS-dependent stabilization of hypoxia-inducible factor-1α in normoxia, which was required for increased mitochondrial trafficking and tumor cell movements. Therefore, IDH2 is a dual regulator of cancer bioenergetics and tumor cell motility. This pathway may reprogram mitochondrial dynamics to differentially adjust energy production or promote tumor cell invasion in response to microenvironment conditions.-Wang, Y., Agarwal, E., Bertolini, I., Ghosh, J. C., Seo, J. H., Altieri, D. C. IDH2 reprograms mitochondrial dynamics in cancer through a HIF-1α-regulated pseudohypoxic state.

Keywords: HIF-1α metastasis; ROS; mitochondria; tumor cell motility.


Conflict of interest statement

The authors thank James Hayden and Frederick Keeney (The Wistar Institute Imaging Core Facility) for assistance with time-lapse videomicroscopy. This work was supported by U.S. National Institutes of Health, National Cancer Institute Grants P01 CA140043 and R35 CA220446 (to D.C.A.). The support for Shared Resources utilized in this study was provided by Cancer Center Support Grant (CCSG) P30 CA010815. The authors declare no conflicts of interest.

Figures

Figure 1
Figure 1
IDH2 regulation of mitochondrial bioenergetics. A) Prostate adenocarcinoma PC3 cells were transfected with control nontargeting siRNA (siCtrl) or 2 independent IDH2-directed siRNAs (#3 and #5) and analyzed by Western blotting. B) PC3 cells were transfected with siCtrl or IDH1- or IDH2-directed siRNA and analyzed by Western blotting. C, D) PC3 cells transfected as in B were analyzed for OCRs on a Seahorse XFe96 Bioenergetics Flux Analyzer [representative tracings; n = 2 (C)], and basal (left) and maximal (right) respiratory capacities were quantified (D). Means ± sd (n = 22). *P < 0.01, ***P < 0.0001. E) The conditions are as in B, and transfected PC3 cells were analyzed for ECARs on a Seahorse XFe96 Bioenergetics Flux Analyzer. Representative tracings (n = 2). F) PC3 cells transfected as in B were analyzed for glucose consumption (Glu) or lactate production (Lac). Means ± sd (n = 6). *P = 0.01, **P = 0.001, ***P < 0.0001. G) The conditions are as in B, and siRNA-transfected PC3 cells were analyzed for the rate of ATP production on a Seahorse XFe96 Bioenergetics Flux Analyzer. Means ± sd (n = 22). ***P < 0.001. H, I) PC3 cells transfected as in B were analyzed for total ROS (CellRox) or mitochondrial ROS (MitoSox) production by flow cytometry [representative tracings of MitoSox reactivity (H)] and quantified (I). FL2, fluorescence laser 2; Ns, not significant; RU, relative units. Means ± sd (n = 3). *P = 0.04, **P = 0.006, ***P < 0.0001.
Figure 2
Figure 2
IDH2 controls mitochondrial dynamics. A) PC3 cells transfected with siCtrl or siIDH2 were analyzed for mitochondrial morphology by confocal laser microscopy. Representative images. Scale bars, 10 μm. Insets, magnification of indicated areas. B) PC3 cells transfected with siCtrl, 3 independent IDH2-directed siRNAs (1, 2, 3), or IDH2-directed pooled siRNA (P) were quantified for mitochondrial volume. Means ± sd (n = 29–33). *P = 0.01, ***P = 0.0002–0.0003. C) The conditions are as in A, and siRNA-transfected PC3 cells were analyzed for changes in mitochondrial dimension indicative of organelle fusion (>1.3-fold change in mitochondrial volume, positive y scale) or fission (<0.7-fold change in mitochondrial volume, negative y scale), and events were quantified continuously by time-lapse videomicroscopy at the indicated time intervals. Each tracing corresponds to an individual cell. Representative experiment (n = 2). D) The conditions are as in C, and mitochondrial fusion and fission events (60-s interval) were quantified in siRNA-transfected DU145 cells. Means ± sd (n = 13–14). *P = 0.01, **P = 0.001. E) PC3 cells transfected with siCtrl or siIDH2 were fractionated in total (TE), cytosolic (CE), or mitochondrial (ME) extracts and analyzed by Western blotting. F) PC3 cells transfected as in A were labeled with MitoTracker plus an antibody to Ser616-phosphorylated Drp1 and analyzed for signal colocalization by confocal fluorescence microscopy. Representative images (n = 3). G) The experimental conditions are as in F, and colocalization of Ser616-phosphorylated Drp1 and MitoTracker was quantified with determination of a Pearson’s correlation index (PCI). Means ± sd (n = 24–31). *P = 0.01, **P = 0.009, ***P < 0.0001. H) PC3 cells transfected with siCtrl or siIDH2 were analyzed for mitochondrial motility in 2D contour plots in the presence or absence of Drp1-directed siRNA (siDrp1). Each tracing corresponds to the movement of an individual mitochondrion. The cutoff velocities for slow-moving or fast-moving (<16 nm/s or >16 nm/s, respectively) mitochondria are indicated. Representative experiment (n = 2). I) The conditions are as in H, and the speed of mitochondrial movements (top; n = 45–50) and total distance traveled by individual mitochondria (bottom; n = 47–50) were quantified. FI, fold increase; siCtrl, control nontargeting siRNA; VDAC, voltage-dependent anion channel. *P = 0.01, **P = 0.001-0.003, ***P < 0.0001.
Figure 3
Figure 3
IDH2 regulation of tumor cell movements. A) PC3 cells transfected with siCtrl or siIDH2 were labeled with Talin-Red Fluorescent Protein (RFP) and analyzed for FA complex dynamics by time-lapse videomicroscopy. Representative merged frames at 0 h (magenta) and 2 h (cyan) are shown (n = 2). Arrows, position of new, stable, and decayed FA complexes. B) The conditions are as in A, and the percentage of new, stable, or decayed FA complexes was quantified per each condition (siCtrl, n = 12; siIDH2, n = 7). *P = 0.04. C) PC3 cells stably transduced with shCtrl or 3 independent IDH2-directed shRNAs (D11, D12, E1) were analyzed by Western blotting. P, phosphorylated. D) PC3 cells were transfected with siCtrl or siIDH2 and analyzed for cellular motility in 2D contour plots in the presence or absence of Drp1-directed siRNA (siDrp1). Each tracing corresponds to the movements of an individual cell. The cutoff velocities for slow-moving or fast-moving cells (<0.69 or >0.69 μm/min, respectively) are indicated. E, F) The conditions are as in D, and the speed of cell motility n = 45–66 (E)] and total distance traveled by individual cells [n = 58–66 (F)] was quantified. *P = 0.01, **P = 0.003, ***P < 0.0001. G, H) PC3 cells transfected with siCtrl or siIDH2 were analyzed for directional cell migration in a wound-closure assay (G), and the area covered by cell migration was quantified at the indicated time intervals (H). Representative images (n = 3). BAF, binary area fraction; shCtrl, control nontargeting shRNA; siCtrl, control nontargeting siRNA.
Figure 4
Figure 4
Requirements IDH2 regulation of tumor cell motility. A) PC3 cells transfected with siCtrl or siIDH2 were analyzed for cell migration (top) or invasion across Matrigel-coated Transwell inserts (bottom). Representative images of DAPI-stained nuclei of migrated or invaded cells are shown. B) PC3 (top, n = 21–25) or DU145 (bottom, n = 22–24) cells were transfected with siCtrl, 3 independent IDH2-directed siRNAs (#1, #2, #3), or IDH2-directed pooled siRNA (P) and analyzed for Matrigel invasion. Means ± sd. *P = 0.02, ***P < 0.0001. C) PC3 cells transfected as in A were reconstituted with IDH2 cDNA and analyzed for cell migration (top, n = 21–22) or Matrigel invasion (bottom, n = 21–22). Means ± sd. ***P < 0.0001. D, E) PC3 cells transfected with siCtrl or siIDH2 were further transfected with Drp1-directed siRNA (siDrp1) and analyzed by Western blotting (D) or Matrigel invasion [n = 37–45 (E)]. Means ± sd. ***P < 0.0001. F, G) PC3 cells transfected with siCtrl or siIDH2 were incubated with small molecule Akt inhibitor, MK2206, and analyzed by Western blotting (F) or Matrigel invasion (G). siCtrl, control nontargeting siRNA; ns, not significant; p, phosphorylated. Means ± sd (n = 22–24). ***P < 0.0001.
Figure 5
Figure 5
ROS regulation of IDH2-directed tumor cell motility. A) PC3 cells transfected with siCtrl or siIDH2 were reconstituted with Prx3 or loss-of-function Cys108Ser (C108S) Prx3 mutant (Prx3-Mut) and quantified for speed of mitochondrial movements (top, n = 85–92) or distance traveled by individual mitochondria (bottom, n = 85–92). ***P < 0.0001. B) The conditions are as in A, and reconstituted PC3 cells were analyzed for cell motility in 2D contour plots. Each tracing corresponds to the movement of an individual cell. The cutoff velocities for slow-moving or fast-moving (<0.39 μm/min or >0.39 μm/min, respectively) cells are shown. Representative experiment (n = 3). C, D) PC3 cells transfected with siCtrl or siIDH2 and reconstituted as in A were analyzed for cell migration [top n = 10–14 (C)] or Matrigel invasion [bottom n = 10–12 (C)] or Western blotting (D). Means ± sd. ***P < 0.0001. E) PC3 cells transfected with siCtrl or siIDH2 were incubated with the ROS scavenger, MnTBAP, and analyzed by Western blotting. Ns, not significant; p, phosphorylated.
Figure 6
Figure 6
HIF-1α regulation by IDH2. A) PC3 (left) or DU145 (right) cells transfected with siCtrl, 3 independent IDH2-directed siRNAs (1, 2, 3), or pooled IDH2-directed siRNA (P) were analyzed by Western blotting. B) PC3 cells stably transduced with 2 independent control shRNAs (shCtrl #1 and #2) or 3 IDH2-directed shRNAs (D11, D12, and E1) were analyzed by Western blotting. C) PC3 cells transfected with siCtrl, siIDH1, or siIDH2 were analyzed by Western blotting. D) PC3 cells transfected with siCtrl or siIDH2 were reconstituted with vector or IDH2 cDNA and analyzed by Western blotting. E) PC3 cells transfected as in C were analyzed at the indicated time intervals by Western blotting. Bar graph (bottom), densitometric quantification of HIF-1α protein bands. F) PC3 (top) or DU145 (bottom) cells transfected with siCtrl or siIDH2 were incubated with the ROS scavenger, MnTBAP, and analyzed by Western blotting. G) PC3 cells transfected with siCtrl or siIDH2 were reconstituted with Prx3 or loss-of-function C108S Prx3 mutant (Prx3-Mut) and analyzed by Western blotting. H) PC3 cells transfected with siCtrl, siIDH2, or siHIF-1α were analyzed for cell motility in 2D contour plots. Each line corresponds to the movements of an individual cell. The cutoff velocities for slow-moving or fast-moving (<0.45 μm/min or >0.45 μm/min) cells are indicated. Representative experiment (n = 2). I) The conditions are as in H, and the speed of cell movements (top, n = 58–64) and total distance traveled by individual cells (bottom, n = 58–64) was quantified per each condition. *P = 0.01, ***P < 0.0001. J) The conditions are as in H, and siRNA-transfected PC3 cells were analyzed for cell migration (top, n = 13–16) or Matrigel invasion (bottom, n = 23–31). Ns, not significant; shCtrl, control nontargeting shRNA; siCtrl, control nontargeting siRNA. Means ± sd. ***P = 0.0002 to P < 0.0001.
Figure 7
Figure 7
IDH2 regulation of tumor cell invasion in vivo. A) PC3 cells stably transduced with shCtrl or 3 independent IDH2-directed shRNAs (shIDH2 D11, D12, E1) were analyzed by propidium iodide staining and flow cytometry. The percentage of cells in each cell cycle phase is indicated. Apop, apoptotic. B) The conditions are as in A, and stably transduced PC3 cells were analyzed for cell proliferation by direct cell counting at the indicated time intervals. C) PC3 cells stably transduced with shCtrl or shIDH2 were engrafted subcutaneously on the flank of immunocompromised mice, and tumor growth was measured with a caliper at the indicated time intervals. Means ± sd (shCtrl, n = 10; shIDH2, n = 12). D) The conditions are as in C, and tumor volume in each animal group was determined at d 37 postengraftment. Means ± sd. *P = 0.02. E) PC3 cells stably transduced as in A were analyzed for Matrigel invasion. Means ± sd (n = 22–26). ***P < 0.0001. F) PC3 cells stably transduced as in C were injected into the spleen of immunocompromised mice, and metastatic foci to the liver were identified after 11 d by hematoxylin and eosin staining and light microscopy. Representative images; white circles, metastatic foci. G, H) The conditions are as in F, and the number [shCtrl, n = 142, shIDH2, n = 162 (G)] and surface area [shCtrl, n = 142; shIDH2, n = 162 (H)] of liver metastatic foci was quantified in each animal group. shCtrl, control nontargeting shRNA. Means ± sd. **P = 0.004, ***P < 0.0001.

References

    1. Hanahan D., Weinberg R. A. (2011) Hallmarks of cancer: the next generation. Cell 144, 646–674 - PubMed
    1. Ward P. S., Thompson C. B. (2012) Metabolic reprogramming: a cancer hallmark even warburg did not anticipate. Cancer Cell 21, 297–308 - PMC - PubMed
    1. Gatenby R. A., Gillies R. J. (2004) Why do cancers have high aerobic glycolysis? Nat. Rev. Cancer 4, 891–899 - PubMed
    1. Lehuédé C., Dupuy F., Rabinovitch R., Jones R. G., Siegel P. M. (2016) Metabolic plasticity as a determinant of tumor growth and metastasis. Cancer Res. 76, 5201–5208 - PubMed
    1. Tabassum D. P., Polyak K. (2015) Tumorigenesis: it takes a village. Nat. Rev. Cancer 15, 473–483 - PubMed

Publication types

MeSH terms

Substances