

Prediction system for risk of allograft loss in patients receiving kidney transplants: international derivation and validation study
- PMID: 31530561
- PMCID: PMC6746192
- DOI: 10.1136/bmj.l4923
Prediction system for risk of allograft loss in patients receiving kidney transplants: international derivation and validation study
Erratum in
-
Prediction system for risk of allograft loss in patients receiving kidney transplants: international derivation and validation study.BMJ. 2024 Jul 29;386:q1690. doi: 10.1136/bmj.q1690. BMJ. 2024. PMID: 39074850 Free PMC article. No abstract available.
Abstract
Objective: To develop and validate an integrative system to predict long term kidney allograft failure.
Design: International cohort study.
Setting: Three cohorts including kidney transplant recipients from 10 academic medical centres from Europe and the United States.
Participants: Derivation cohort: 4000 consecutive kidney recipients prospectively recruited in four French centres between 2005 and 2014. Validation cohorts: 2129 kidney recipients from three centres in Europe and 1428 from three centres in North America, recruited between 2002 and 2014. Additional validation in three randomised controlled trials (NCT01079143, EudraCT 2007-003213-13, and NCT01873157).
Main outcome measure: Allograft failure (return to dialysis or pre-emptive retransplantation). 32 candidate prognostic factors for kidney allograft survival were assessed.
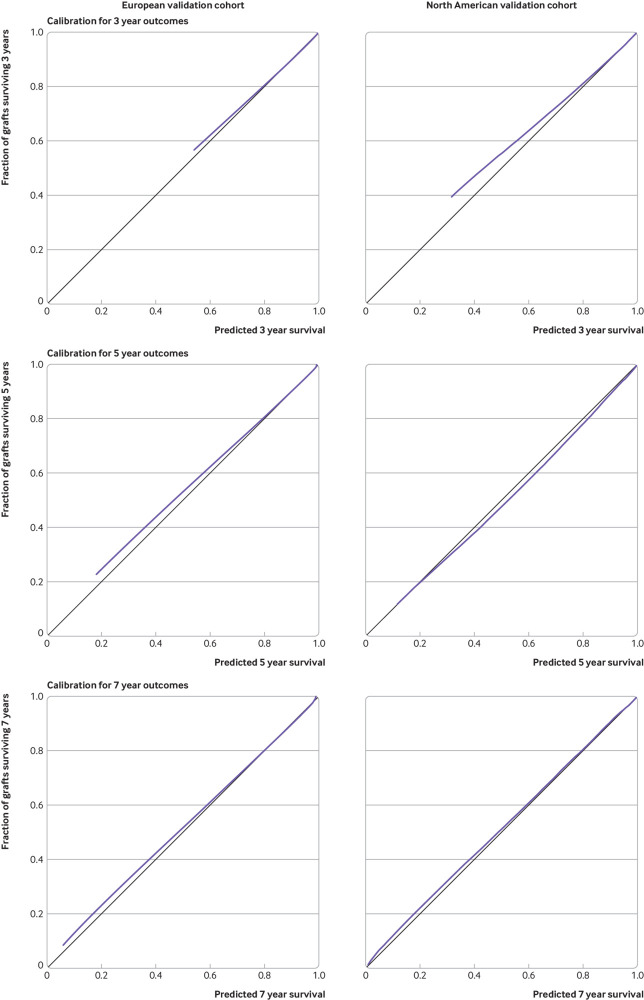
Results: Among the 7557 kidney transplant recipients included, 1067 (14.1%) allografts failed after a median post-transplant follow-up time of 7.12 (interquartile range 3.51-8.77) years. In the derivation cohort, eight functional, histological, and immunological prognostic factors were independently associated with allograft failure and were then combined into a risk prediction score (iBox). This score showed accurate calibration and discrimination (C index 0.81, 95% confidence interval 0.79 to 0.83). The performance of the iBox was also confirmed in the validation cohorts from Europe (C index 0.81, 0.78 to 0.84) and the US (0.80, 0.76 to 0.84). The iBox system showed accuracy when assessed at different times of evaluation post-transplant, was validated in different clinical scenarios including type of immunosuppressive regimen used and response to rejection therapy, and outperformed previous risk prediction scores as well as a risk score based solely on functional parameters including estimated glomerular filtration rate and proteinuria. Finally, the accuracy of the iBox risk score in predicting long term allograft loss was confirmed in the three randomised controlled trials.
Conclusion: An integrative, accurate, and readily implementable risk prediction score for kidney allograft failure has been developed, which shows generalisability across centres worldwide and common clinical scenarios. The iBox risk prediction score may help to guide monitoring of patients and further improve the design and development of a valid and early surrogate endpoint for clinical trials.
Trial registration: Clinicaltrials.gov NCT03474003.
Published by the BMJ Publishing Group Limited. For permission to use (where not already granted under a licence) please go to http://group.bmj.com/group/rights-licensing/permissions.
Conflict of interest statement
Competing interests: All authors have completed the ICMJE uniform disclosure form at www.icmje.org/coi_disclosure.pdf (available on request from the corresponding author) and declare: support as detailed above for the submitted work; AL holds shares in Cibiltech, a company that develops software; no other relationships or activities that could appear to have influenced the submitted work.
Figures
References
Publication types
MeSH terms
Associated data
Grants and funding
LinkOut - more resources
Full Text Sources
Other Literature Sources
Medical