. 2019 Sep 17;9(1):13460.
doi: 10.1038/s41598-019-49921-4.

VX-770-mediated potentiation of numerous human CFTR disease mutants is influenced by phosphorylation level

Affiliations

VX-770-mediated potentiation of numerous human CFTR disease mutants is influenced by phosphorylation level

Guiying Cui et al. Sci Rep. .

Abstract

VX-770 (ivacaftor) is approved for clinical use in CF patients bearing multiple CFTR mutations. VX-770 potentiated wildtype CFTR and several disease mutants expressed in oocytes in a manner modulated by PKA-mediated phosphorylation. Potentiation of some other mutants, including G551D-CFTR, was less dependent upon the level of phosphorylation, likely related to the severe gating defects in these mutants exhibited in part by a shift in PKA sensitivity to activation, possibly due to an electrostatic interaction of D551 with K1250. Phosphorylation-dependent potentiation of wildtype CFTR and other variants also was observed in epithelial cells. Hence, the efficacy of potentiators may be obscured by a ceiling effect when drug screening is performed under strongly phosphorylating conditions. These results should be considered in campaigns for CFTR potentiator discovery, and may enable the expansion of VX-770 to CF patients bearing ultra-orphan CFTR mutations.


Conflict of interest statement

The authors declare no competing interests.

Figures

Figure 1
Figure 1
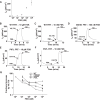
Single channel behavior in WT-CFTR is different in high and low PKA concentration. Representative single-channel current traces are shown for WT-CFTR in low PKA (A, 6.4 U/ml) and high PKA (B, 127.6 U/ml), from one inside-out membrane patch excised from Xenopus oocytes, with symmetrical 150 mM Cl solution in the presence of 1 mM MgATP. All traces were recorded at Vm = -100 mV. c = closed state; f = full open state. All-points amplitude histograms are shown in the right panels, where solid lines are fit results to a Gaussian function. Single channel amplitude (C), open probability (n = 4) (D), and mean burst duration (E) of WT-CFTR in low and high PKA conditions are shown. n = 5. (F) Representative macropatch currents of WT-CFTR recorded in inside-out mode with symmetrical 150 mM Cl solution under the following experimental conditions: channels were fully activated in 1 mM MgATP + 6.4 U/ml PKA followed by 1 mM MgATP + 127.6 U/ml PKA. A voltage-ramp protocol described in the Methods section was applied every 5 s. ▼, 10 µM CFTRinh172.
Figure 2
Figure 2
Cytoplasmic VX-770 potentiated WT-, E193K-, K1060T-, and N1303K-CFTR in a manner sensitive to phosphorylation-level. (A) Three amino acids E193, K1060, N1303 are shown as red spheres in the closed state human CFTR Cryo-EM model adopted from previous publication and prepared with PyMOL. TM6 is indicated in blue shades. Representative macropatch currents of CFTR (WT: (B,C); E193K: (D,E); K1060T: (F,G); N1303K: (H,I)) were recorded in inside-out mode with symmetrical 150 mM Cl solution under the following experimental conditions: channels were activated in 1 mM MgATP + 6.4 U/ml (low PKA) or 127.6 U/ml PKA (high PKA) for ten minutes followed with addition of 0.2 µM VX-770 in the continuing presence of MgATP + PKA for about three minutes; currents then were blocked by 10 µM CFTRinh172 (▼). A voltage-ramp protocol described in the Methods section was applied every 5 s. J. Summary data for fractional increase of WT- and three disease CFTR mutants by VX-770 under each set of conditions are shown (Fractional increase = I(ATP+PKA+VX-770)/I(ATP+PKA) − 1). Black bars are from experiments with high PKA and gray bars are from experiments with low PKA. WT: n = 6 for high PKA; n = 5 for low PKA. E193K, n = 5 for both high and low PKA. N1303K: n = 5 for high PKA; n = 4 for low PKA. K1060T, n = 5 for high PKA; n = 8 for low PKA. *P < 0.05, **P < 0.01 and ***P < 0.001 compared to high PKA condition.
Figure 3
Figure 3
VX-770 potentiated F508del-, P67L-, and G551D-CFTR in a manner less sensitive to phosphorylation level. (A) Three amino acids F508, P67, and G551 are shown as red spheres in the closed state human CFTR Cryo-EM model adopted from previous publication and prepared with PyMOL. TM6 is indicated in blue shades. Representative macropatch currents of CFTR (F508del: (B,C); P67L: (D,E); G551D: (F,G)) recorded in inside-out mode with the same experimental conditions as Fig. 2. ▼, 10 µM CFTRinh172. (H) Summary data for fractional increase of WT- and three disease mutant CFTR variants by VX-770 under high and low PKA are shown. F508del: n = 10 for high PKA; n = 5 for low PKA. P67L: n = 6 for high PKA; n = 5 for low PKA. G551D: n = 5 for high PKA; n = 6 for low PKA. *P < 0.05 and ***P < 0.001 compared to high PKA condition.
Figure 4
Figure 4
VX-770 potentiated F508S- and F508C-CFTR similarly to F508del-CFTR. VX-770 (0.2 µM) potentiated F508S-CFTR in high (A) and low (B) PKA concentrations with 1 mM MgATP. Representative current traces of F508C-CFTR potentiated by VX-770 in high (C) and low PKA (D) conditions also are shown. ▼, 10 µM CFTRinh172. Summary data for F508S- and F508C-CFTR potentiated by VX-770 are shown in (H). F508C: n = 7 for high PKA; n = 6 for low PKA. F508S: n = 6 for high PKA; n = 4 for low PKA. Representative current traces of F508del- (E), F508S- (F), and F508C- (G) CFTR activated by low PKA then by high PKA in the presence of 1 mM MgATP are shown. Summary data for the ratio of three F508 mutants in high and low PKA conditions are shown in panel I and calculated based on the equation in Fig. 1. n = 6 for F508del; n = 6 for F508S; n = 4 for F508C. *P < 0.05 compared to WT.
Figure 5
Figure 5
Activation rates of P67L- and N66S-CFTR are lower compared to WT-CFTR under high PKA conditions. Both P67 and N66 are located in the Lasso motif shown in panel I as red spheres in the closed state human CFTR Cryo-EM model prepared with PyMOL. TM6 is indicated in blue color. (A,B) P67L- and N66S- activation durations are significantly longer than WT-CFTR in 1 mM MgATP + 127.6 U/ml PKA condition. (C,D) Both P67L- and N66S-CFTR exhibited a shift in PKA sensitivity. (E,F) Representative current traces of P67L potentiated by VX-770 after channels were fully activated in both high and low PKA conditions. (G,H) Representative current traces of N66S potentiated by VX-770 after channels were fully activated in both high and low PKA condition. ▼, 10 µM CFTRinh172. Summary data for activation durations are shown in panel (J). n = 30 for WT, n = 9 for P67L, and n = 10 for N66S. ***P < 0.001 compared to WT. Summary data for the ratio of P67L- and N66S-CFTR currents in low and high concentration of PKA are shown in panel (K) calculated based on the equation in Fig. 1. *P < 0.05 compared to WT. Summary data of P67L- and N66S-CFTR potentiated by VX-770 are shown in panel (L). n = 6 for both P67L and N66S in both low and high PKA conditions.
Figure 6
Figure 6
Activation of G551D-CFTR is slowed compared to WT-CFTR under the same experimental conditions. Representative current traces of WT- (A) and G551D-CFTR (B) recorded in symmetrical 150 mM Cl solution with 1 mM MgATP + 127.6 U/ml PKA using excised inside-out macropatch. The recordings were arbitrarily halted at 52 minutes even if the channels were not fully activated. (C) G551A-, (D) K1250A-, and (E) G551D/K1250A-CFTR activation durations were determined under the same experimental conditions as (A,B). Control, intracellular solution alone, without ATP or PKA. ▼, 10 µM CFTRinh172. Summary data are shown in panel (F). The estimated activation duration of G551D-CFTR is significantly longer than that of WT-CFTR (***P < 0.001 compared to WT). The activation duration of K1250A-CFTR is similar to that of WT-CFTR. Activation durations of G551A-, K1250A-, and G551D/K1250A-CFTR were significantly shorter compared to G551D-CFTR (#P < 0.001 compared to G551D-CFTR) (F). n = 30 each for WT-, G551D-, and G551A-CFTR. n = 13 for K1250A-CFTR. n = 18 for G551D/K1250A-CFTR. (G). Amino acid G551 is shown as red spheres and K1250 is shown as blue spheres in the closed state (0 ns) and open state (10 ns) simulations of the CFTR homology model adopted from our previous publication and prepared with PyMOL. TM1–6 are indicated in blue shades and TM7–12 are indicated in orange shades. NBD1 is indicated in light blue and NBD2 is indicated in light green.
Figure 7
Figure 7
Cytoplasmic VX-770 potentiates G551D- and G551A-CFTR in a phosphorylation-dependent manner when channels were fully activated, albeit with much lower efficacy. Representative current traces of G551D- (A,B) and G551A-CFTR (C,D) recorded under the same conditions as in Fig. 3, except that channels were fully activated in 1 mM MgATP plus low or high PKA before addition of VX-770 in the continuing presence of ATP and PKA. ▼, 10 µM CFTRinh172. Summary data for effects of 0.2 µM VX-770 on WT-, G551D-, and G551A-CFTR are shown in (E). *P < 0.05, **P < 0.01, and ***P < 0.001 compared to high PKA. G551D: n = 8 for high PKA; n = 7 for low PKA. G551A: n = 5 for high PKA; n = 6 for low PKA. Data for WT-CFTR are the same as in Fig. 2.
Figure 8
Figure 8
Cytoplasmic 0.2 µM VX-770 strongly potentiates K1250A- and G551D/K1250A-CFTR and promotes activation of WT- as well as G551D-CFTR. K1250A- (A) and G551D/K1250A-CFTR (B) were recorded under the same experimental conditions as in Fig. 2. Fractional increases for K1250A- and G551D/K1250A-CFTR were calculated with the equation described in Fig. 2. Summary data are shown in (C). *P < 0.05, and **P < 0.01 compared to WT-CFTR. n = 10 for K1250A; n = 6 for G551D/K1250A. VX-770 accelerated activation of WT- as well as G551D-CFTR. WT- (D) and G551D-CFTR (E) were activated in the presence of 0.2 µM VX-770 + 1 mM MgATP + 127.6 U/ml PKA. ▼, 10 µM CFTRinh172. (F) Summary data for mean activation durations. **P < 0.01 and *** P < 0.001 compared to control conditions (ATP + PKA). n = 9 for WT. n = 12 for G551D.
Figure 9
Figure 9
G551D-CFTR current exhibits decreased rate of deactivation upon removal of ATP and PKA. Representative current traces for G551D- (A) and G551A-CFTR (B) activated with 1 mM MgATP + 127.6 U/ml PKA then deactivated by washout of ATP and PKA with intracellular solution (control). A voltage ramp protocol described in the Methods section was applied every 5 s. Summary data for deactivation are shown in (C,D) and follow the equation (I/Imax = I (remaining current)/I (maximum current in ATP+PKA)). ***, P < 0.001 compared with G551A. n = 5 for both G551A and G551D. (E) VX-770 significantly slowed the rate of deactivation of G551D-CFTR upon removal of ATP + PKA + VX-770. Representative current traces for G551D-CFTR activated with 1 mM MgATP + 127.6 U/ml PKA + 0.2 µM VX-770 for about 20 minutes then deactivated by washout with intracellular solution (control) for >25 minutes followed with 10 µM CFTRinh172 (▼). Summary data for deactivation are shown in (F,G). *P < 0.05 and ***P < 0.001 compared with G551D in the absence of VX-770. n = 5. (H) Representative single channel current traces of WT- and G551D-CFTR recorded in symmetrical 150 mM Cl solution. Data for G551D-CFTR is from the same patch for pre- and post-VX-770. Summary data for mean burst durations are shown in (I). Mean burst duration for G551D-CFTR was significantly shorter than for WT-CFTR. Mean burst duration for G551D-CFTR in the presence of VX-770 was significantly longer than for ATP + PKA alone. n = 5 for G551D-CFTR. WT-CFTR data cited from previous publication. **P < 0.01 compared with WT-CFTR. ***P < 0.001 compared with G551D-CFTR in pre-VX-770 condition.
Figure 10
Figure 10
Efficacy of potentiation by 1 µM VX-770 of WT-, F508del-, P67L-, and G551D-CFTR expressed in FRT cells by 1 µM VX-770 is inversely proportional to the phosphorylation level. (A) Summary data showing a dose-response curve for forskolin (FSK) in FRT cells expressing WT-CFTR. n = 4. (B,C) Representative current traces of WT-CFTR activated by high and low FSK. Activation of FRT cells expressing WT-CFTR using 10 µM FSK led to near maximal currents; subsequent treatment with VX-770 led to a potentiation ratio of 0.5 ± 0.03 (Fractional increase = Ipost/Ipre − 1; Ipost, with VX-770; Ipre, without VX-770). Channels activated with 10 nM FSK were potentiated by 4.6 ± 0.15 fold. Representative current traces of G551D- (D) and P67L-CFTR (E,F) are shown. INH172, 10 µM CFTRinh172. (G) VX-770 potentiated WT-, as well as three CFTR variants in a manner variably dependent upon FSK concentration. WT-CFTR: P < 0.05, comparing 10 µM FSK vs 10 nM FSK; P < 0.05, 10 µM vs 100 nM. G551D-CFTR: P < 0.05, 10 µM vs 10 nM. F508del-CFTR: P < 0.05, 10 µM vs 10 nM. P67LCFTR: P < 0.05, 10 µM vs 10 nM. n = 5 for WT-CFTR. n = 3 each for F508del-, G551D-, and P67L-CFTR.

Similar articles

Cited by

References

    1. Gadsby DC, Vergani P, Csanady L. The ABC protein turned chloride channel whose failure causes cystic fibrosis. Nature. 2006;440:477–483. doi: 10.1038/nature04712. - DOI - PMC - PubMed
    1. Zhang ZR, et al. Determination of the functional unit of the cystic fibrosis transmembrane conductance regulator chloride channel. One polypeptide forms one pore. The Journal of biological chemistry. 2005;280:458–468. doi: 10.1074/jbc.M409626200. - DOI - PubMed
    1. Zhang Z, Chen J. Atomic Structure of the Cystic Fibrosis Transmembrane Conductance Regulator. Cell. 2016;167:1586–1597.e1589. doi: 10.1016/j.cell.2016.11.014. - DOI - PubMed
    1. Zhang Z, Liu F, Chen J. Conformational Changes of CFTR upon Phosphorylation and ATP Binding. Cell. 2017;170:483–491.e488. doi: 10.1016/j.cell.2017.06.041. - DOI - PubMed
    1. Liu F, Zhang Z, Csanady L, Gadsby DC, Chen J. Molecular Structure of the Human CFTR Ion Channel. Cell. 2017;169:85–95.e88. doi: 10.1016/j.cell.2017.02.024. - DOI - PubMed

Publication types