

Automated Estimation of Acute Infarct Volume from Noncontrast Head CT Using Image Intensity Inhomogeneity Correction
- PMID: 31531008
- PMCID: PMC6719274
- DOI: 10.1155/2019/1720270
Automated Estimation of Acute Infarct Volume from Noncontrast Head CT Using Image Intensity Inhomogeneity Correction
Abstract
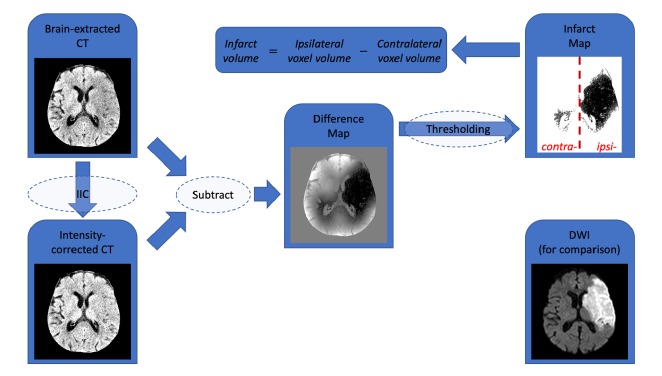
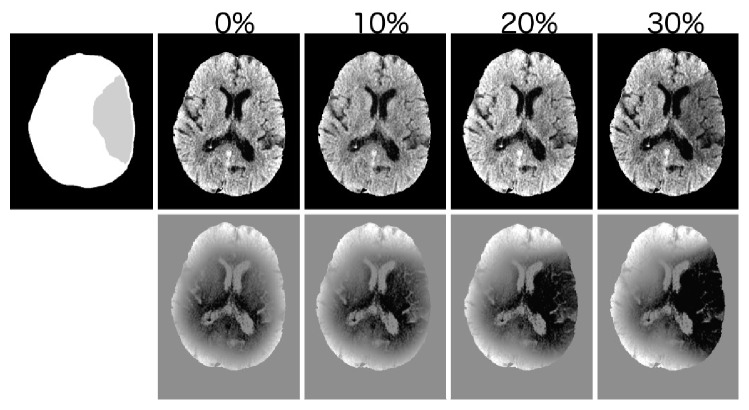
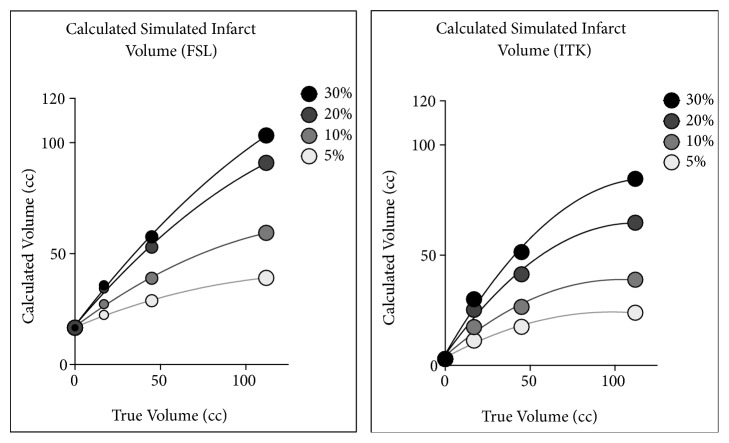
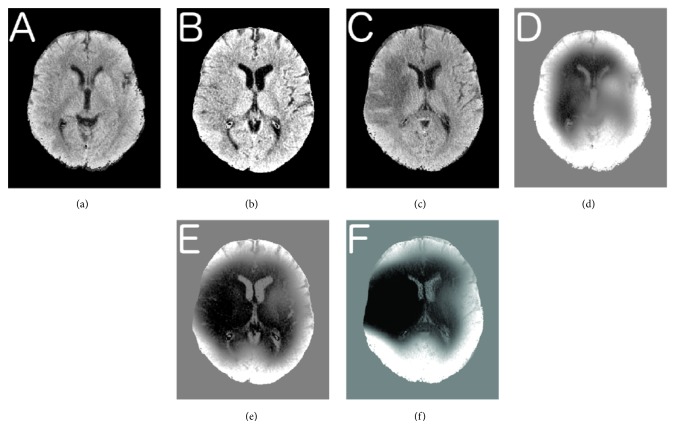
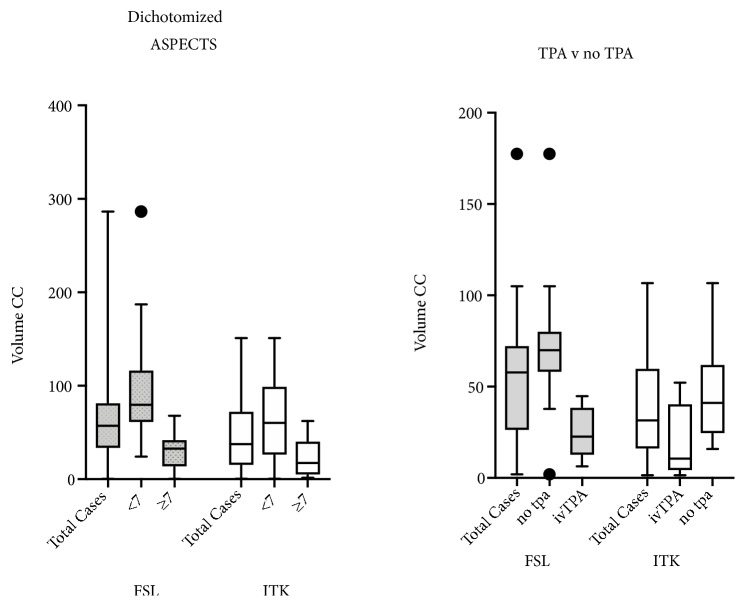
Identification of early ischemic changes (EIC) on noncontrast head CT scans performed within the first few hours of stroke onset may have important implications for subsequent treatment, though early stroke is poorly delimited on these studies. Lack of sharp lesion boundary delineation in early infarcts precludes manual volume measures, as well as measures using edge-detection or region-filling algorithms. We wished to test a hypothesis that image intensity inhomogeneity correction may provide a sensitive method for identifying the subtle regional hypodensity which is characteristic of early ischemic infarcts. A digital image analysis algorithm was developed using image intensity inhomogeneity correction (IIC) and intensity thresholding. Two different IIC algorithms (FSL and ITK) were compared. The method was evaluated using simulated infarcts and clinical cases. For synthetic infarcts, measured infarct volumes demonstrated strong correlation to the true lesion volume (for 20% decreased density "infarcts," Pearson r = 0.998 for both algorithms); both algorithms demonstrated improved accuracy with increasing lesion size and decreasing lesion density. In clinical cases (41 acute infarcts in 30 patients), calculated infarct volumes using FSL IIC correlated with the ASPECTS scores (Pearson r = 0.680) and the admission NIHSS (Pearson r = 0.544). Calculated infarct volumes were highly correlated with the clinical decision to treat with IV-tPA. Image intensity inhomogeneity correction, when applied to noncontrast head CT, provides a tool for image analysis to aid in detection of EIC, as well as to evaluate and guide improvements in scan quality for optimal detection of EIC.
Conflict of interest statement
The authors declare that they have no conflicts of interest.
Figures
References
-
- Larrue V., von Kummer R., Müller A., Bluhmki E. Risk factors for severe hemorrhagic transformation in ischemic stroke patients treated with recombinant tissue plasminogen activator: a secondary analysis of the European-Australasian Acute Stroke Study (ECASS II) Stroke. 2001;32(2):438–441. doi: 10.1161/01.STR.32.2.438. - DOI - PubMed
-
- Tanne D., Kasner S. E., Demchuk A. M., et al. Markers of increased risk of intracerebral hemorrhage after intravenous recombinant tissue plasminogen activator therapy for acute ischemic stroke in clinical practice: the multicenter rt-PA acute stroke survey. Circulation. 2002;105(14):1679–1685. doi: 10.1161/01.cir.0000012747.53592.6a. - DOI - PubMed
LinkOut - more resources
Full Text Sources
