. 2020 Jan 1;173(1):202-225.
doi: 10.1093/toxsci/kfz201.

Utility of In Vitro Bioactivity as a Lower Bound Estimate of In Vivo Adverse Effect Levels and in Risk-Based Prioritization

Affiliations

Utility of In Vitro Bioactivity as a Lower Bound Estimate of In Vivo Adverse Effect Levels and in Risk-Based Prioritization

Katie Paul Friedman et al. Toxicol Sci. .

Abstract

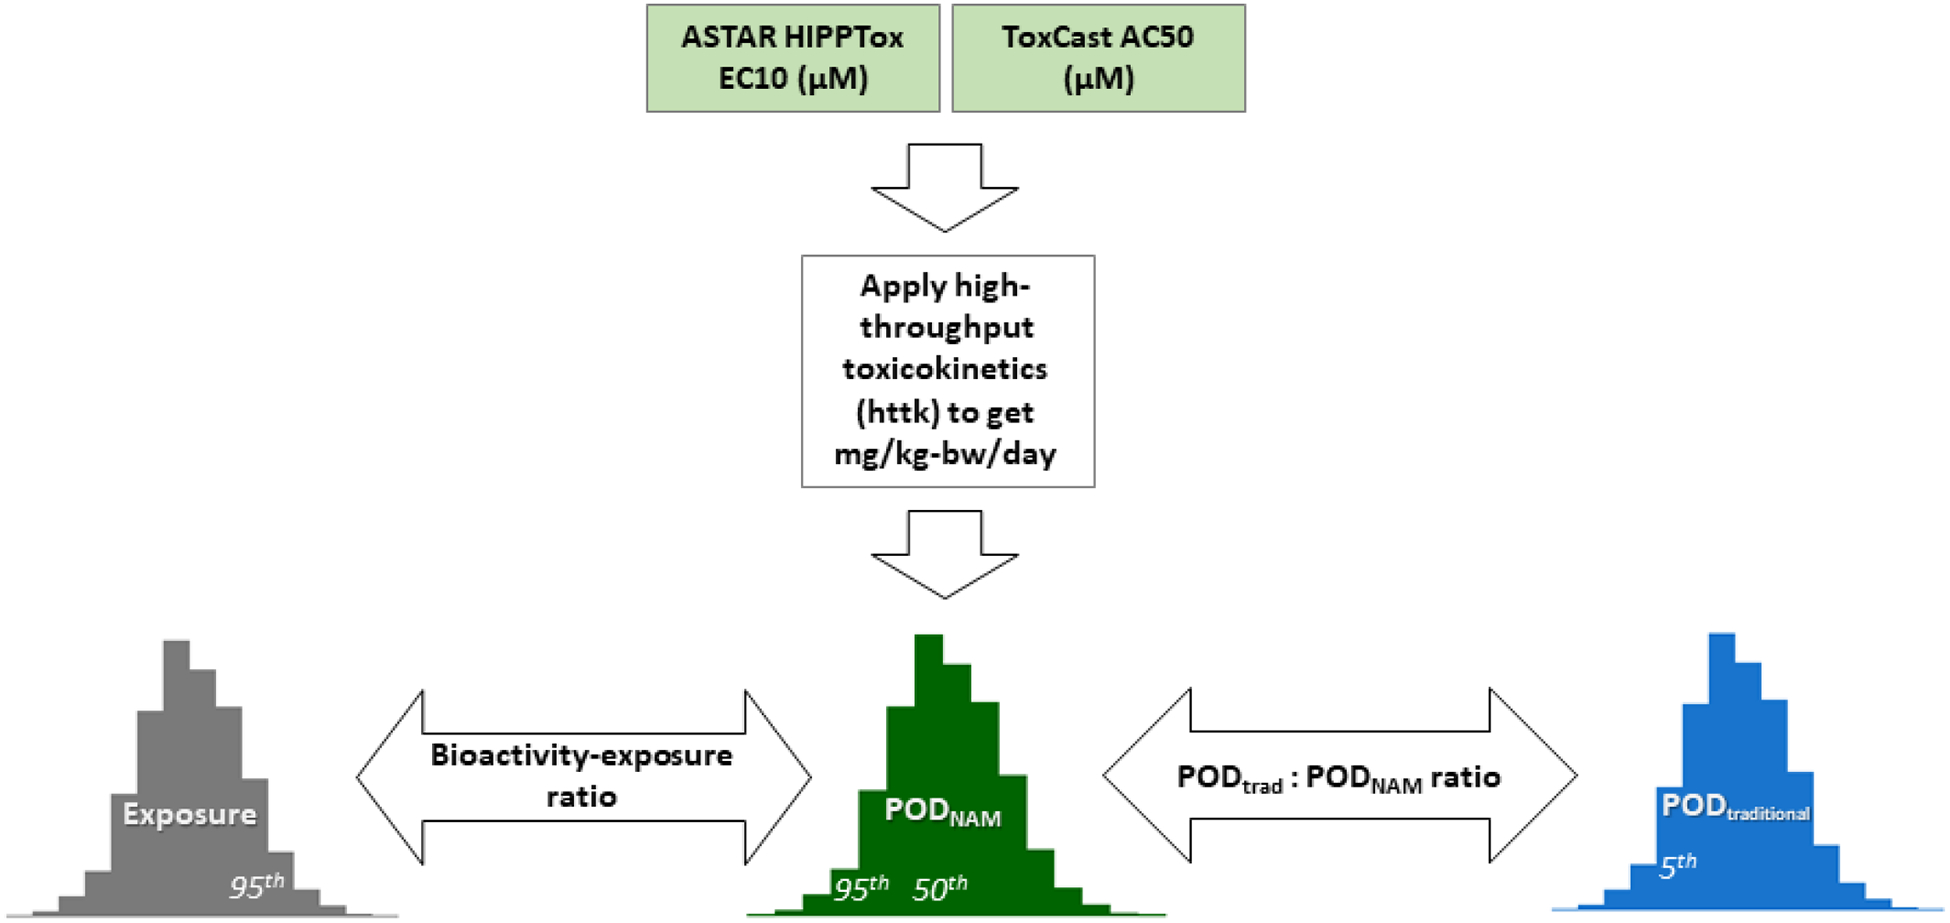
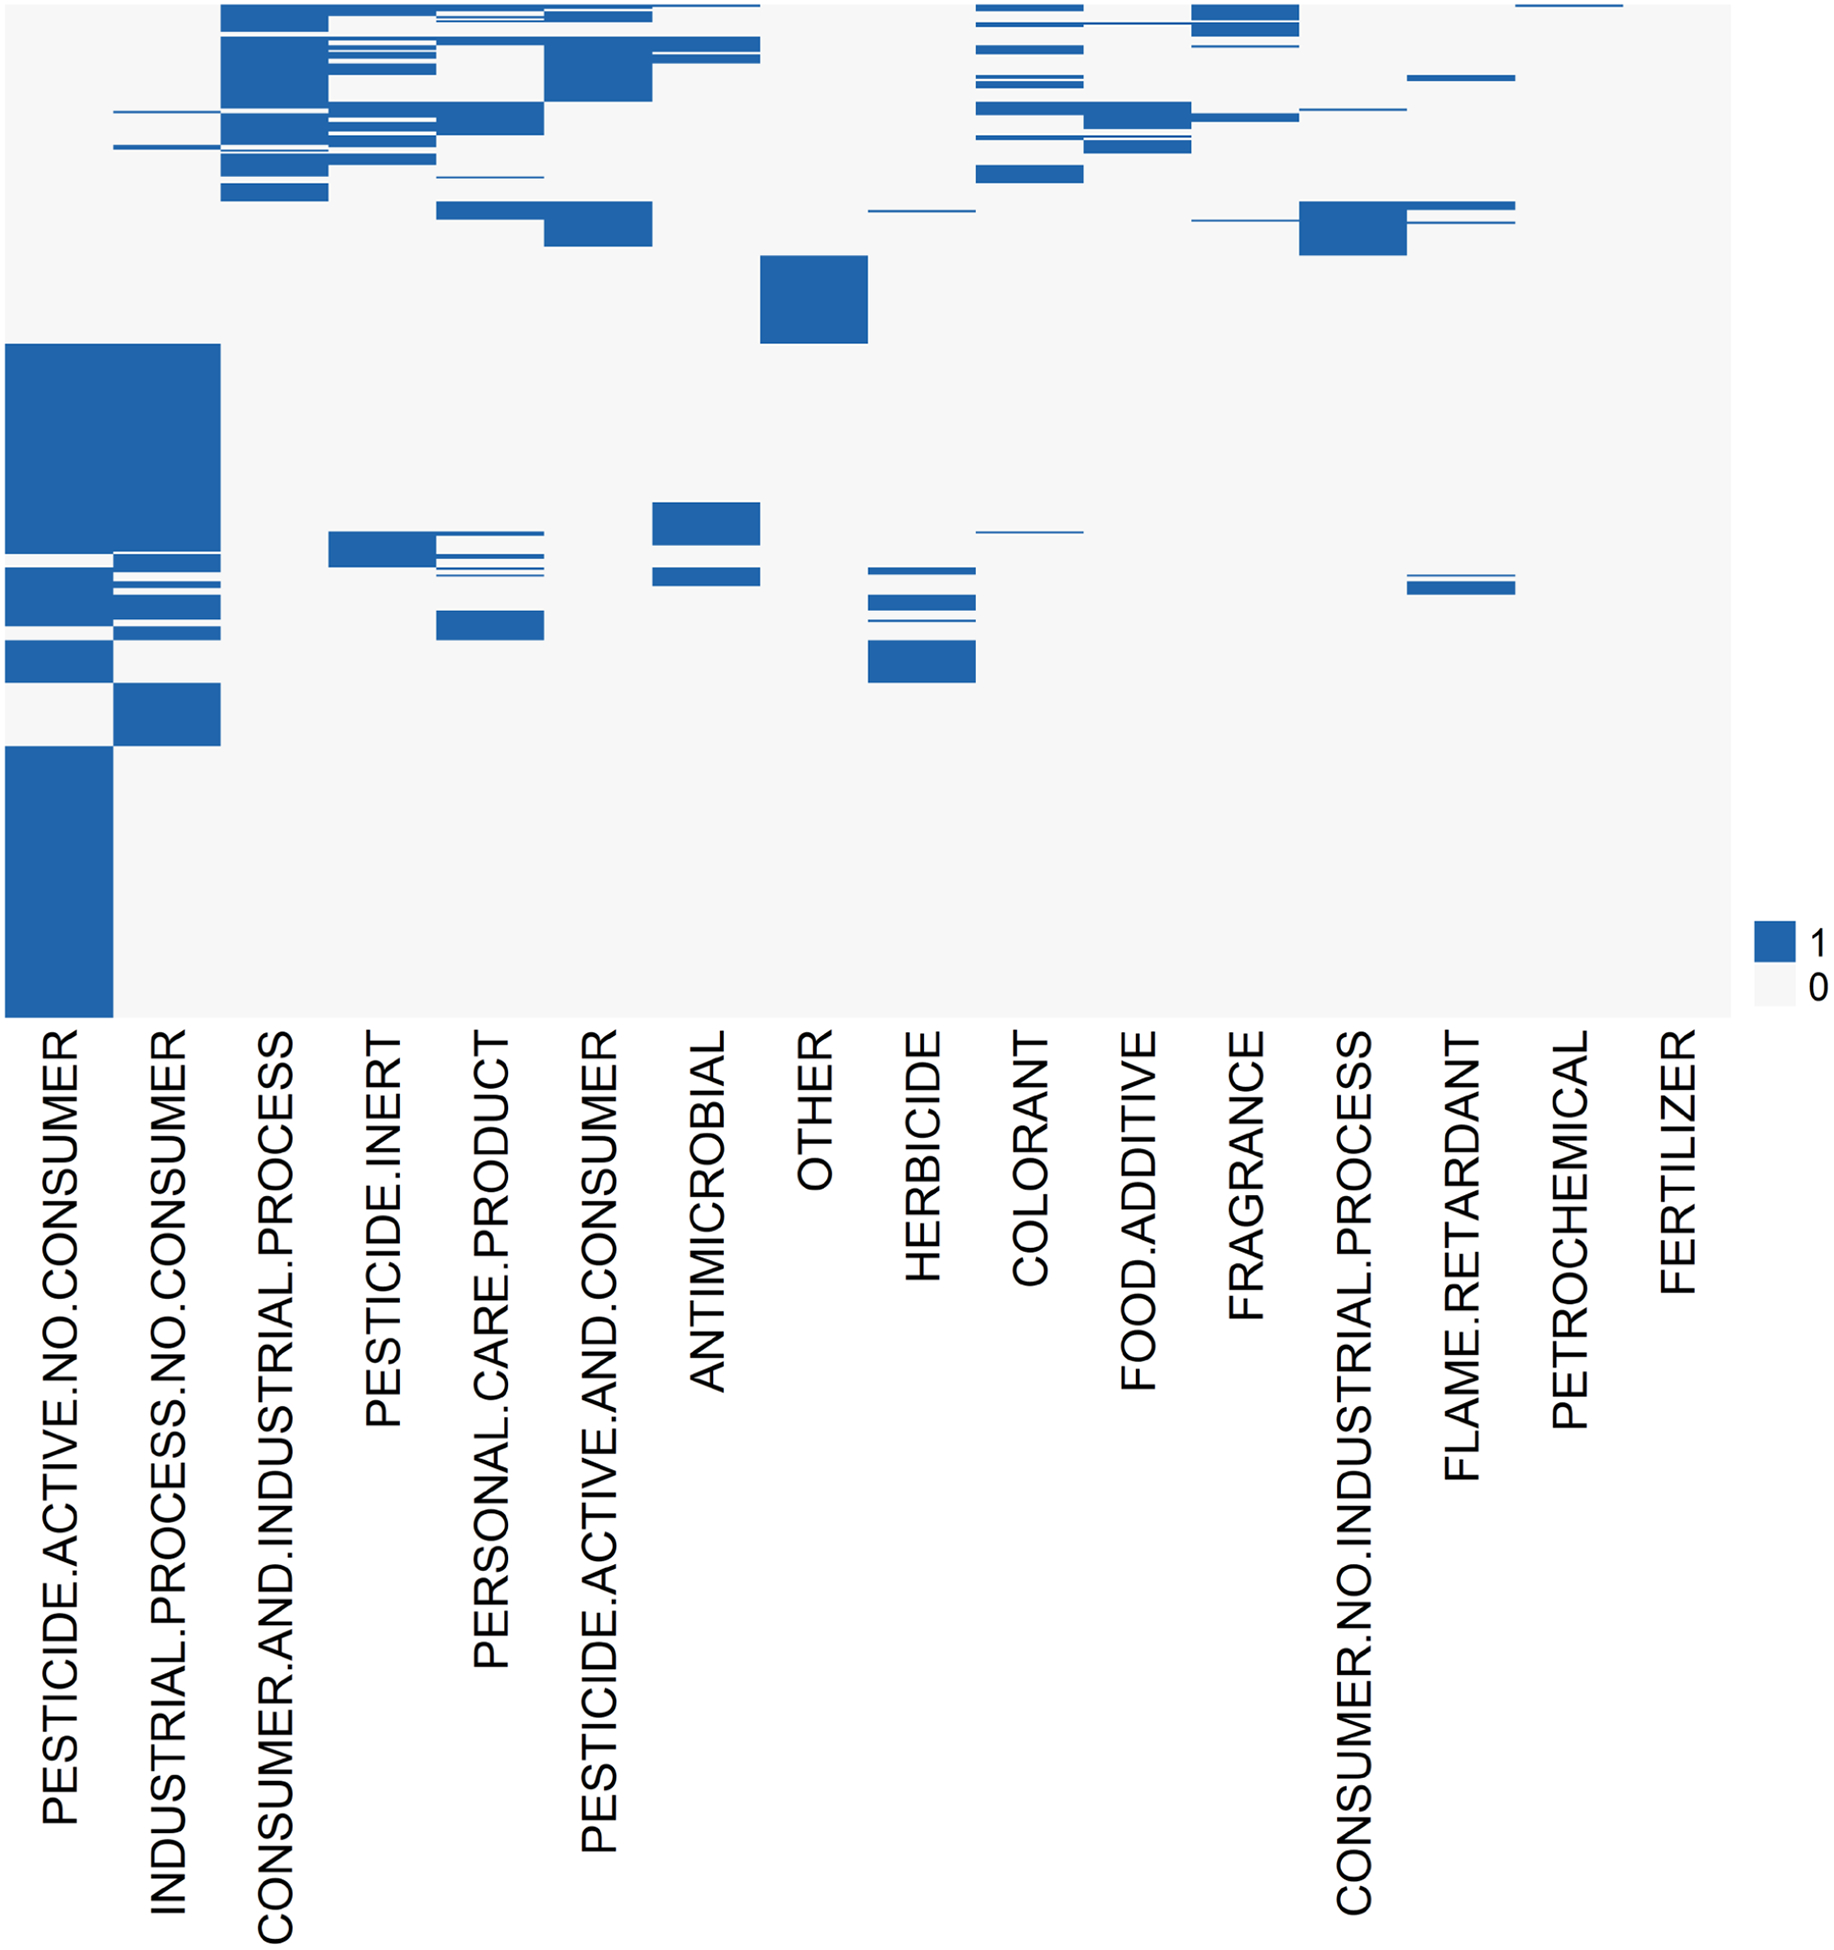
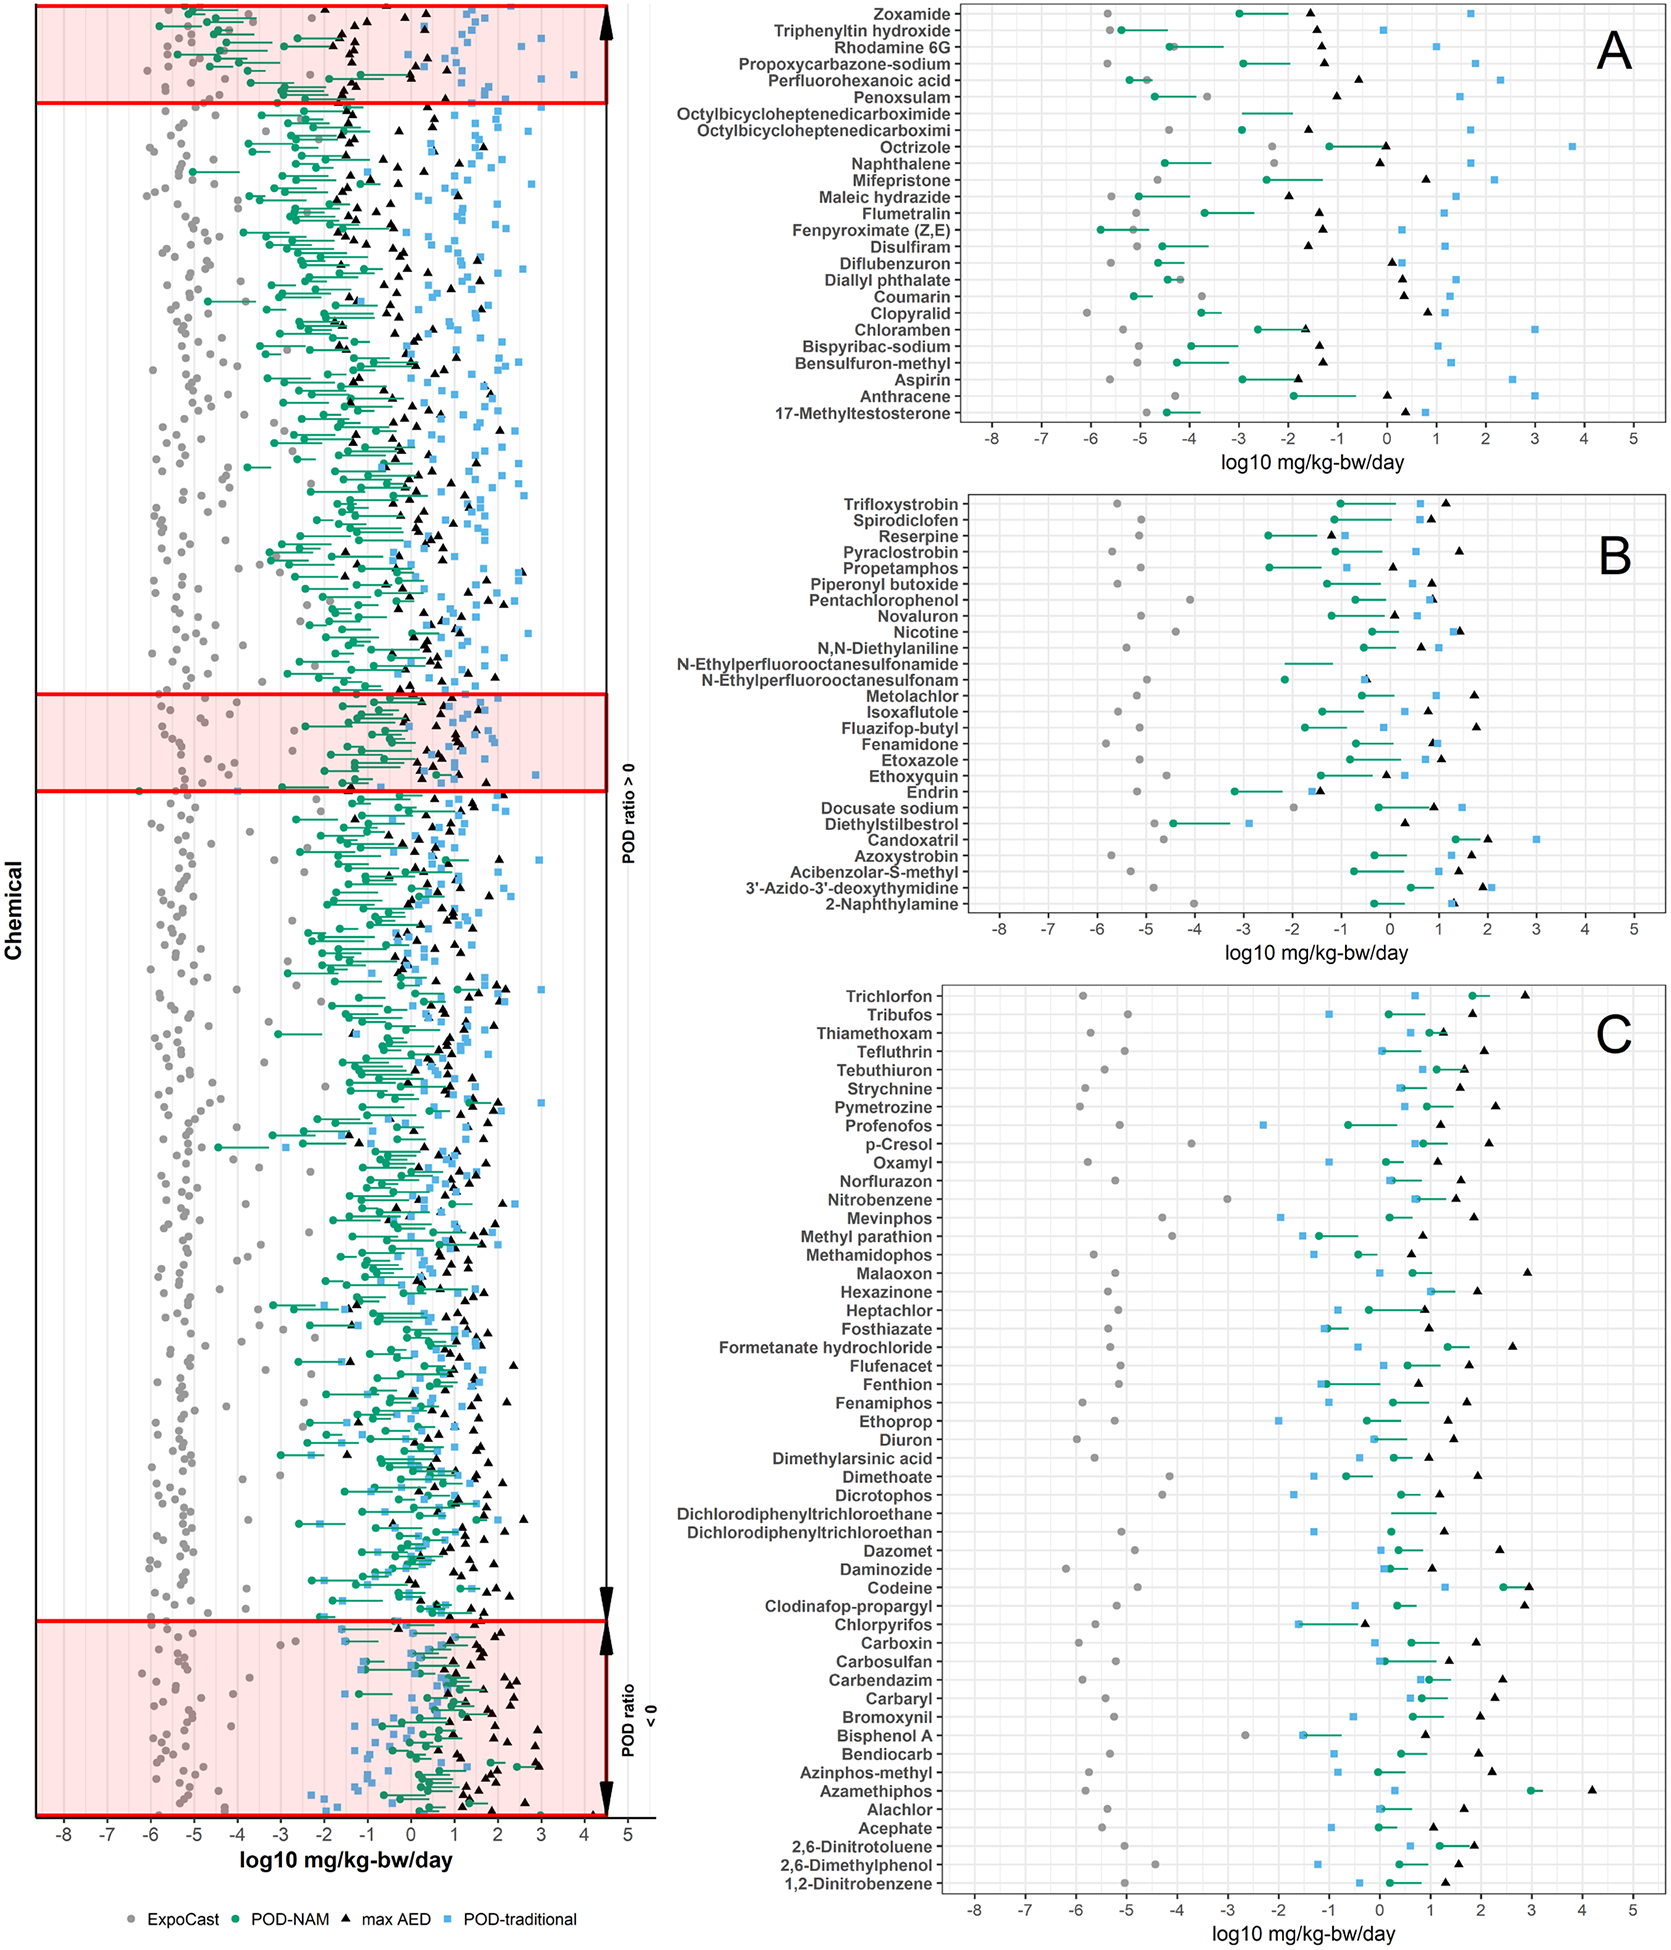
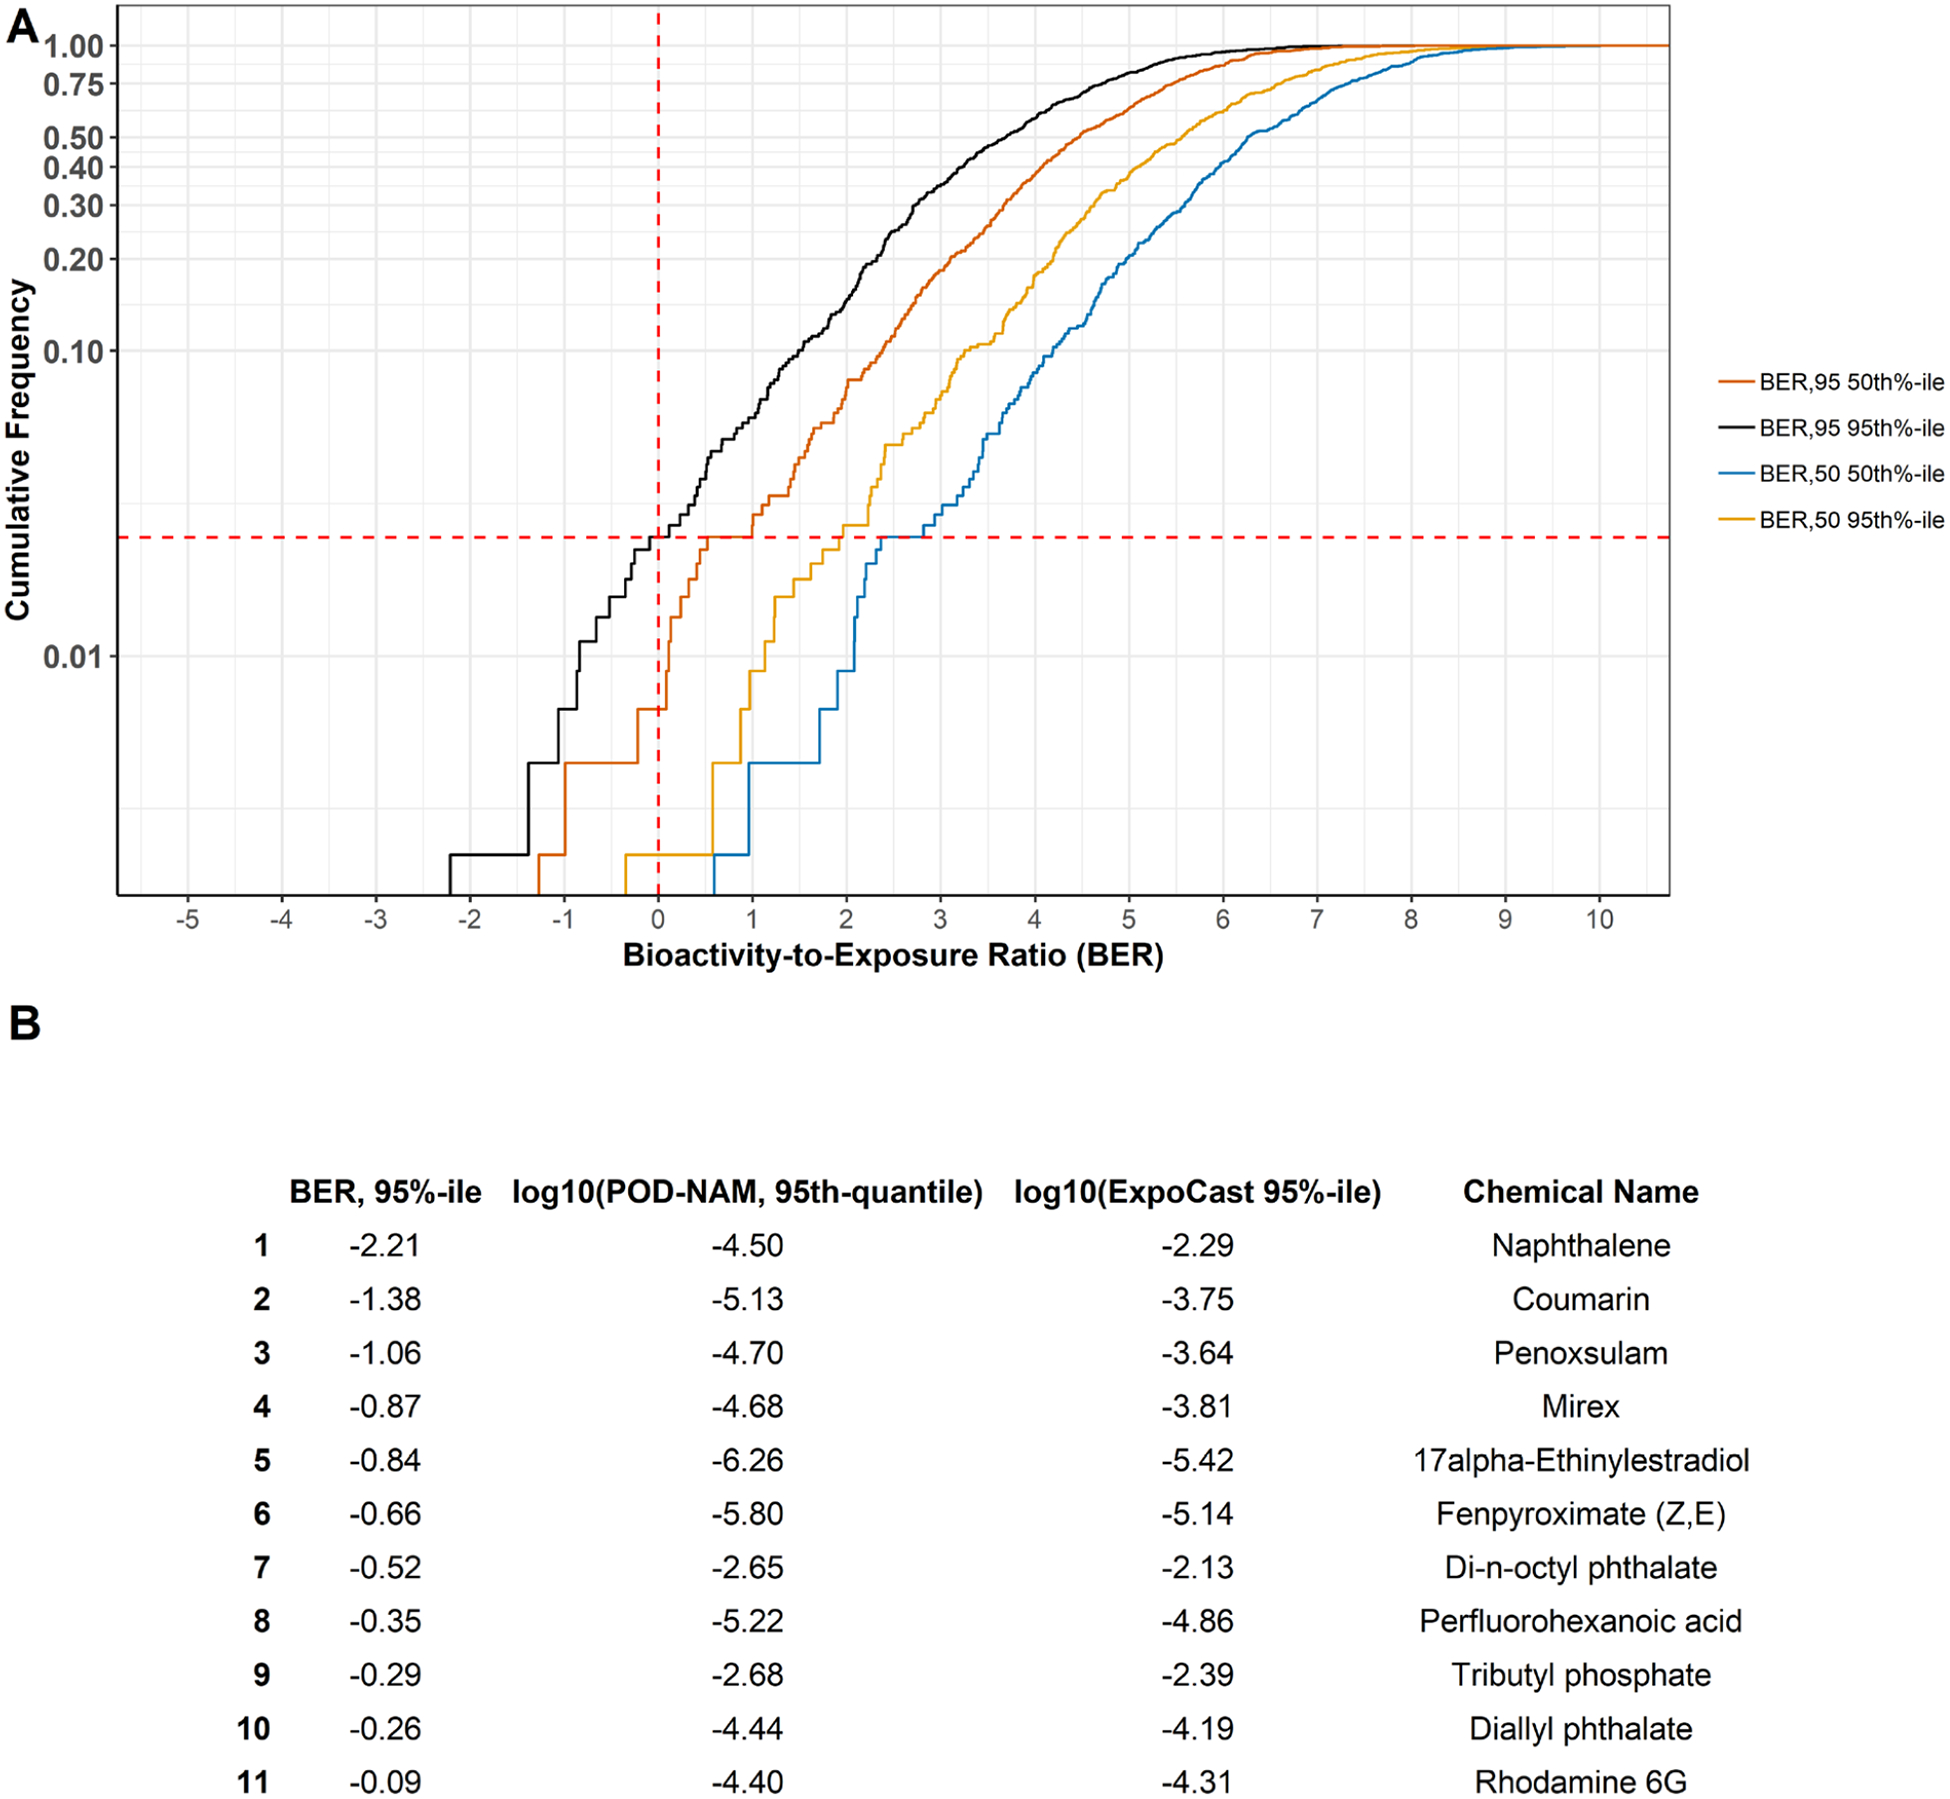
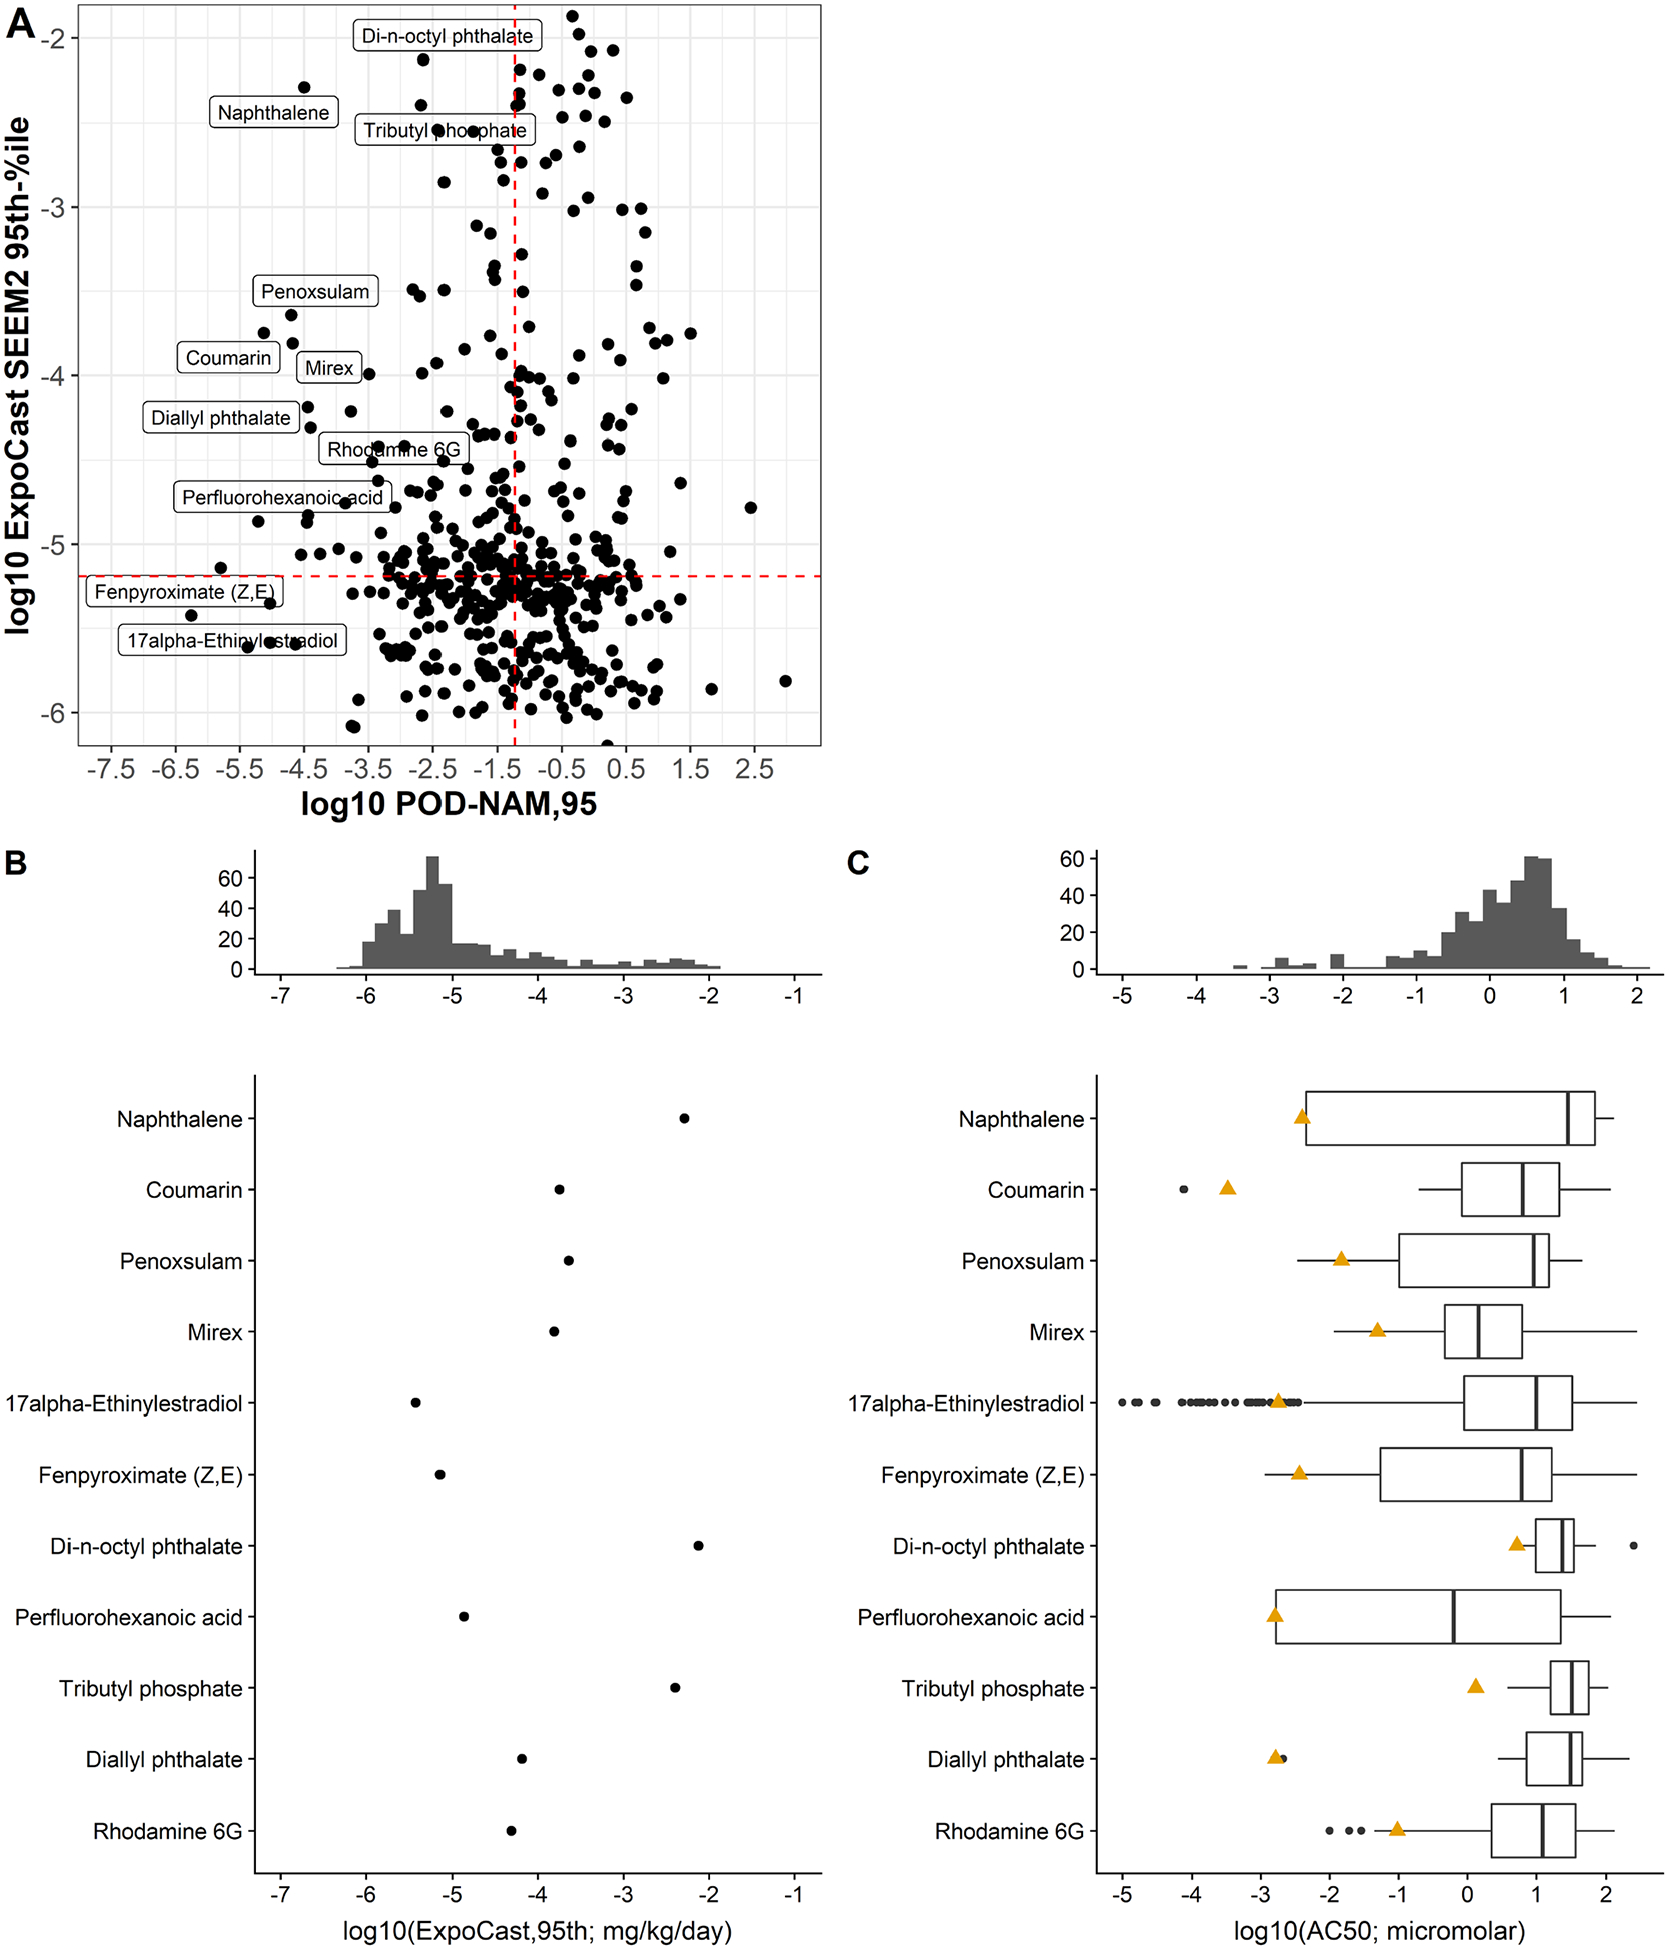
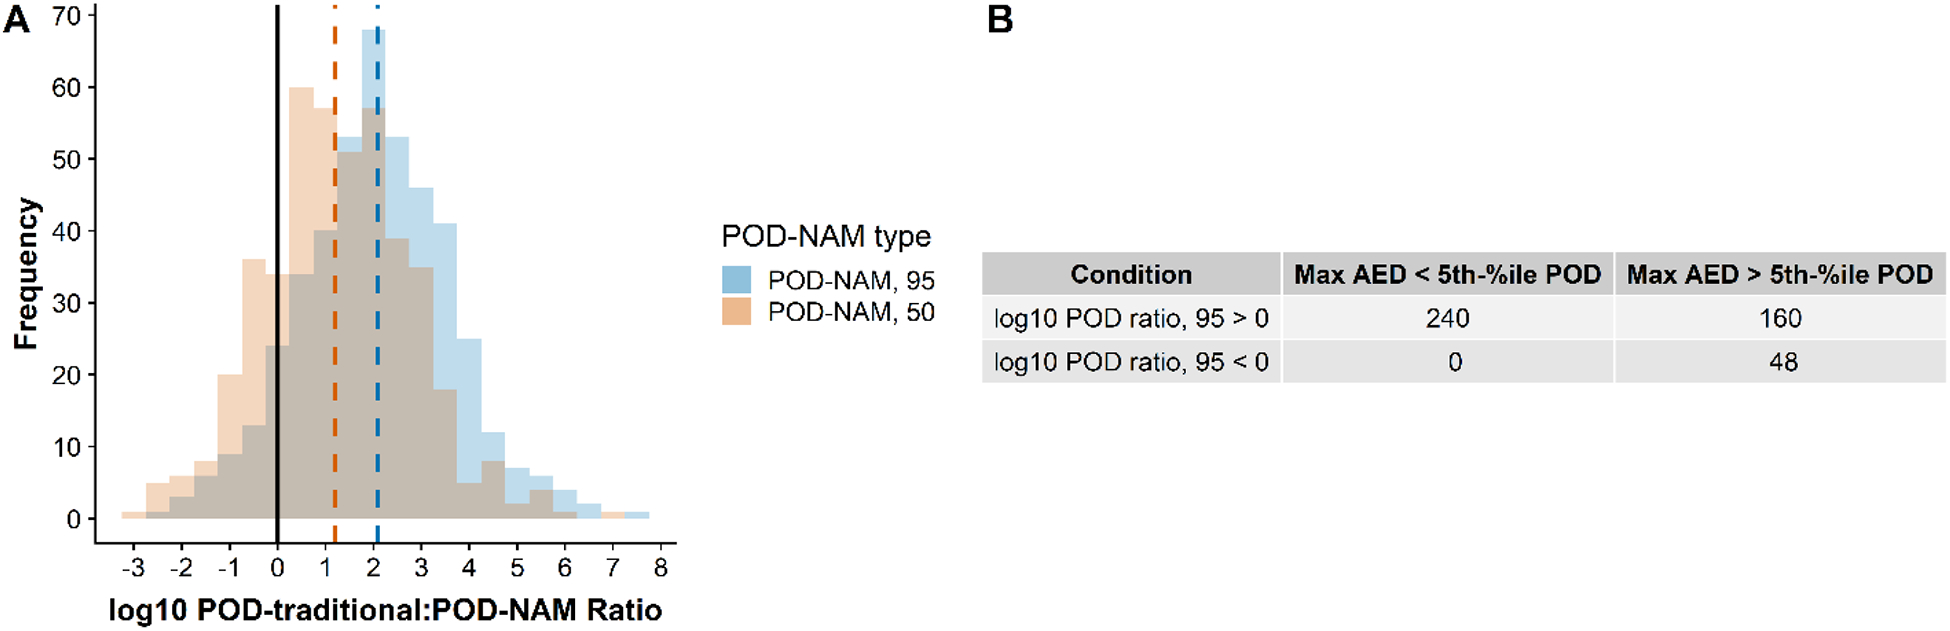
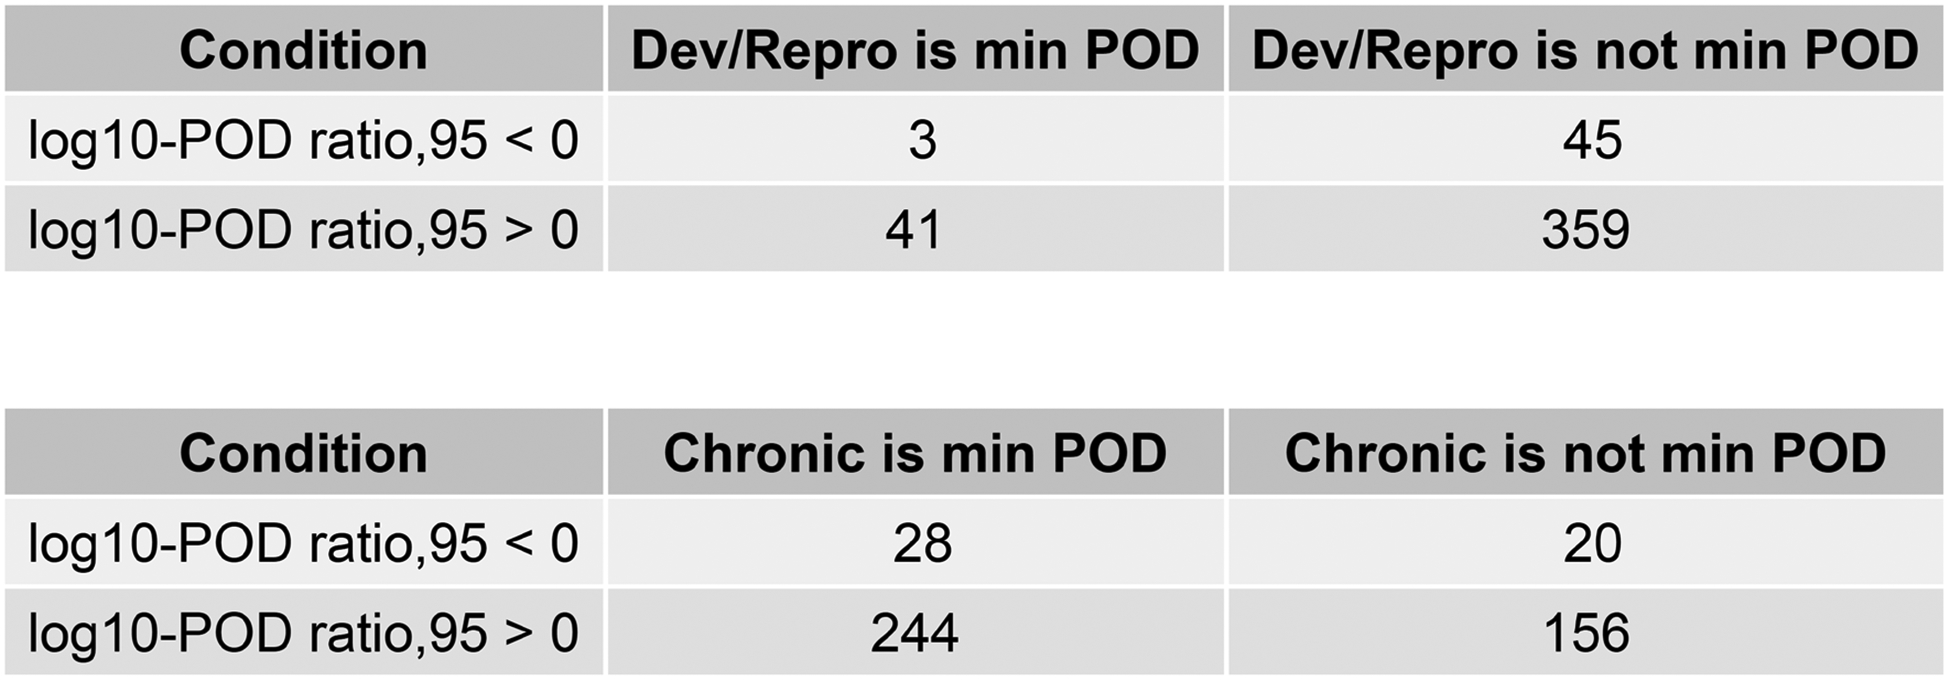
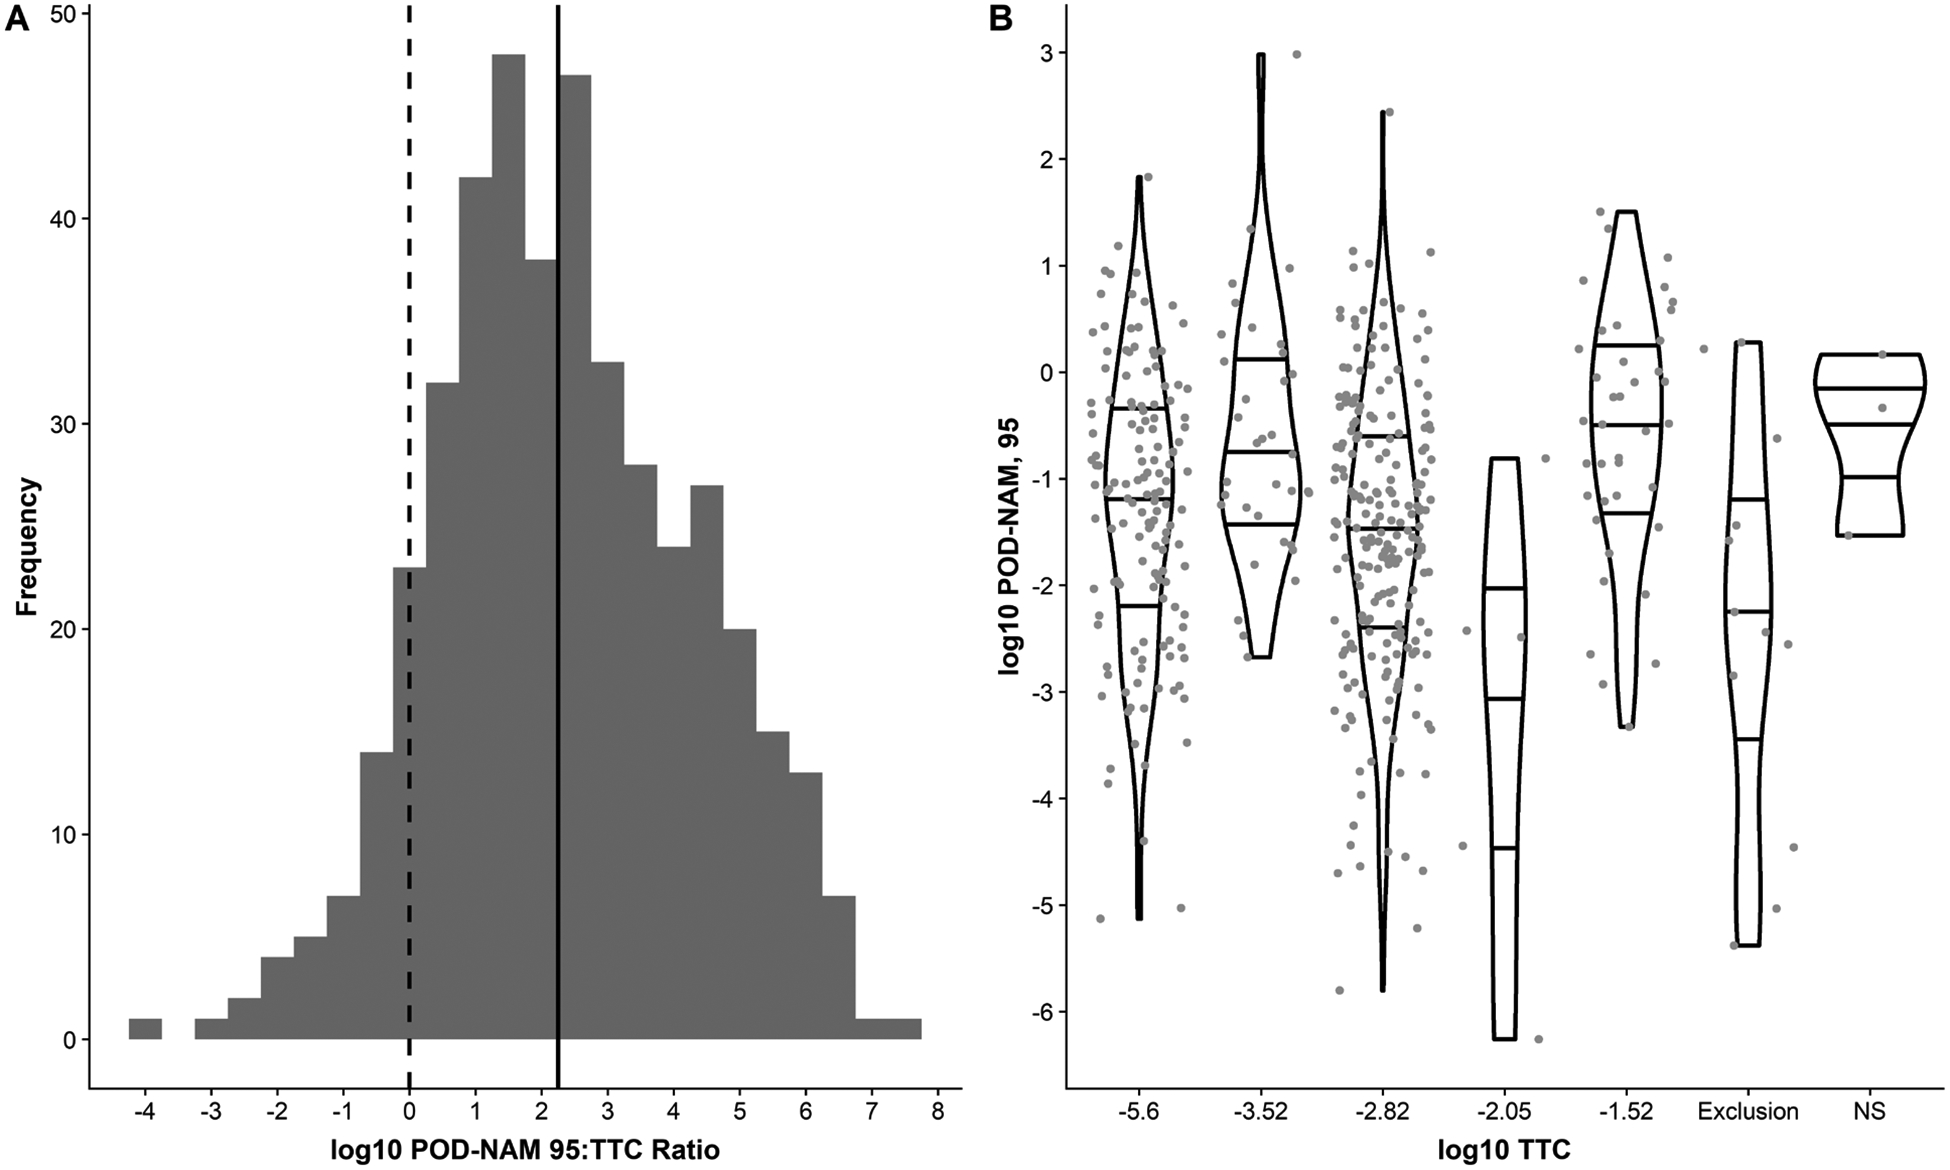
Use of high-throughput, in vitro bioactivity data in setting a point-of-departure (POD) has the potential to accelerate the pace of human health safety evaluation by informing screening-level assessments. The primary objective of this work was to compare PODs based on high-throughput predictions of bioactivity, exposure predictions, and traditional hazard information for 448 chemicals. PODs derived from new approach methodologies (NAMs) were obtained for this comparison using the 50th (PODNAM, 50) and the 95th (PODNAM, 95) percentile credible interval estimates for the steady-state plasma concentration used in in vitro to in vivo extrapolation of administered equivalent doses. Of the 448 substances, 89% had a PODNAM, 95 that was less than the traditional POD (PODtraditional) value. For the 48 substances for which PODtraditional < PODNAM, 95, the PODNAM and PODtraditional were typically within a factor of 10 of each other, and there was an enrichment of chemical structural features associated with organophosphate and carbamate insecticides. When PODtraditional < PODNAM, 95, it did not appear to result from an enrichment of PODtraditional based on a particular study type (eg, developmental, reproductive, and chronic studies). Bioactivity:exposure ratios, useful for identification of substances with potential priority, demonstrated that high-throughput exposure predictions were greater than the PODNAM, 95 for 11 substances. When compared with threshold of toxicological concern (TTC) values, the PODNAM, 95 was greater than the corresponding TTC value 90% of the time. This work demonstrates the feasibility, and continuing challenges, of using in vitro bioactivity as a protective estimate of POD in screening-level assessments via a case study.

Keywords: high-throughput screening; high-throughput toxicokinetics; new approach methodologies; point-of-departure (POD); threshold of toxicological concern (TTC).


Figures

Figure 1.
Figure 1.. Overall workflow of the case study.
This case study includes 448 substances with exposure predictions, in vitro assay data, HTTK information, and in vivo hazard information. The 50th and 95th percentile from the Monte Carlo simulation of inter-individual toxicokinetic variability were used to estimate AEDs, and the minimum of either the ToxCast or HIPPTox-based AEDs were selected as the PODNAM, 50 or PODNAM, 95. The PODNAM estimates were compared to the 5th percentile from the distribution of the PODtraditional values obtained from multiple sources to obtain the log10POD ratio. The log10BER was obtained by comparing the PODNAM estimates to exposure predictions. All values used for computation were in log10-mg/kg-bw/day units
Figure 2.
Figure 2.. Substance diversity.
Generic functional use categories from ACToR for the 448 case study substances are illustrated. One substance, represented as a row in the heatmap, may be associated with multiple use categories
Figure 3.
Figure 3.. Comparison of the Exposure, PODNAM, and PODtraditional.
Comparison of ExpoCast (gray circles), PODNAM (green circles), maximum AED (black triangles), and PODtraditional values (blue boxes) for 448 substances. The green line segment indicates the PODNAM,95 to PODNAM,50. Inset images A, B, and C correspond to the red boxes overlaid on the main plot. Image 3A provides a magnification on the substances with the largest log10POD ratio values. Image 3B displays a sample of substances that approach the median log10POD ratio. Image 3C includes all 48 substances for which the PODNAM, 95 > PODtraditional.
Figure 4:
Figure 4:. Illustration of the log10-bioactivity-exposure-ratio (BER).
A) The cumulative frequency distributions for BER estimates are plotted. The BER95 values used the 95th percentile from the credible interval to predict the median total US population exposure from ExpoCast, whereas the BER50 values used the median exposure estimate. BER95 and BER50 values were calculated as the “95th%-ile” and “50th%-ile,” using the PODNAM,95 and PODNAM,50, respectively. Orange line = BER95 using PODNAM,50; black line = BER95 using PODNAM,95; blue line = BER50 using PODNAM,50; gold line = BER50 using PODNAM,95. B) Eleven chemicals had a BER95, 95th%-ile < 0, indicating overlap between the PODNAM,95 and the 95th percentile exposure prediction. Dashed red lines indicate where BER95, 95th%-ile = 0.
Figure 5:
Figure 5:. Exposure and in vitro bioactivity that defined chemicals with log10BER < 0.
In (A), a scatterplot of log10 ExpoCast SEEM2 95th percentile value versus the PODNAM,95, with dotted red lines for the respective median values. The names of the 11 substances with log10BER95 < 0 are labeled. In (B) and (C), distributions of the exposure and the ToxCast AC50 data for all 448 substances are shown in the middle panels (gray histograms). Below these histograms in (B) and (C), side by side boxplots (showing the 1st quartile, median, and 3rd quartile) of the log10 ExpoCast SEEM2 95th percentile values and the ToxCast AC50 values are illustrated for the 11 substances with log10BER95 < 0. In (C), gold triangles indicate the 5th percentile of the AC50 distribution.
Figure 6:
Figure 6:. Comparison of Exposure Predictions from ExpoCast and Health Canada Evaluations.
The total maximum values (in log10-mg/kg/day units) curated from Health Canada exposure assessments for 18 substances in this case study were compared to the ExpoCast (A) median and (B) 95th percentile predictions (in log10-mg/kg/day units), respectively. CASRN for these substances are labeled. The gray line shows a linear relationship. All CASRN and substance identifiers, including substance name, can be found in Supplemental File 2.
Figure 7.
Figure 7.. Further understanding of the POD ratio distribution.
(A) The log10POD ratio is illustrated for the PODNAM,95 and the PODNAM, 50. The solid black line indicates where the log10-POD ratio95 is 0. Using the more conservative (i.e., lower) PODNAM,95, 48 of the 448 substances (10.7%) demonstrated a log10POD ratio < 0 (to the left of the dashed vertical line), whereas 92 of the 448 substances (20.5%) demonstrated a log10-POD ratio < 0 using the PODNAM,50. The medians of the log10-POD ratio distributions are indicated by dashed lines for PODNAM, 95 and PODNAM, 50 as 2 and 1.2, respectively. (B) Maximum AED (max AED) was less than the PODtraditional (5th-%ile POD) in 60% of the cases where the log10POD ratio95 > 0 (using PODNAM, 95). For the 48 chemicals with log10POD ratio95 < 0, the max AED was within the range of PODtraditional.
Figure 8.
Figure 8.. Study types enriched in the log10POD ratio95 < 0 set.
The matrices used to evaluate study type enrichment are shown. Neither developmental/reproductive (grouped together) (p = 0.88) nor chronic (p = 0.45) study types appeared to be enriched in the log10POD ratio95 < 0 subset.
Figure 9.
Figure 9.. PODNAM,95 compared to the TTC.
The log10TTC: PODNAM,95 ratio is illustrated for the 448 case study chemicals in (A). In (B), the log10 TTC value bin is compared to the log10PODNAM,95, in units of log10-mg/kg/day; dots represent all points and violin plots capture the shape of the distribution.

Comment in

References

    1. Aylward LL, and Hays SM (2011). Consideration of dosimetry in evaluation of ToxCast data. J Appl Toxicol 31(8), 741–51. - PubMed
    1. Becker RA, Friedman KP, Simon TW, Marty MS, Patlewicz G, and Rowlands JC (2015). An exposure:activity profiling method for interpreting high-throughput screening data for estrogenic activity--proof of concept. Regul Toxicol Pharmacol 71(3), 398–408. - PubMed
    1. Bell SM, Chang X, Wambaugh JF, Allen DG, Bartels M, Brouwer KLR, Casey WM, Choksi N, Ferguson SS, Fraczkiewicz G, et al. (2017). In vitro to in vivo extrapolation for high throughput prioritization and decision making. Toxicol In Vitro 47, 213–227. - PMC - PubMed
    1. Biryol D, Nicolas CI, Wambaugh J, Phillips K, and Isaacs K (2017). High-throughput dietary exposure predictions for chemical migrants from food contact substances for use in chemical prioritization. Environ Int 108, 185–194. - PMC - PubMed
    1. Brandon N, Dionisio KL, Isaacs K, Tornero-Velez R, Kapraun D, Setzer RW, and Price PS (2018). Simulating exposure-related behaviors using agent-based models embedded with needs-based artificial intelligence. J Expo Sci Environ Epidemiol doi: 10.1038/s41370-018-0052-y. - DOI - PMC - PubMed

Publication types

MeSH terms

Substances