

Nuclear receptor corepressor 1 represses cardiac hypertrophy
- PMID: 31532577
- PMCID: PMC6835202
- DOI: 10.15252/emmm.201809127
Nuclear receptor corepressor 1 represses cardiac hypertrophy
Abstract
The function of nuclear receptor corepressor 1 (NCoR1) in cardiomyocytes is unclear, and its physiological and pathological implications are unknown. Here, we found that cardiomyocyte-specific NCoR1 knockout (CMNKO) mice manifested cardiac hypertrophy at baseline and had more severe cardiac hypertrophy and dysfunction after pressure overload. Knockdown of NCoR1 exacerbated whereas overexpression mitigated phenylephrine-induced cardiomyocyte hypertrophy. Mechanistic studies revealed that myocyte enhancer factor 2a (MEF2a) and MEF2d mediated the effects of NCoR1 on cardiomyocyte hypertrophy. The receptor interaction domains (RIDs) of NCoR1 interacted with MEF2a to repress its transcriptional activity. Furthermore, NCoR1 formed a complex with MEF2a and class IIa histone deacetylases (HDACs) to suppress hypertrophy-related genes. Finally, overexpression of RIDs of NCoR1 in the heart attenuated cardiac hypertrophy and dysfunction induced by pressure overload. In conclusion, NCoR1 cooperates with MEF2 and HDACs to repress cardiac hypertrophy. Targeting NCoR1 and the MEF2/HDACs complex may be an attractive therapeutic strategy to tackle pathological cardiac hypertrophy.
Keywords: MEF2a; cardiac hypertrophy; class IIa HDACs; nuclear receptor corepressor 1.
© 2019 The Authors. Published under the terms of the CC BY 4.0 license.
Conflict of interest statement
The authors declare that they have no conflict of interest.
Figures
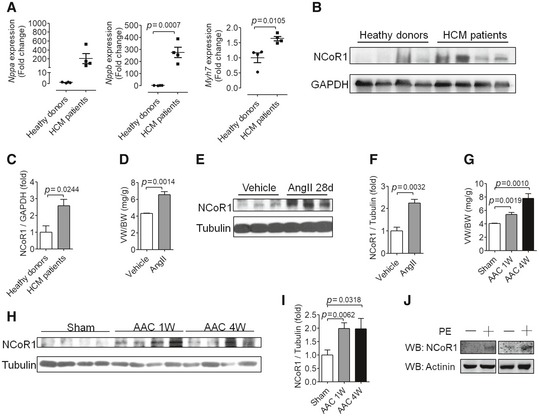
- A
Quantitative reverse transcriptase polymerase chain reaction (qRT–PCR) analysis of hypertrophy‐related genes in heart samples from healthy donors or hypertrophic cardiomyopathy (HCM) patients. n = 4:4. Nppa, natriuretic peptide type A; Nppb, natriuretic peptide type B; Myh7, myosin, heavy polypeptide 7, cardiac muscle, beta.
- B
Western blotting analysis of NCoR1 in heart samples from healthy donors or HCM patients.
- C
Quantification of (B). n = 4:4.
- D
Ventricular weight‐to‐body weight ratio (VW/BW) of C57BL/6 mice infused with vehicle (0.9% NaCl) or angiotensin II (AngII) for 4 weeks. n = 3:3.
- E
Western blotting analysis of NCoR1 in ventricular samples from mice shown in (D).
- F
Quantification of (E). n = 3:3.
- G
VW/BW of C57BL/6 mice subjected to sham operation or abdominal aortic constriction (AAC) for 1 or 4 weeks. n = 4:4:4.
- H
Western blotting analysis of NCoR1 in ventricular samples from mice shown in (G).
- I
Quantification of (H). n = 4:4:4.
- J
Western blotting analysis of NCoR1 in neonatal rat ventricular myocytes treated without or with phenylephrine (PE) for 24 h.
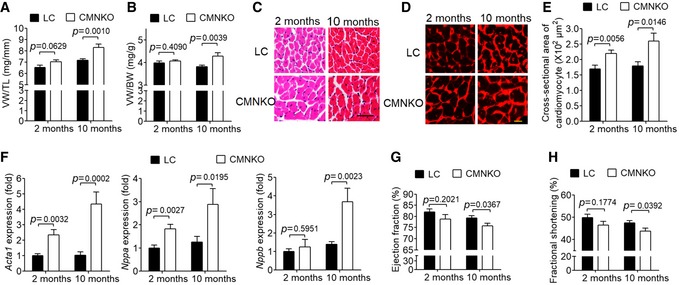
- A
Ventricular weight‐to‐tibia length ratio (VW/TL) of littermate control (LC) or cardiomyocyte‐specific NCoR1 knockout (CMNKO) mice. n = 10:9:12:7.
- B
Ventricular weight‐to‐body weight ratio (VW/BW) of LC or CMNKO mice. n = 10:8:12:7.
- C
Representative H&E staining of cross sections of left ventricles. Scale bar: 50 μm.
- D
Representative wheat germ agglutinin (WGA) staining of cross section of left ventricles. Scale bar: 10 μm.
- E
Quantification of cardiomyocyte size. n = 11:10:8:8.
- F
qRT–PCR analysis of hypertrophy‐related genes in left ventricles. n = 9:9:11:8.
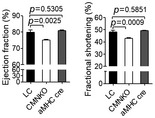
- G, H
(G) Ejection fraction and (H) fractional shortening measured by echocardiography. n = 9:7:14:10.
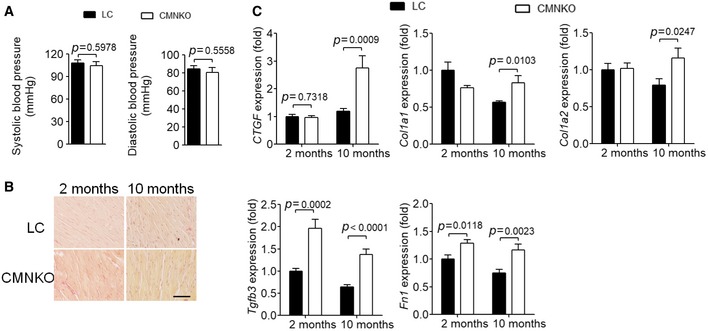
- A
Systolic blood pressure and diastolic blood pressure were monitored using non‐invasive tail‐cuff system in 2‐month‐old mice. n = 6:6.
- B
Picrosirius red staining of cross sections of left ventricles of LC or CMNKO mice. Scale bar: 50 μm.
- C
qRT–PCR analysis of fibrosis‐related genes in left ventricles of LC or CMNKO mice. n = 9:9:11:8. CTGF indicates connective tissue growth factor precursor; Fn1, fibronectin 1; TGFβ3, transforming growth factor β 3; Col1a1, collagen, type I, alpha 1; Col1a2, collagen, type I, alpha 2.
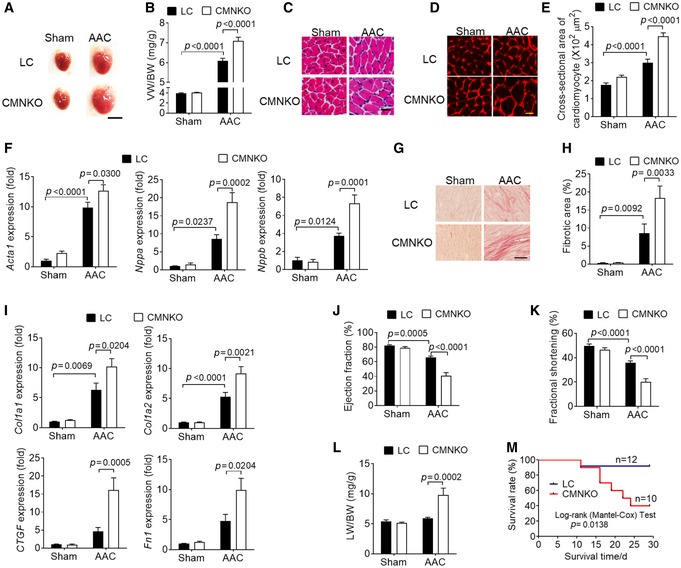
- A
Representative images of hearts from LC or CMNKO mice subjected to sham operation or AAC for 2 weeks. Scale bar: 0.5 cm.
- B
VW/BW of LC or CMNKO mice 2 weeks after sham operation or AAC. n = 9:9:16:15.
- C
Representative H&E staining of cross sections of left ventricles. Scale bar: 25 μm.
- D
Representative WGA staining. Scale bar: 10 μm.
- E
Quantification of cardiomyocyte size. n = 10:10:8:9.
- F
qRT–PCR analysis of hypertrophy‐related genes in left ventricles. n = 8:7:15:15.
- G
Representative picrosirius red staining of cross sections of left ventricles. Scale bar: 50 μm.
- H
Quantification of fibrotic areas. n = 11:10:10:9.
- I
qRT–PCR analysis of fibrosis‐related genes in left ventricles. n = 8:7:15:15.
- J, K
(J) Ejection fraction and (K) fractional shortening measured by echocardiography. n = 9:7:14:12.
- L
Lung weight‐to‐body weight ratio (LW/BW) of LC or CMNKO mice 2 weeks after sham operation or AAC. n = 8:7:16:15.
- M
Cumulative survival rate of LC or CMNKO mice subjected to AAC. n = 12:10.
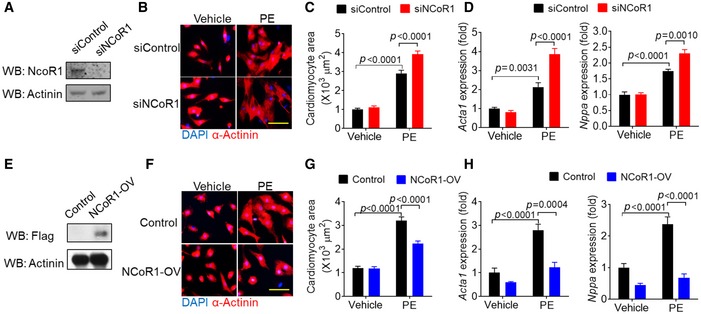
- A
Western blotting analysis of NCoR1 in neonatal rat ventricular myocytes (NRVMs) transfected with siControl or siNCoR1 for 3 days. siControl indicates control siRNA; siNCoR1, NCoR1 siRNA.
- B
Representative immunofluorescence staining of α‐Actinin in NRVMs transfected with siRNA for 48 h and then treated with vehicle (H2O) or phenylephrine (PE) for another 48 h. Scale bar: 50 μm.
- C
Quantification of the surface area of α‐Actinin‐positive NRVMs with or without NCoR1 knockdown. A total of 40 NRVMs were randomly chosen from four replicate coverslips for each group and used for statistical analysis.
- D
qRT–PCR analysis of Acta1 and Nppa in NRVMs with or without NCoR1 knockdown. n = 4:4.
- E
Western blotting analysis of NCoR1‐flag in NRVMs infected by control lentivirus (Control) or NCoR1‐flag lentivirus (NCoR1‐OV) for 4 days.
- F
Representative immunofluorescence staining of α‐Actinin in NRVMs infected with lentivirus for 48 h and then treated with vehicle or PE for another 48 h. Scale bar: 50 μm.
- G
Quantification of the surface area of α‐Actinin‐positive NRVMs with or without NCoR1 overexpression. A total of 30 NRVMs were randomly chosen from three replicate coverslips for each group and used for statistical analysis.
- H
qRT–PCR analysis of Acta1 and Nppa in NRVMs with or without NCoR1 overexpression. n = 4:3.
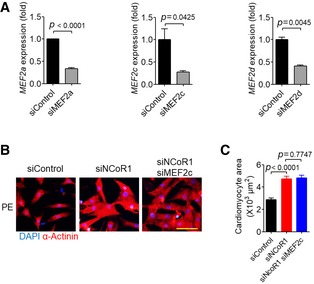
- A
Knockdown efficiency of MEF2a, MEF2c, and MEF2d in NRVMs. siControl indicates control siRNA; siMEF2a indicates MEF2a siRNA; siMEF2c, MEF2c siRNA; siMEF2d, MEF2d siRNA. n = 3.
- B
Representative immunofluorescence staining of α‐Actinin in NRVMs transfected with siRNA for 48 h and then treated with PE for another 48 h. Scale bar: 50 μm.
- C
Quantification of the surface area of α‐Actinin‐positive NRVMs with or without knockdown of NCoR1 and/or MEF2c. A total of 30 NRVMs were randomly chosen from three replicate coverslips for each group and used for statistical analysis.
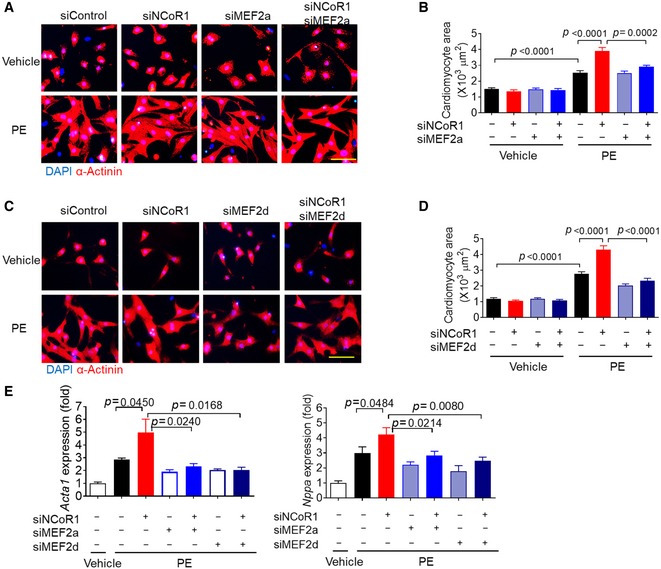
- A
Representative immunofluorescence staining of α‐Actinin in NRVMs transfected with siRNA for 48 h and then treated with vehicle (H2O) or PE for another 48 h. Scale bar: 50 μm. siMEF2a indicates MEF2a siRNA.
- B
Quantification of the surface area of α‐Actinin‐positive NRVMs with or without knockdown of NCoR1 and/or MEF2a. A total of 15–20 NRVMs were randomly chosen from three replicate coverslips for each group and used for statistical analysis.
- C
Representative immunofluorescence staining of α‐Actinin in NRVMs transfected with siRNA for 48 h and then treated with vehicle or PE for another 48 h. Scale bar: 50 μm. siMEF2d indicates MEF2d siRNA.
- D
Quantification of the surface area of α‐Actinin‐positive NRVMs with or without knockdown of NCoR1 and/or MEF2d. A total of 15–19 NRVMs were randomly chosen from three replicate coverslips for each group and used for statistical analysis.
- E
qRT–PCR analysis of Acta1 and Nppa in NRVMs. n = 4.
- A
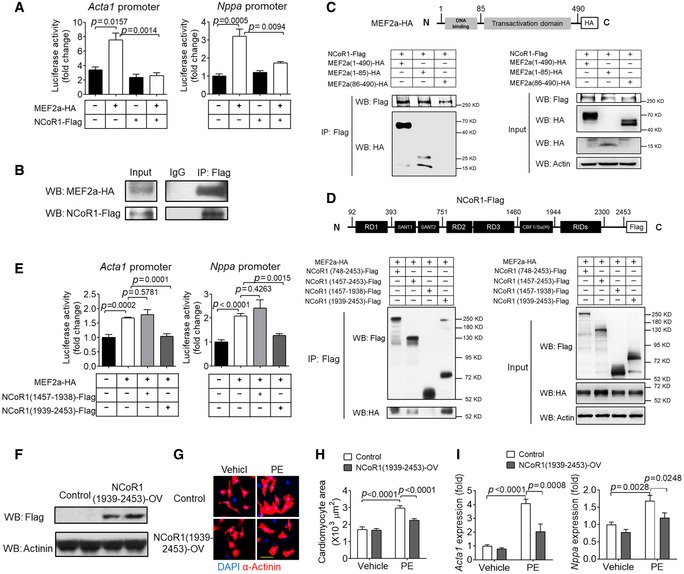
Luciferase assays of Acta1 and Nppa promoters in HEK293FT cells transfected with NCoR1‐Flag and/or MEF2a‐HA or with empty plasmids. n = 3.
- B
Co‐immunoprecipitation (Co‐IP) analysis of NCoR1 and MEF2a in HEK293FT cells transfected with full‐length NCoR1‐Flag and MEF2a‐HA.
- C
Co‐IP analysis of NCoR1 and truncated MEF2a in HEK293FT cells. Schematic illustration of MEF2a‐HA construct is shown above the Co‐IP results.
- D
Co‐IP analysis of MEF2a and truncated NCoR1 in HEK293FT cells. Schematic illustration of NCoR1‐Flag construct is shown above the Co‐IP results.
- E
Luciferase assays of Acta1 and Nppa promoters in HEK293FT cells transfected with full‐length MEF2a and domain‐specific NCoR1. n = 3.
- F
Western blotting analysis of NCoR1‐flag in NRVMs infected by control lentivirus (Control) or NCoR1 (1939‐2453)‐flag lentivirus [NCoR1(1939‐2453)‐OV] for 4 days.
- G
Representative immunofluorescence staining of α‐Actinin in NRVMs infected with lentivirus for 48 h and then treated with vehicle (DMSO) or PE for another 48 h. Scale bar: 50 μm.
- H
Quantification of the surface area of α‐Actinin‐positive NRVMs. A total of 30 NRVMs were randomly chosen from three replicate coverslips for each group and used for statistical analysis.
- I
qRT–PCR analysis of Acta1 and Nppa in NRVMs. n = 4.
- A
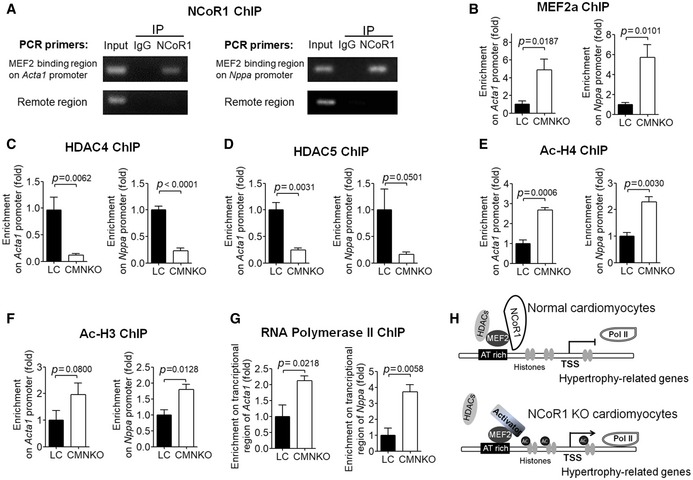
ChIP analysis showing enrichment of NCoR1 in MEF2‐binding regions on the promoters of Acta1 and Nppa in ventricular samples.
- B
ChIP analysis of enrichment of MEF2a on promoters of Acta1 and Nppa in ventricular samples. n = 3:3.
- C–F
ChIP analysis of enrichment of HDAC4 (C), HDAC5 (D), acetylated‐Histone 4 (ac‐H4) (E), and ac‐H3 (F) on promoters of Acta1 and Nppa in ventricular samples. n = 4:4 for (C), n = 3:3 for (D, E, F).
- G
ChIP analysis of RNA polymerase II enrichment on the transcriptional regions of Acta1 and Nppa in ventricular samples. n = 3:3.
- H
Working model of NCoR1 function in cardiomyocytes. TSS indicates transcription start site.
- A
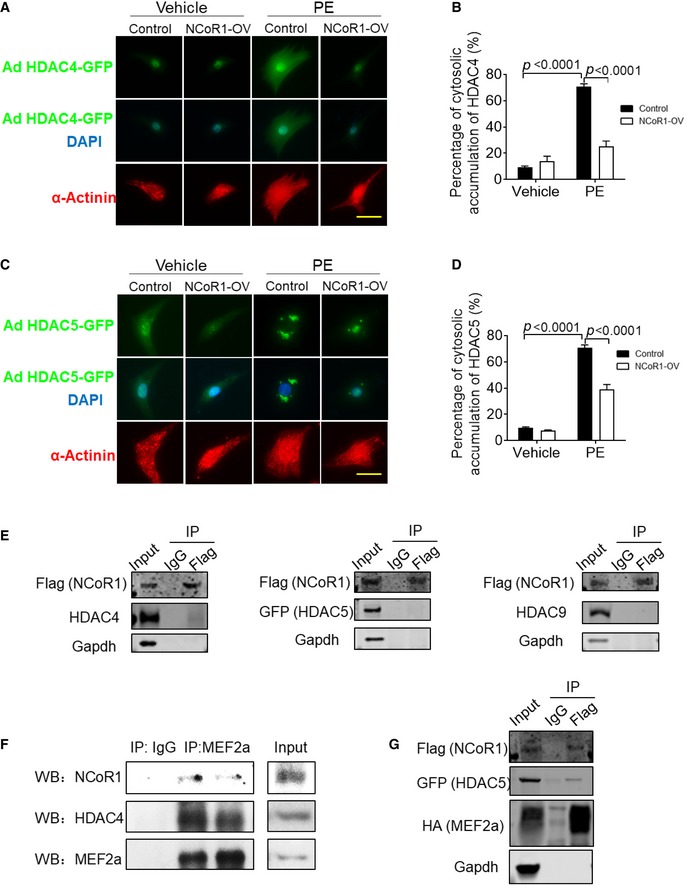
Representative immunofluorescence staining of HDAC4‐GFP in NRVMs. Cells were infected by HDAC4‐GFP adenovirus and then control lentivirus (Control) or NCoR1‐flag lentivirus (NCoR1‐OV), and subsequently treated with vehicle (H2O) or PE. Scale bar: 20 μm.
- B
Quantification of cytosolic accumulation of HDAC4‐GFP. n = 5.
- C
Representative immunofluorescence staining of HDAC5‐GFP in NRVMs. Cells were infected by HDAC5‐GFP adenovirus and then control lentivirus (Control) or NCoR1‐flag lentivirus (NCoR1‐OV), and subsequently treated with vehicle or PE. Scale bar: 20 μm.
- D
Quantification of cytosolic accumulation of HDAC5‐GFP. n = 5.
- E
Co‐IP analysis detecting interactions between NCoR1 and HDAC4, HDAC5 or HDAC9 in NRVMs. Cells were infected with NCoR1‐flag lentivirus and then HDAC4 adenovirus, HDAC5‐GFP adenovirus, or HDAC9 adenovirus.
- F
Co‐IP analysis showing interactions between NCoR1, MEF2a, and HDAC4 in ventricular samples.
- G
Co‐IP analysis detecting interactions between NCoR1, MEF2a, and HDAC5 in NRVMs. Cells were infected with NCoR1‐flag lentivirus and then MEF2a‐HA lentivirus and HDAC5‐GFP adenovirus.
- A
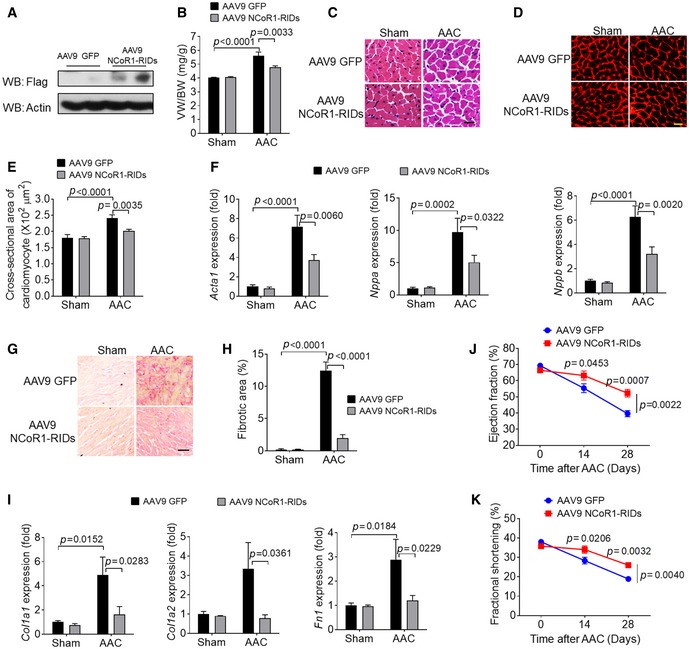
Western blotting analysis of RIDs of NCoR1 in left ventricular samples from mice infected with AAV9 GFP or AAV9 NCoR1‐RIDs (1939‐2453)‐Flag.
- B
VW/BW of mice 2 weeks after sham operation or AAC. n = 7:7:12:12.
- C
Representative H&E staining of cross sections of left ventricles. Scale bar: 10 μm.
- D
Representative WGA staining. Scale bar: 10 μm.
- E
Quantification of cardiomyocyte size. n = 6:6:7:8.
- F
qRT–PCR analysis of hypertrophy‐related genes in left ventricles. n = 8:8:11:11.
- G
Representative picrosirius red staining of cross sections of left ventricles. Scale bar: 20 μm.
- H
Quantification of fibrotic areas. n = 5:5:7:7.
- I
qRT–PCR analysis of fibrosis‐related genes in left ventricles. n = 8:8:11:11.
- J, K
(J) Ejection fraction and (K) fractional shortening measured before, 2 and 4 weeks after AAC. n = 6:6.
Comment in
-
Targeting TGFβR2-mutant tumors exposes vulnerabilities to stromal TGFβ blockade in pancreatic cancer.EMBO Mol Med. 2019 Nov 7;11(11):e10515. doi: 10.15252/emmm.201910515. Epub 2019 Oct 14. EMBO Mol Med. 2019. PMID: 31609088 Free PMC article.
-
Targeting cardiac hypertrophy through a nuclear co-repressor.EMBO Mol Med. 2019 Nov 7;11(11):e11297. doi: 10.15252/emmm.201911297. Epub 2019 Oct 17. EMBO Mol Med. 2019. PMID: 31622030 Free PMC article.
References
-
- Bligh EG, Dyer WJ (1959) A rapid method of total lipid extraction and purification. Can J Biochem Physiol 37: 911–917 - PubMed
-
- Buitrago M, Lorenz K, Maass AH, Oberdorf‐Maass S, Keller U, Schmitteckert EM, Ivashchenko Y, Lohse MJ, Engelhardt S (2005) The transcriptional repressor Nab1 is a specific regulator of pathological cardiac hypertrophy. Nat Med 11: 837–844 - PubMed
Publication types
MeSH terms
Substances
Associated data
- Actions
Grants and funding
- 31671181/National Natural Science Foundation of China (NSFC)/International
- 91739303/National Natural Science Foundation of China (NSFC)/International
- 81725003/National Natural Science Foundation of China (NSFC)/International
- École Polytechnique Fédérale de Lausanne (EPFL)/International
- 31003A-140780/SNSF_/Swiss National Science Foundation/Switzerland
LinkOut - more resources
Full Text Sources
Other Literature Sources
Molecular Biology Databases
Research Materials
