. 2019 Oct 15;30(22):2750-2760.
doi: 10.1091/mbc.E19-03-0146. Epub 2019 Sep 18.

Weak membrane interactions allow Rheb to activate mTORC1 signaling without major lysosome enrichment

Affiliations

Weak membrane interactions allow Rheb to activate mTORC1 signaling without major lysosome enrichment

Brittany Angarola et al. Mol Biol Cell. .

Abstract

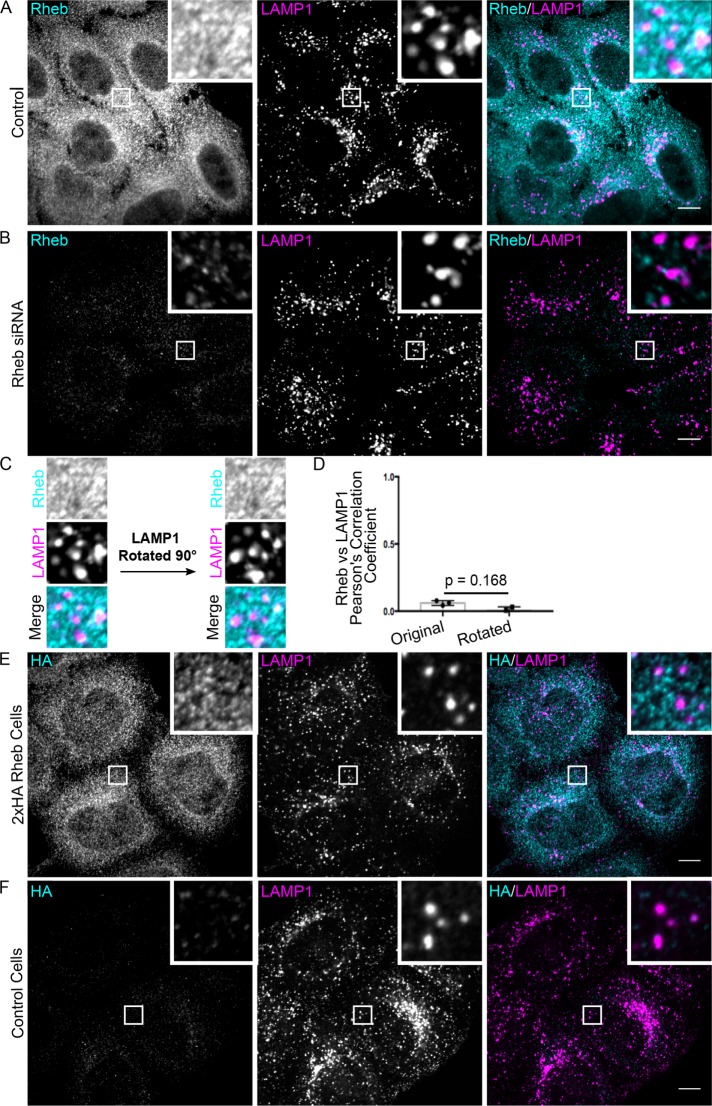
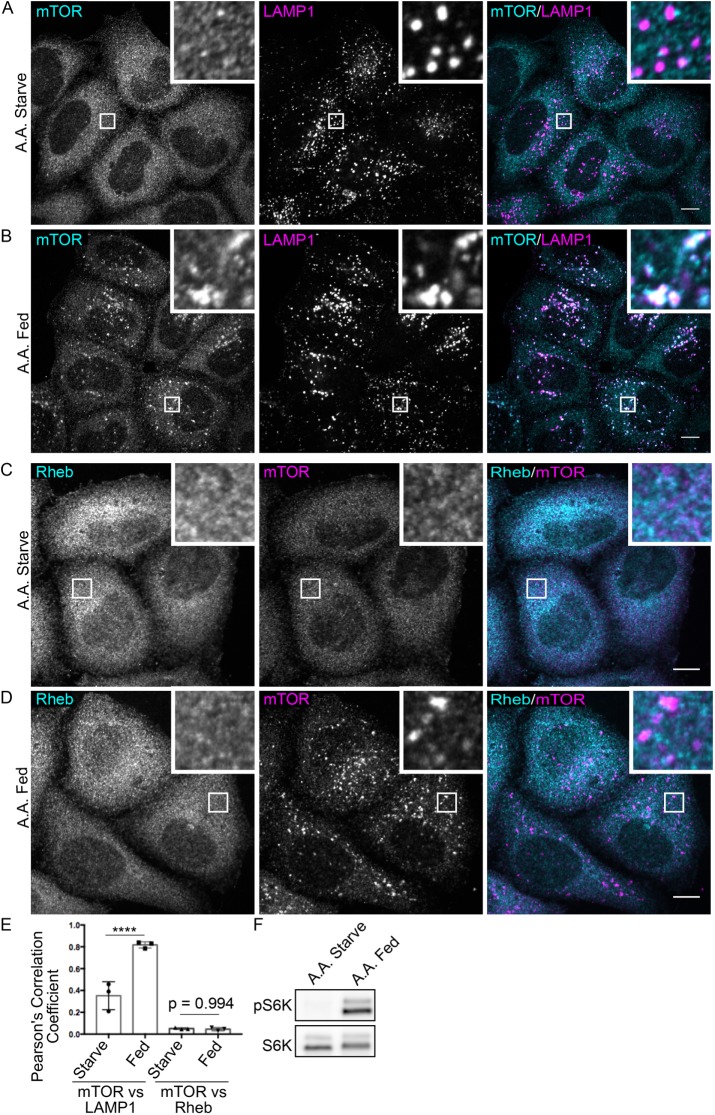
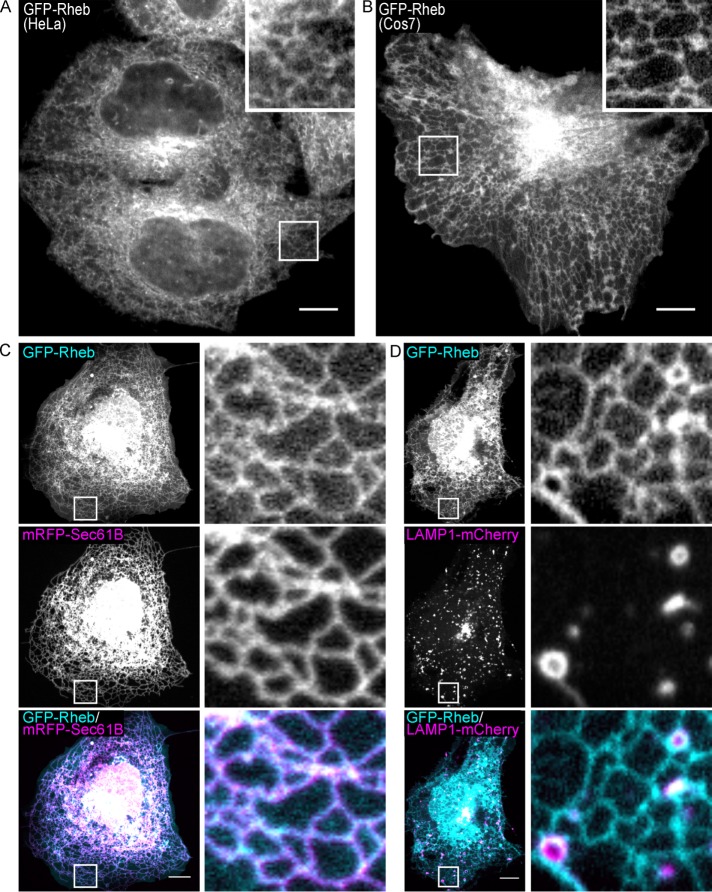
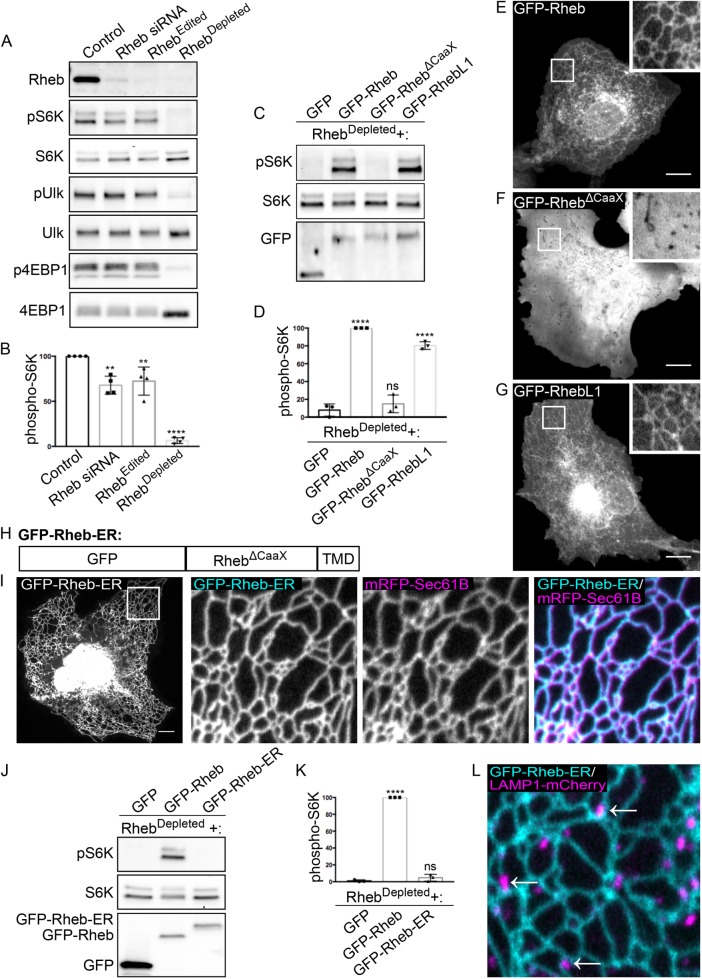
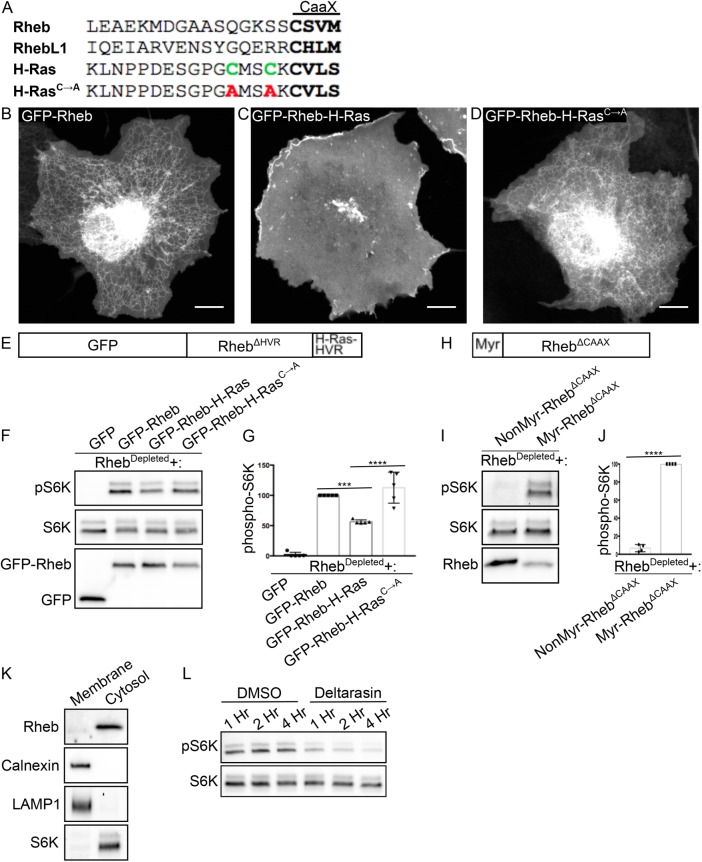
Stable localization of the Rheb GTPase to lysosomes is thought to be required for activation of mTOR complex 1 (mTORC1) signaling. However, the lysosome targeting mechanisms for Rheb remain unclear. We therefore investigated the relationship between Rheb subcellular localization and mTORC1 activation. Surprisingly, we found that Rheb was undetectable at lysosomes. Nonetheless, functional assays in knockout human cells revealed that farnesylation of the C-terminal CaaX motif on Rheb was essential for Rheb-dependent mTORC1 activation. Although farnesylated Rheb exhibited partial endoplasmic reticulum (ER) localization, constitutively targeting Rheb to ER membranes did not support mTORC1 activation. Further systematic analysis of Rheb lipidation revealed that weak, nonselective, membrane interactions support Rheb-dependent mTORC1 activation without the need for a specific lysosome targeting motif. Collectively, these results argue against stable interactions of Rheb with lysosomes and instead that transient membrane interactions optimally allow Rheb to activate mTORC1 signaling.


Figures

FIGURE 1:
FIGURE 1:
Rheb is not enriched on lysosomes. (A, B) Rheb and LAMP1 (late endosomes/lysosomes) immunofluorescence in HeLa cells that were transfected with control and Rheb siRNA, respectively. (C) Comparison of Rheb and LAMP1 colocalization in the insets from A before and after rotating the LAMP1 image by 90° to estimate the extent to which colocalization occurs by chance. (D) Quantification of the Pearson’s R value when comparing Rheb vs. LAMP1 in the original and rotated configurations as described in C (n = 3 biological replicates, 15 images quantified per replicate, t test). (E, F) Representative immunofluorescence images of anti-HA and anti-LAMP1 staining in genome edited 2xHA-Rheb HeLa cells and control HeLa cells, respectively. Scale bars, 10 μm.
FIGURE 2:
FIGURE 2:
Regulated recruitment of mTOR to lysosomes is not accompanied by significant colocali­zation with Rheb. (A, B) Immunofluorescence analysis of mTOR and LAMP1 localization in starved and amino acid refed cells, respectively. (C, D) Immunofluorescence analysis of mTOR and Rheb localization in starved and amino acid refed cells, respectively. (E) Quantification of the colocali­zation observed in experiments related to A–D (n = 3 biological replicates, 15 images quantified per repli­cate, one-way analysis of variance (ANOVA) with a Sidak’s multiple comparisons test). (F) Immuno­blot analysis of phospho-S6K and S6K levels in starved and amino acid refed cells. Scale bars, 10 μm.
FIGURE 3:
FIGURE 3:
GFP-Rheb localizes to the ER and cytosol. (A, B) Spinning disk confocal live-cell imaging of GFP-Rheb in HeLa cells and COS-7 cells, respectively. (C) GFP-Rheb and mRFP-Sec61B (ER marker) localization in COS-7 cells. (D) GFP-Rheb and LAMP1-mCherry (late endosomes and lysosomes) localization in COS-7 cells. Scale bars, 10 μm.
FIGURE 4:
FIGURE 4:
Development of RhebDepleted cells as a tool for testing relationships between Rheb localization and function. (A) Immunoblot analysis of Rheb levels and phosphorylation status of mTORC1 substrates (S6K, ULK1, and 4EBP1) in Control, Rheb siRNA-treated, RhebEdited (Rheb hypomorph+RhebL1 KO), and RhebDepleted (Rheb hypomorph+RhebL1 KO+Rheb siRNA) HeLa cells. (B) Quantification of phospho-S6K levels under the indicated conditions where phospho-S6K levels were divided by S6K and normalized to Control (**P < 0.01; ****P < 0.0001; ANOVA with Dunnett’s multiple comparisons test, n = 4). (C) Immunoblot analysis of phospho-S6K levels in RhebDepleted cells transfected with the indicated plasmids. (D) Quantification of phospho-S6K levels from C. The phospho-S6K levels were divided by S6K and GFP values to control for loading and transfection efficiency. Values were normalized to GFP-Rheb. Statistics were calculated in comparison to the GFP transfection (****P < 0.0001; ANOVA with Dunnett’s multiple comparisons test; n = 3). (E–G) Live-cell images of GFP-Rheb, GFP-RhebΔCaaX, and GFP-RhebL1 in a COS-7 cells, respectively. (H) Schematic of GFP-Rheb-ER chimera that contains N-terminal GFP, RhebΔCaaX, and the transmembrane domain of cytochrome b5 (TMD). (I) Live-cell imaging of GFP-Rheb-ER localization. The leftmost image displays a low magnification view of GFP-Rheb-ER in a COS-7 cell. The three subsequent panels show higher magnifications of GFP-Rheb-ER and mRFP-Sec61B from the inset region. (J) Immunoblot analysis of phospho-S6K signaling in RhebDepleted cells transfected with the indicated plasmids. (K) Quantification of phospho-S6K levels in I. The phospho-S6K levels were divided by S6K and GFP values to control for loading and transfection. Values were normalized to GFP-Rheb. Statistics were calculated in comparison to GFP (****P < 0.0001; ANOVA with Dunnett’s multiple comparisons test; n = 3). (L) Image showing the spatial relationship between GFP-Rheb-ER on ER tubules and LAMP1-positive lysosomes. Scale bars, 10 μm.
FIGURE 5:
FIGURE 5:
Weak membrane interactions are optimal for Rheb-dependent mTORC1 activation. (A) Alignment of the hypervariable regions of Rheb, RhebL1, and H-Ras proteins with CaaX motifs highlighted in bold and palmitoylated cysteines in green. These cysteines were mutated to alanines (red) in the GFP-Rheb-HRasC→A mutant. (B–D) Live-cell images of GFP-Rheb, GFP-Rheb-HRas, and GFP-Rheb-HRasC→A in COS-7 cells, respectively. Scale bars, 10 µm. (E) Schematic of GFP-Rheb-H-Ras chimera that contains N-terminal GFP, RhebΔHVR, and the HVR of H-Ras. (F) Immunoblot analysis of phospho-S6K levels in RhebDepleted cells transfected with the indicated plasmids. (G) Quantification of phospho-S6K levels from F. Phospho-S6K levels were divided by S6K and GFP values to control for loading and transfection (***P < 0.001; ****P < 0.0001; ANOVA with Tukey’s multiple comparisons test; n = 5). (H) Schematic of myr-Rheb chimera that contains RhebΔCaaX and a myristoylation consensus sequence. (I) Immunoblot analysis of phospho-S6K levels in RhebDepleted cells transfected with the indicated plasmids. (J) Quantification of phospho-S6K levels from I. Phospho-S6K levels were divided by S6K and Rheb values to control for loading and transfection (****P < 0.0001; unpaired t test). (K) Immunoblot analysis of proteins identified in membrane and cytosolic fractions of HeLa cells. (L) Immunoblot analysis of phospho-S6K levels in HeLa cells treated with DMSO vehicle and 5 μM deltarasin for the times indicated.

References

    1. Amick J, Roczniak-Ferguson A, Ferguson SM. (2016). C9orf72 binds SMCR8, localizes to lysosomes, and regulates mTORC1 signaling. Mol Biol Cell , 3040–3051. - PMC - PubMed
    1. Amick J, Tharkeshwar AK, Amaya C, Ferguson SM. (2018). WDR41 supports lysosomal response to changes in amino acid availability. Mol Biol Cell , 2213–2227. - PMC - PubMed
    1. Bar-Peled L, Chantranupong L, Cherniack AD, Chen WW, Ottina KA, Grabiner BC, Spear ED, Carter SL, Meyerson M, Sabatini DM. (2013). A tumor suppressor complex with GAP activity for the Rag GTPases that signal amino acid sufficiency to mTORC1. Science , 1100–1106. - PMC - PubMed
    1. Bar-Peled L, Schweitzer LD, Zoncu R, Sabatini DM. (2012). Ragulator is a GEF for the rag GTPases that signal amino acid levels to mTORC1. Cell , 1196–1208. - PMC - PubMed
    1. Ben-Sahra I, Manning BD. (2017). mTORC1 signaling and the metabolic control of cell growth. Curr Opin Cell Biol , 72–82. - PMC - PubMed

Publication types

MeSH terms

Substances