. 2019 Sep 17;28(12):3077-3091.e5.
doi: 10.1016/j.celrep.2019.08.050.

TCR and Inflammatory Signals Tune Human MAIT Cells to Exert Specific Tissue Repair and Effector Functions

Affiliations

TCR and Inflammatory Signals Tune Human MAIT Cells to Exert Specific Tissue Repair and Effector Functions

Tianqi Leng et al. Cell Rep. .

Abstract

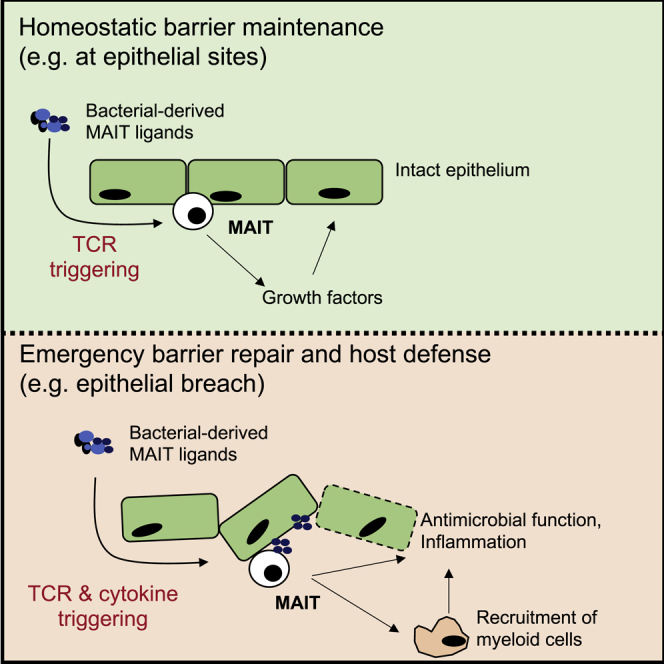
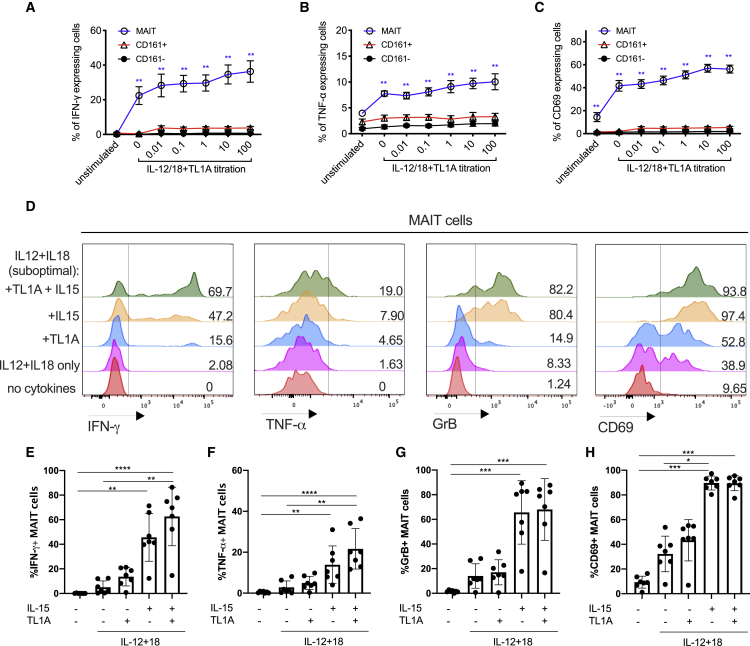
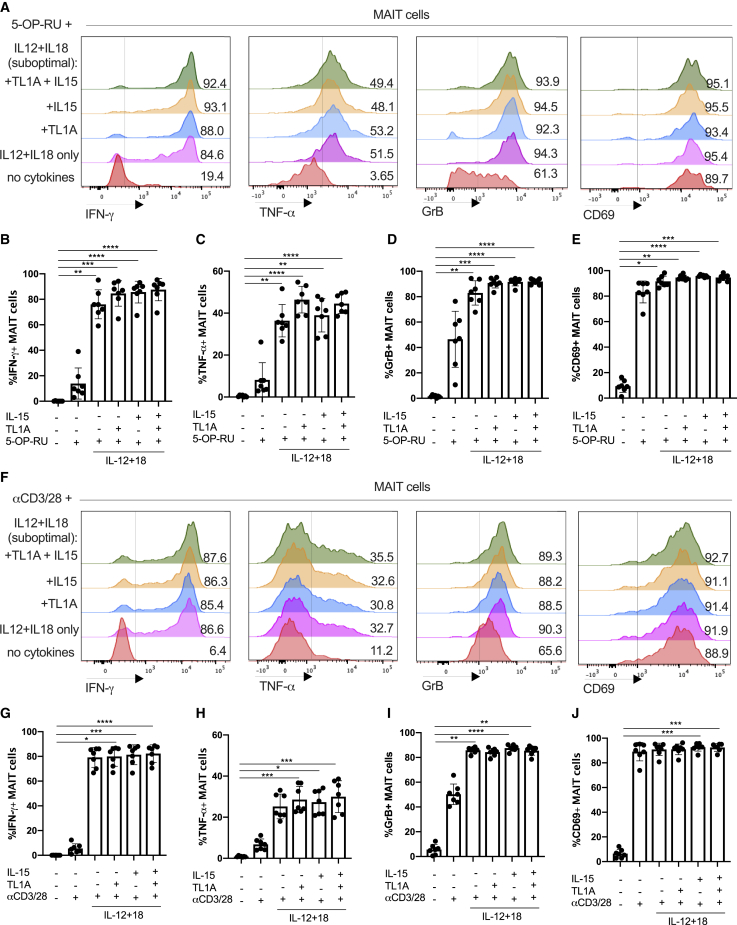
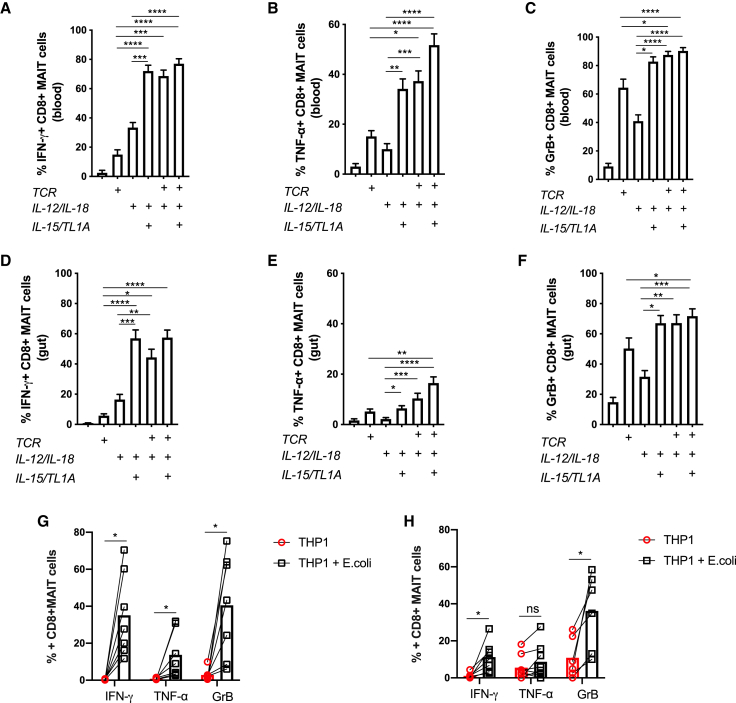
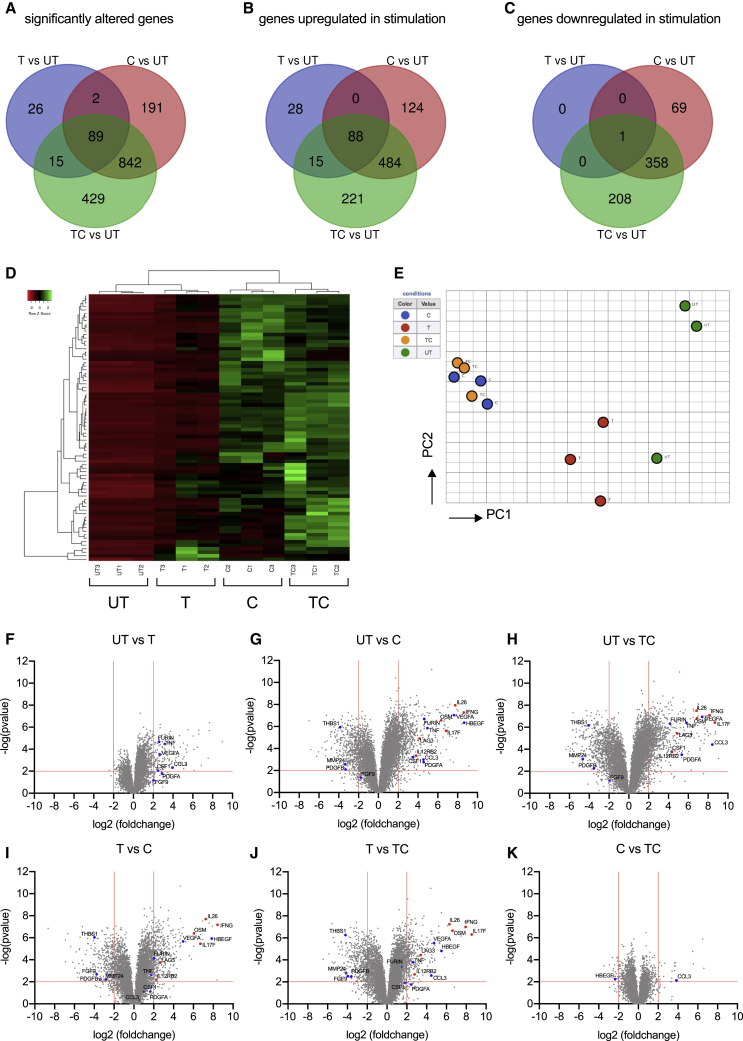
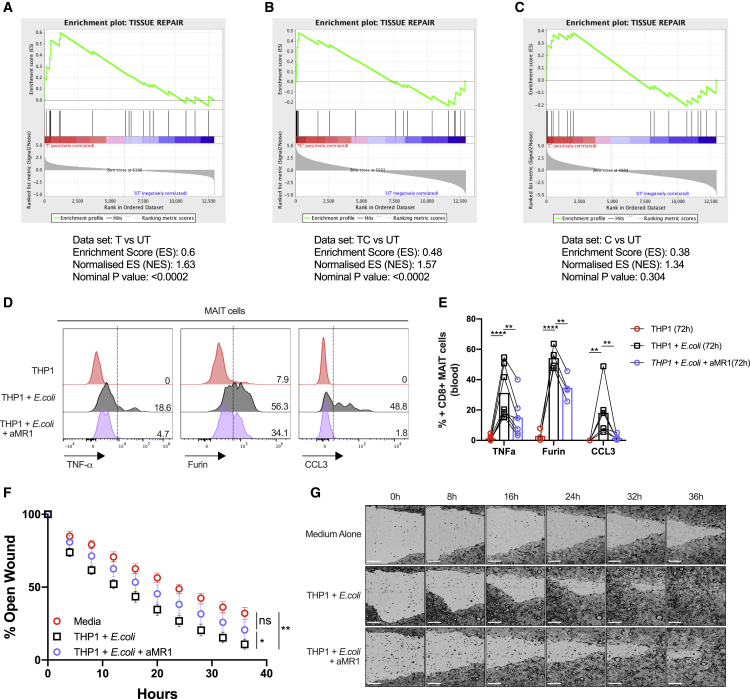
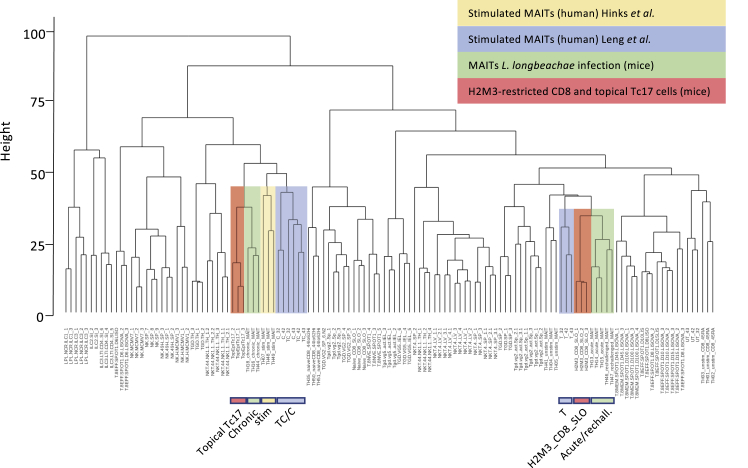
MAIT cells are an unconventional T cell population that can be activated through both TCR-dependent and TCR-independent mechanisms. Here, we examined the impact of combinations of TCR-dependent and TCR-independent signals in human CD8+ MAIT cells. TCR-independent activation of these MAIT cells from blood and gut was maximized by extending the panel of cytokines to include TNF-superfamily member TL1A. RNA-seq experiments revealed that TCR-dependent and TCR-independent signals drive MAIT cells to exert overlapping and specific effector functions, affecting both host defense and tissue homeostasis. Although TCR triggering alone is insufficient to drive sustained activation, TCR-triggered MAIT cells showed specific enrichment of tissue-repair functions at the gene and protein levels and in in vitro assays. Altogether, these data indicate the blend of TCR-dependent and TCR-independent signaling to CD8+ MAIT cells may play a role in controlling the balance between healthy and pathological processes of tissue inflammation and repair.

Keywords: MAIT cells; TCR signaling; cytokines; effector functions; tissue repair.


Conflict of interest statement

The authors declare no competing interests.

Figures

None
Graphical abstract
Figure 1
Figure 1
TL1A Enhances the Activation of MAIT Cells Suboptimally Stimulated with IL-12 and IL-18 CD8+ T cells were enriched from healthy peripheral blood mononuclear cells (PBMCs) and stimulated overnight with different combinations of cytokines: IL-12 at 2 ng/mL, IL-18 at 50 ng/mL, IL-15 at 25 ng/mL, and TL1A from 0.01 to 100 ng/mL as indicated. (A–C) Proportions of CD8+ MAIT/CD161+ or CD161 cells producing IFN-γ (A), TNF-α (B), or CD69 (C) following overnight stimulation with suboptimal concentrations of IL-12 and IL-18, plus varying concentrations of TL1A. (D) Representative histograms showing the expression of IFN-γ, TNF-α, GrB, and CD69 by MAIT cells after stimulation with different combinations of cytokines. (E–H) Frequency of MAIT cells expressing IFN-γ (E), TNF-α (F), GrB (G), and CD69 (H) upon stimulation with the indicated cytokines. Data were acquired from seven donors in 2–3 experiments. Error bars represent means ± SEM. Differences among conditions were analyzed by Friedman tests with Dunn’s multiple comparison tests. p < 0.05, ∗∗p < 0.01, ∗∗∗p < 0.001, ∗∗∗∗p < 0.0001. See also Figure S1.
Figure 2
Figure 2
TCR and Cytokine Signaling Combine to Promote MAIT Cell Effector Functions (A–J) Magnetic-activated cell sorting (MACS)-enriched CD8 T cells from the blood were cultured overnight in the presence of the indicated cytokines, together with the THP1 cell pulsed with DMSO or the MAIT-antigen 5-OP-RU (A–E) or with αCD3/CD28 beads (F–J). (A) Representative histograms showing the expression of IFN-γ, TNF-α, GrB, and CD69 by MAIT cells after stimulation with different cytokines in the presence of 5-OP-RU. (B–E) Frequency of MAIT cells expressing IFN-γ (B), TNF-α (C), GrB (D), or CD69 (E) upon stimulation with the indicated cytokines. (F) Representative histograms showing the expression of IFN-γ, TNF-α, GrB, and CD69 by MAIT cells after stimulation with different cytokines in the presence of 5-OP-RU. (G–J) Frequency of MAIT cells expressing IFN-γ (G), TNF-α (H), GrB (I), or CD69 (J) upon stimulation with the indicated cytokines. Data were acquired from seven donors in two experiments. Error bars represent means ± SEM. Differences among conditions were analyzed by Friedman tests with Dunn’s multiple comparison tests. p < 0.05, ∗∗p < 0.01, ∗∗∗p < 0.001, ∗∗∗∗p < 0.001. See also Figure S2.
Figure 3
Figure 3
Gut-Derived MAIT Cells Show a Broadly Similar Response Pattern toward Innate and Adaptive Stimuli Compared with Their Blood-Derived Counterparts Representative plots showing the percentage of cells positive for the indicated effector molecules as a proportion of CD8+ MAIT cells. (A–C) Proportions of blood-derived (n = 32) CD8+ MAIT cells producing IFN-γ (A), TNF-α (B), or GrB (C) following overnight stimulation with combinations of suboptimal concentrations of IL-12 and IL-18, TL1A, and αCD3/CD28 beads as indicated. (D–F) Proportions of gut-derived (n = 13) CD8+ MAIT cells producing IFN-γ (D), TNF-α (E), or GrB (F) stimulated in the same way as in (A)–(C). (G and H) Expression of IFN-γ, TNF-α, and GrB by blood-derived (G, n = 7) or gut-derived (H, n = 6) CD8+ MAIT cells 20 h after coculture with THP1 cells alone or THP1 cells incubated with 25 fixed E. coli bacteria per cell. Data were acquired from multiple donors as indicated in 3–5 experiments. Error bars represent means ± SEM. Differences among conditions were analyzed by Friedman tests with Dunn’s multiple comparison tests (A–F), two-way ANOVA (G), or Wilcoxon tests (H). p < 0.05, ∗∗p < 0.01, ∗∗∗p < 0.001, ∗∗∗∗p < 0.001. See also Figure S3.
Figure 4
Figure 4
TCR- and Cytokine-Activated MAIT Cells Possess Distinct Transcriptional Profiles (A–C) Venn diagrams showing genes that are significantly differentially modulated (p < 0.05, fold change > 4) in TCR (T)-, cytokine (C)-, or TCR and cytokine (TC)-treated CD8+ MAIT cells compared with untreated (UT) MAIT cells of three healthy individuals. The cytokine (C) stimulation consisted of a cocktail of 4 cytokines: IL-12 (2 ng/mL), IL-18 (50 ng/mL), IL-15 (25 ng/mL), and TL1A (100 ng/mL). Genes with significantly altered expression levels (A) are divided into two sets: those are that are upregulated upon stimulation (B) and those that are downregulated upon stimulation (C). (D) Heatmap showing 1,594 significantly differentially expressed transcripts (p < 0.05, fold change > 4) between TCR/C/TC-stimulated and UT CD8+ MAIT cells among the same three healthy individuals. (E) Visualization of the CD8+ MAIT cell transcripts elicited by differential stimulations in the subspace of the first principle components (PCs). Each colored circle represents a sample and is color coded in accordance with the conditions with which cells were stimulated, as illustrated on the right-hand side of the graph. (F–K) Volcano plots to visualize differentially expressed transcriptional profiles of activated CD8+ MAIT cells stimulated in different ways. Each point represents a single gene, and genes expressed at significantly higher or lower levels between the compared conditions are depicted, respectively, in the upper-right or upper-left corner of each plot. Genes discussed in the text are highlighted in blue (tissue repair associated) or in red (inflammation associated). The gene expression of untreated MAIT cells was compared to (F) T-, (G) C-, or (H) TC-stimulated MAIT cells. Further, gene expression in those cells was also compared directly between the different stimulation conditions: (I) T- to C- stimulation, (J) T- to TC-stimulation, and finally (K) C- to TC-stimulation. Data were acquired from three donors in one experiment. See also Figure S4 and Tables S1, S2, and S3.
Figure 5
Figure 5
TCR-Mediated Activation of MAIT Cells Leads to the Expression of Tissue-Repair-Associated Molecules and Accelerates Wound Healing (A–C) Gene set enrichment summary plots for stimulated sorted MAIT cell-versus-unstimulated cell-ranked genes. Depicted are the individual plots for TCR-stimulated versus UT in (A), TC-stimulated versus UT in (B), and C versus unstimulated in (C). Non-significant for C versus UT, normalized enrichment score (NES) = 1.63; p < 0.0002 for TCR versus UT, NES = 1.57; and p < 0.0002 for TC versus UT. Data were acquired from three donors in one experiment. (D) Flow cytometry analysis of the expression of TNF-α, furin, and CCL3 by CD161++/MAIT CD8+ T cells in response to fixed E. coli presented by THP1 cells in the presence or absence of an anti-MR1 (αMR1) blocking antibody at the 72-h time point. (E) Statistical analysis of the expression of the effector molecules shown in (D). (F) Caco2 cells were grown to confluency and scratched with a WoundMaker device to perform in vitro wound-healing assays. Cells were supplemented with different supernatants collected from 72-h cocultures of enriched CD8 T cells with E. coli-loaded THP1 cells in the presence or absence of αMR1, as indicated. The open wound areas were quantified as percentages of the initial wound size in the Caco2 cultures. Data points are mean ± SEM and were acquired from five biological replicates in two experiments. (G) Representative pictures of the closure of the wounds in Caco2 cultures treated as in (F) were assessed with time-lapse imaging over a time course of 36 h. Data were acquired from seven donors in three experiments. Differences among conditions were analyzed by two-way ANOVA. ns, not significant; p < 0.05, ∗∗p < 0.01, ∗∗∗∗p < 0.001. Scale bars, 250 μm. See also Figure S5 and Table S3.
Figure 6
Figure 6
Integrated Transcriptional Analyses Reveal the Relationship between In Vitro-Activated Human MAIT Cells and In Vivo-Activated Murine MAIT and Tc17 Cells Hierarchical clustering analysis of the transcriptomic profiles of the indicated cell populations is shown. Similarity between the expression profiles is measured using a Euclidean distance (height). Datasets were derived from ImmGen (Heng et al., 2008), Linehan et al. (2018), and Hinks et al. (2019) and were integrated as described in the STAR Methods section. The relevant datasets are colored. UT, TCR, C, and TC refer to the conditions used in this paper on in vitro-activated human CD8+ MAIT cells (blue). Topical Tc17 and H2M3_CD8_SLO refer to the H2M3-restricted populations identified in Linehan et al. (2018) in the skin and secondary lymphoid organs of mice, respectively (red). The cells described in Hinks et al. (2019) are marked in yellow (stimulated human MAIT cells) or green (chronic or acute, derived during a late or an early time point after L. longbeachae infection in mice, respectively). See also Figure S6.
Figure 7
Figure 7
MAIT Cells Can Be Found Close to and within the Colonic Epithelium (A–G) Representative images showing the expression of Va7.2, CD161, CD8, PLZF, CD3, and CD103 in the lamina propria and the epithelium of fixed samples of colonic polyp tissue. Samples were mounted on cytometer chips and iteratively stained with sets of three directly fluorochrome-conjugated antibodies as described in the methods section. Depicted are a merged picture (A) and all the individual stains for Va7.2 (B), CD161(C), CD8 (D), PLZF (E), CD3 (F), and CD103 (G). White arrows mark cells showing co-expression of Va7.2, CD161, PLZF, and CD3 that were defined as MAIT cells here. Note that while CD8 was co-expressed in most of them, CD8− MAITs (arrow + asterisk) could also be found. In contrast, CD103 was rarely co-expressed on MAITs (arrow + diamond). During the iterative staining process dust particles and other detritus can be picked up by the solution flowing over the tissue creating autofluorescent artifacts (1–4). While some of these get washed away after completion of the staining cycle (1, 4), others present during multiple imaging rounds (2, 3). Scale bars, 50μm.

Comment in

References

    1. Bamias G., Martin C., 3rd, Marini M., Hoang S., Mishina M., Ross W.G., Sachedina M.A., Friel C.M., Mize J., Bickston S.J. Expression, localization, and functional activity of TL1A, a novel Th1-polarizing cytokine in inflammatory bowel disease. J. Immunol. 2003;171:4868–4874. - PubMed
    1. Banki Z., Krabbendam L., Klaver D., Leng T., Kruis S., Mehta H., Müllauer B., Orth-Höller D., Stroiber H., Willberg C.B., Klenerman P. Antibody opsonization enhances MAIT cell responsiveness to bacteria via a TNF-dependent mechanism. Immunol. Cell Biol. 2019;97:538–551. - PMC - PubMed
    1. Billerbeck E., Kang Y.H., Walker L., Lockstone H., Grafmueller S., Fleming V., Flint J., Willberg C.B., Bengsch B., Seigel B. Analysis of CD161 expression on human CD8+ T cells defines a distinct functional subset with tissue-homing properties. Proc. Natl. Acad. Sci. USA. 2010;107:3006–3011. - PMC - PubMed
    1. Boniface K., Diveu C., Morel F., Pedretti N., Froger J., Ravon E., Garcia M., Venereau E., Preisser L., Guignouard E. Oncostatin M secreted by skin infiltrating T lymphocytes is a potent keratinocyte activator involved in skin inflammation. J. Immunol. 2007;178:4615–4622. - PubMed
    1. Chen Z., Wang H., D’Souza C., Sun S., Kostenko L., Eckle S.B.G., Meehan B.S., Jackson D.C., Strugnell R.A., Cao H. Mucosal-associated invariant T-cell activation and accumulation after in vivo infection depends on microbial riboflavin synthesis and co-stimulatory signals. Mucosal Immunol. 2017;10:58–68. - PubMed

Publication types