. 2019 Sep 17;20(18):4586.
doi: 10.3390/ijms20184586.

The miRNA-mRNA Networks Involving Abnormal Energy and Hormone Metabolisms Restrict Tillering in a Wheat Mutant dmc

Affiliations

The miRNA-mRNA Networks Involving Abnormal Energy and Hormone Metabolisms Restrict Tillering in a Wheat Mutant dmc

Junhang An et al. Int J Mol Sci. .

Abstract

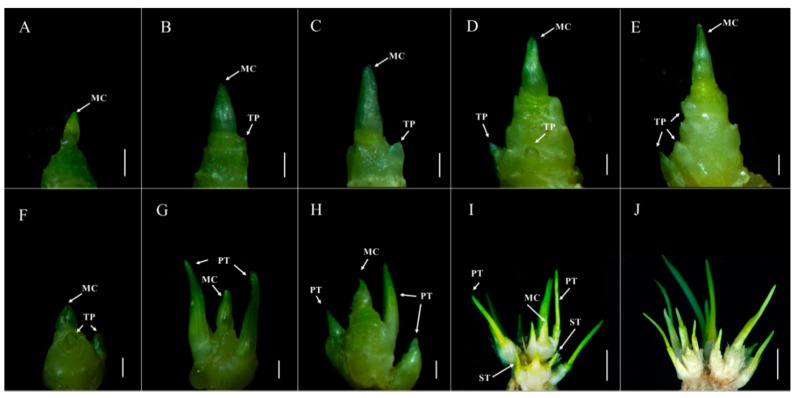
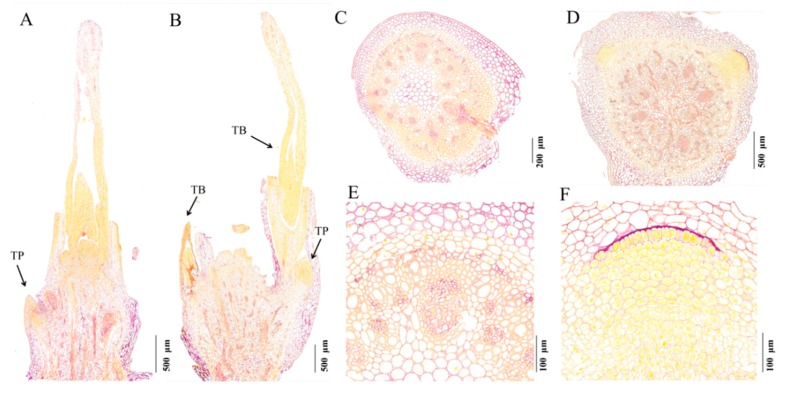
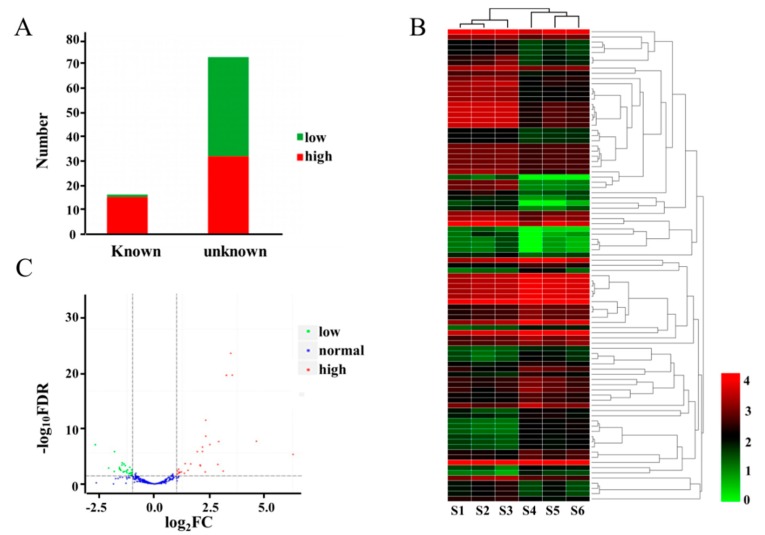
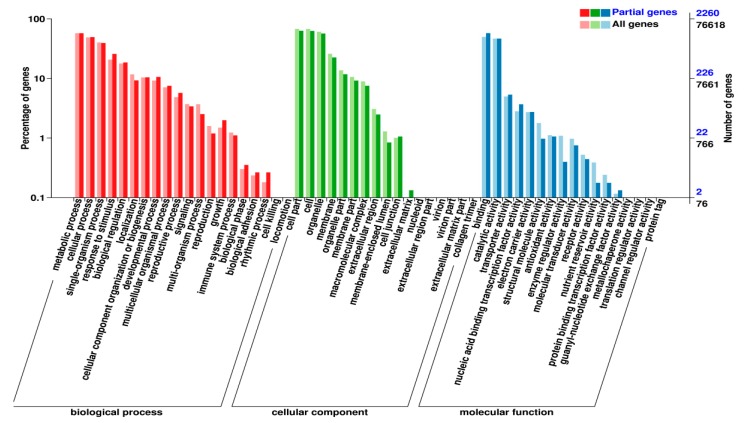
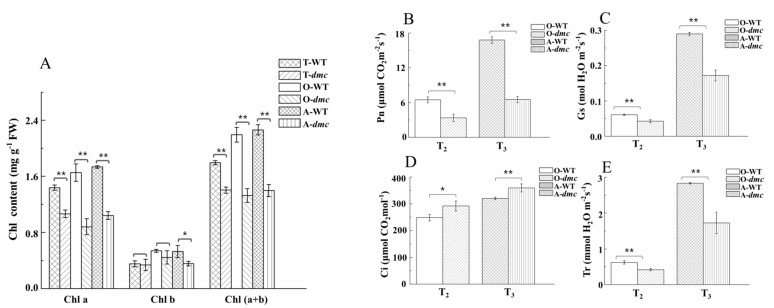
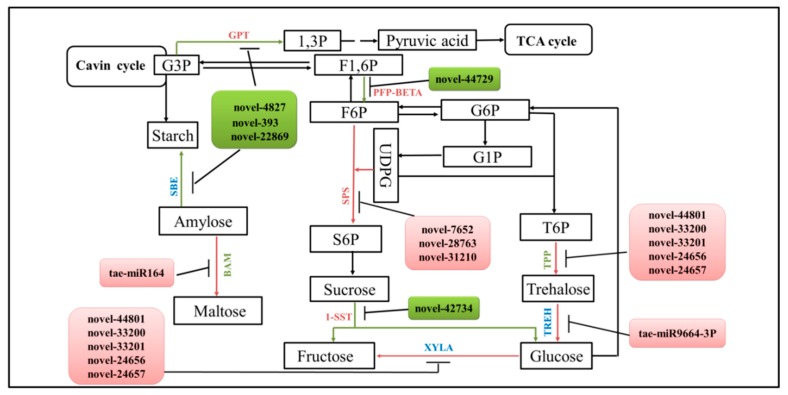
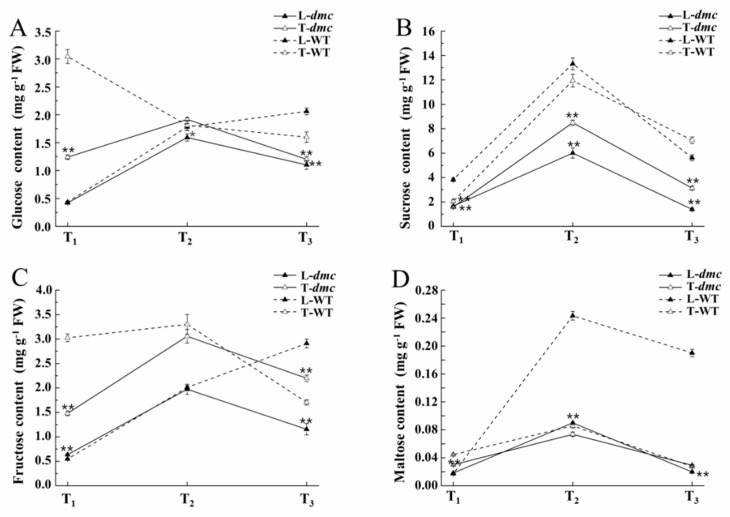
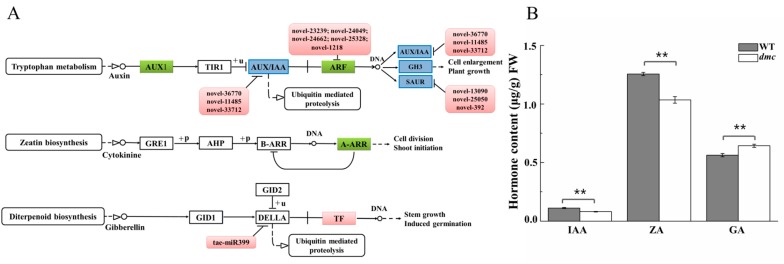
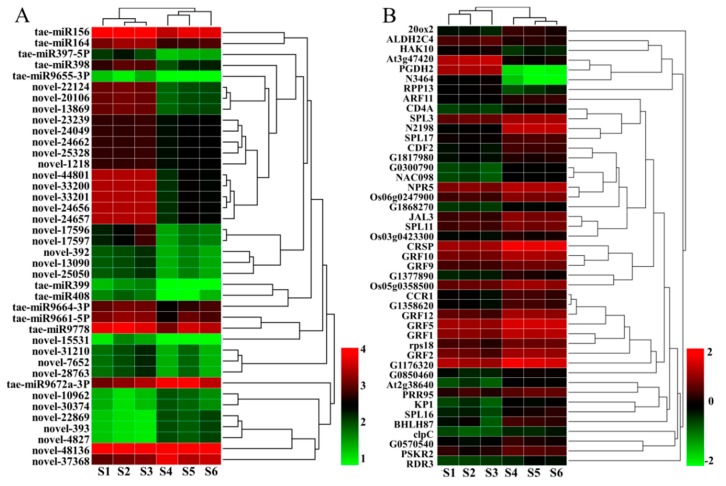
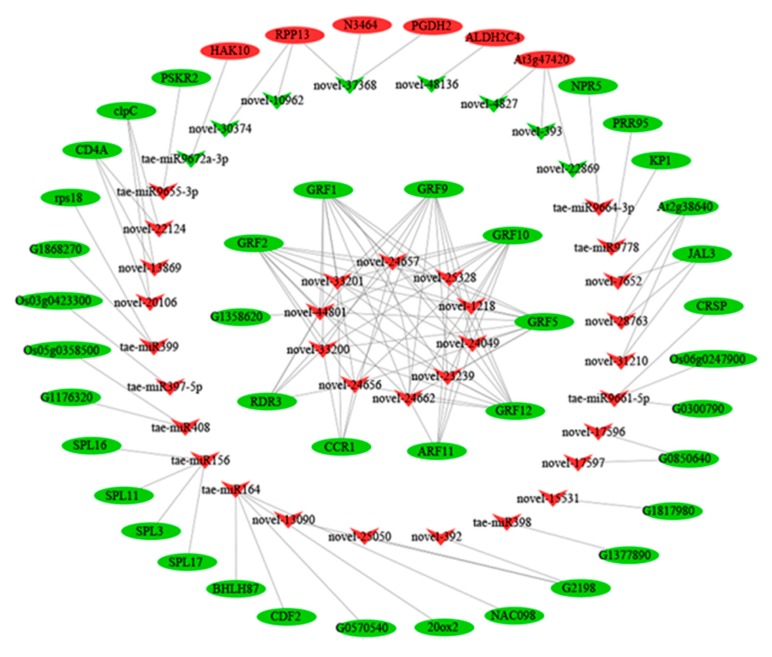
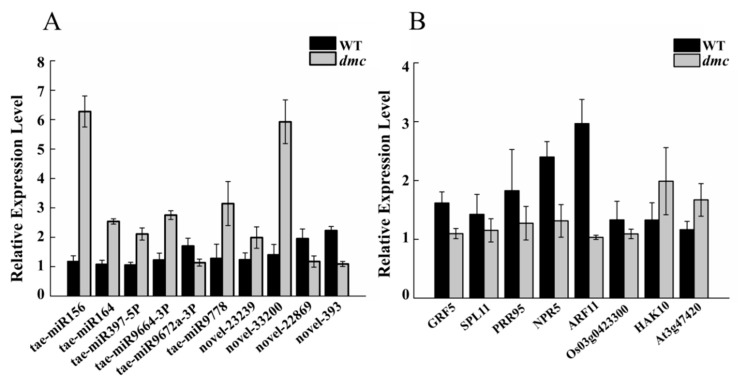
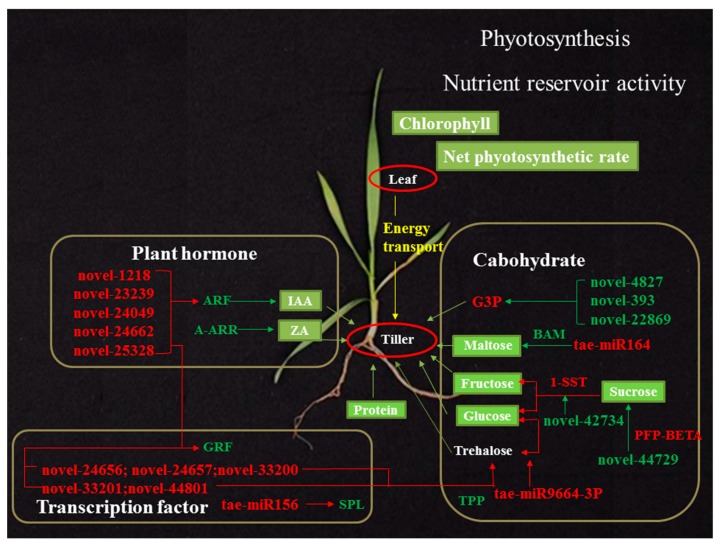
Tillers not only determine plant architecture but also influence crop yield. To explore the miRNA regulatory network restraining tiller development in a dwarf-monoculm wheat mutant (dmc) derived from Guomai 301 (wild type, WT), we employed miRNome and transcriptome integrative analysis, real-time qRT-PCR, histochemistry, and determinations of the key metabolites and photosynthesis parameters. A total of 91 differentially expressed miRNAs (DEMs) were identified between dmc and WT. Among them, 40 key DEMs targeted 45 differentially expressed genes (DEGs) including the key DEGs encode growth-regulating factors (GRF), auxin response factors (ARF), and other proteins involved in the metabolisms of hormones and carbohydrates, etc. Compared with WT, both the chlorophyll contents and the photosynthesis rate were lower in dmc. The contents of glucose, sucrose, fructose, and maltose were lower in dmc. The contents of auxin (IAA) and zeatin (ZA) were significantly lower, but gibberellin (GA) was significantly higher in the tiller tissues of dmc. This research demonstrated that the DEMs regulating hormone and carbohydrate metabolisms were important causes for dmc to not tiller. A primary miRNA-mRNA regulatory model for dmc tillering was established. The lower photosynthesis rate, insufficient energy, and abnormal hormone metabolisms restrict tillering in dmc.

Keywords: carbohydrate; dmc mutant; mRNA; miRNA; photosynthesis; phytohormone; tillering; wheat (Triticum aestivum L.).


Conflict of interest statement

The authors declare that the research was conducted in the absence of any commercial or financial relationships that could be construed as a potential conflict of interest.

Figures

Figure 1
Figure 1
The tiller micromorphology of dwarf-monoculm wheat mutant (dmc) (AE) and WT (FJ). A, B, C, D, E: dmc at the two-leaf stage, three-leaf stage, four-leaf stage, over-winter stage, and between the rising and jointing stage. F, G, H, I: WT at the two-leaf stage, three-leaf stage, four-leaf stage, and over-winter stage. J: some tillers of WT at between the rising and jointing stage. MC: main culm; TP: tiller primordium; PT: primary tiller; ST: secondary tiller. A-H, scale bar = 1 mm; I and J, scale bar = 1 cm.
Figure 2
Figure 2
The distribution of starch (purple) and protein (yellow) in wheat tillers of WT and dmc at the three-leaf stage. Tiller histological section micrographs of WT (B,D,F) and mutant dmc (A,C,E). (A) Longitudinal section of the tiller bud of dmc (arrowhead); (B) Longitudinal section of tillers of WT (arrowheads); (C) Transection of the tiller base of dmc; (D) Transection of the tiller base of WT; (E) An enlarged view of C; (F) An enlarged view of D. TP: tiller primordium; TB: tiller bud.
Figure 3
Figure 3
Expression profiles of the differentially expressed miRNAs (DEMs) between dmc and WT. (A) Stacking bar diagram of the DEMs; (B) Heatmap of the DEMs. S1, S2, S3: mutant dmc; S4, S5, S6: WT. The color scale indicates the values of LgFPKM; FPKM: fragments per kilobase of transcript per million. (C) Volcano plots of the DEMs. The red dots represent the highly expressed DEMs in dmc, green dots represent the lowly expressed DEMs in dmc, and blue dots represent no difference in DEM expression between dmc and WT; FC: fold change; FDR; false discovery rate.
Figure 4
Figure 4
Functional classification of the target genes of the DEMs, referring to the GO database.
Figure 5
Figure 5
The chlorophyII contents and photosynthetic parameters of the fully expanded main-stem leaves of dmc and WT during tillering. (A) Leaf chlorophyII content. Chl a, the content of chlorophyII a; Chl b, the content of chlorophyII b; Chl (a + b), the content of chlorophy II a + b. (BE) Leaf photosynthesis parameters. Each bar represents the mean ± SD of three biological replicates. Asterisks indicate a statistically significant difference between dmc and WT at the same stage (*: P ≤ 0.05, **: P ≤ 0.01). T-WT: WT at the three-leaf stage; T-dmc: dmc at the three-leaf stage; O-WT: WT at the over-winter stage; O-dmc: dmc at the over-winter stage; A-WT: WT between the rising to jointing stage; A-dmc: dmc between the rising to jointing stage.
Figure 6
Figure 6
The key carbohydrate metabolic pathway and the miRNA–mRNA interactions in dmc. Pink: highly expressed in dmc; green: lowly expressed in dmc; blue: no difference in expression between dmc and WT. G3P: glycerol-3-phosphate transporter 1 (At3g47420); SBE: 1,4-alpha-glucan-branching enzyme (SBE1); Beta-amylase (BAM); PEP-BETA: pyrophosphate-fructose 6-phosphate 1-phosphotransferase subunit alpha (PEP-BETA); SPS: sucrose-phosphate synthase 4/5 (SPS4/SPS5); 1-SST: sucrose 1-fructosyltransferase (1-SST); XYLA: xylose isomerase (XYLA); TPP: trehalose-phosphate phosphatase 2 (TPP2); TREH: trehalase (TREH); F6P: fructose-6 -phosphate; G6P: glucose-6-phophate; F1,6P: 1,6-fructose diphosphate; S6P: sucrose-6-posphate; T6P: trehalose-6-phosphate; G1P: glucose-1-phosphate; 1,3P: 1,3-diphosphoglycerate; UDPG: uridine diphosphate glucose.
Figure 7
Figure 7
The carbohydrate contents in leaves and tiller nodes of dmc and WT. (A) Glucose content; (B) Sucrose content; (C) Fructose content; (D) Maltose content; L-WT: WT leaves; T-WT: WT tiller nodes; L-dmc: dmc leaves; T-dmc: dmc tiller nodes; T1: three-leaf stage; T2: over-winter stage; T3: between the rising to jointing stage (*: P ≤ 0.05, **: P ≤ 0.01).
Figure 8
Figure 8
The auxin (IAA), zeatin (ZA) and gibberellin (GA) contents and the metabolism pathways. (A)The phytohormone metabolism pathways referenced to ko04075 in the KEGG database. (B) The contents of IAA, ZA, and GA in tiller nodes of dmc and WT. Pink: highly expressed in dmc; green: lowly expressed in dmc; blue: no difference in expression between dmc and WT (**: P ≤ 0.01).
Figure 9
Figure 9
Heat maps of the differentially expressed miRNAs and mRNA between dmc and WT. (A) Heat map of the DEMs. (B) Heat map of the DEGs. S1, S2, S3: mutant dmc; S4, S5, S6: WT. The color scales indicate the values of LgFPKM.
Figure 10
Figure 10
Negative regulation networks between the key DEMs and their target DEGs in dmc. The red indicates highly expressed in dmc, the green indicates lowly expressed in dmc, ellipses indicate DEGs, arrowheads indicate DEMs, the lines indicate the regulation relationship.
Figure 11
Figure 11
The expression profiles of ten DEMs and eight of their target DEGs. (A) The expression profiles of ten DEMs; (B) The expression profiles of eight target DEGs. GRF5 was targeted by novel-23239, novel-33200; SPL11 was targeted by tae-miR156; PRR95 was targeted by tae-miR9778; NPR5 was targeted by tae-miR9664-3P; ARF11 was targeted by novel-23239; Os03g0423300 was targeted by tae-miR397-5P; HAK10 was targeted by tae-miR9672a-3P; At3g47420 was targeted by novel-22869 and novel-393.
Figure 12
Figure 12
A molecular regulatory hypothesis of the dmc. Red: up-regulated; green: down-regulated compared to WT. Lower photosynthesis from the leaves produces fewer energy substances for transport to tiller nodes (Figure 5). Differentially expressed miRNAs regulated their target genes in the carbohydrate metabolism pathway and resulted in lower sugar content in tiller nodes (Figure 6 and Figure 7). Differentially expressed miRNAs also regulate transcription factor genes such as SPL, GRF, and plant hormone metabolism genes, such as ARF and A-ARR (Figure 8). Transcription factors, in turn, regulate other metabolisms such as carbohydrate and plant hormone metabolism pathways. In the end, the key substances that guarantee normal wheat tillering are in significant deficit, such as plant hormones IAA and ZA, soluble sugars, and proteins. These are the major factors restraining tillering in dmc.

References

    1. Doust A.N. Grass architecture: Genetic and environmental control of branching. Curr. Opin. Plant Biol. 2007;10:21–25. doi: 10.1016/j.pbi.2006.11.015. - DOI - PubMed
    1. Kebrom T.H., Chandler P.M., Swain S.M., King R.W., Richards R.A., Spielmeyer W. Inhibition of tiller bud outgrowth in the tin mutant of wheat is associated with precocious internode development. Plant Physiol. 2012;160:308–318. doi: 10.1104/pp.112.197954. - DOI - PMC - PubMed
    1. Hu Y.S., Ren T.H., Li Z., Tang Y.Z., Ren Z.L., Yan B.J. Molecular mapping and genetic analysis of a QTL controlling spike formation rate and tiller number in wheat. Gene. 2017;634:15–21. doi: 10.1016/j.gene.2017.08.039. - DOI - PubMed
    1. Li X., Qian Q., Fu Z., Wang Y., Xiong G., Zeng D., Wang X., Liu X., Teng S., Hiroshi F., et al. Control of tillering in rice. Nature. 2003;422:618–621. doi: 10.1038/nature01518. - DOI - PubMed
    1. Sun F., Zhang W., Xiong G., Yan M., Qian Q., Li J., Wang Y. Identification and functional analysis of the MOC1 interacting protein 1. J. Genet. Genom. 2010;37:69–77. doi: 10.1016/S1673-8527(09)60026-6. - DOI - PubMed

LinkOut - more resources