

Strengthening surveillance systems for malaria elimination: a global landscaping of system performance, 2015-2017
- PMID: 31533740
- PMCID: PMC6751607
- DOI: 10.1186/s12936-019-2960-2
Strengthening surveillance systems for malaria elimination: a global landscaping of system performance, 2015-2017
Abstract
Background: Surveillance is a core component of an effective system to support malaria elimination. Poor surveillance data will prevent countries from monitoring progress towards elimination and targeting interventions to the last remaining at-risk places. An evaluation of the performance of surveillance systems in 16 countries was conducted to identify key gaps which could be addressed to build effective systems for malaria elimination.
Methods: A standardized surveillance system landscaping was conducted between 2015 and 2017 in collaboration with governmental malaria programmes. Malaria surveillance guidelines from the World Health Organization and other technical bodies were used to identify the characteristics of an optimal surveillance system, against which systems of study countries were compared. Data collection was conducted through review of existing material and datasets, and interviews with key stakeholders, and the outcomes were summarized descriptively. Additionally, the cumulative fraction of incident infections reported through surveillance systems was estimated using surveillance data, government records, survey data, and other scientific sources.
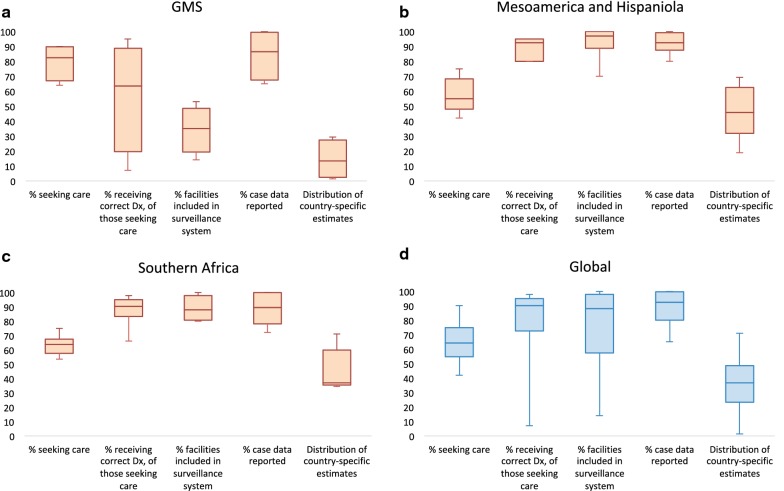
Results: The landscaping identified common gaps across countries related to the lack of surveillance coverage in remote communities or in the private sector, the lack of adequate health information architecture to capture high quality case-based data, poor integration of data from other sources such as intervention information, poor visualization of generated information, and its lack of availability for making programmatic decisions. The median percentage of symptomatic cases captured by the surveillance systems in the 16 countries was estimated to be 37%, mostly driven by the lack of treatment-seeking in the public health sector (64%) or, in countries with large private sectors, the lack of integration of this sector within the surveillance system.
Conclusions: The landscaping analysis undertaken provides a clear framework through which to identify multiple gaps in current malaria surveillance systems. While perfect systems are not required to eliminate malaria, closing the gaps identified will allow countries to deploy resources more efficiently, track progress, and accelerate towards malaria elimination. Since the landscaping undertaken here, several countries have addressed some of the identified gaps by improving coverage of surveillance, integrating case data with other information, and strengthening visualization and use of data.
Keywords: Elimination; Malaria; Surveillance; Surveillance system.
Conflict of interest statement
The authors declare they have no competing interests.
Figures

References
-
- Nsubuga P, White ME, Thacker SB, Anderson MA, Blount SB, Broome CV, et al. Public health surveillance: a tool for targeting and monitoring interventions. In: Jamison DT, Breman JG, Measham AR, Alleyne G, Claeson M, Evans DB, et al., Eds. Disease Control Priorities in Developing Countries. 2nd ed. Washington (DC): World Bank; 2006. http://www.ncbi.nlm.nih.gov/books/NBK11770/.
-
- World Health Organization . Communicable disease surveillance and response systems: guide to monitoring and evaluating. Geneva: World Health Organization; 2006.
-
- WHO. Report on global surveillance of epidemic-prone infectious diseases. Geneva: World Health Organization; 2000. http://www.who.int/csr/resources/publications/surveillance/WHO_Report_In.... Accessed Mar 13 2018.
-
- WHO. A framework for malaria elimination. Geneva: World Health Organization; 2017. http://www.who.int/malaria/publications/atoz/9789241511988/en/. Accessed Sep 9 2017.
MeSH terms
Grants and funding
LinkOut - more resources
Full Text Sources
Medical
