. 2019 Sep 18;7(1):255.
doi: 10.1186/s40425-019-0734-6.

Immunosuppression by monocytic myeloid-derived suppressor cells in patients with pancreatic ductal carcinoma is orchestrated by STAT3

Affiliations

Immunosuppression by monocytic myeloid-derived suppressor cells in patients with pancreatic ductal carcinoma is orchestrated by STAT3

Rosalinda Trovato et al. J Immunother Cancer. .

Abstract

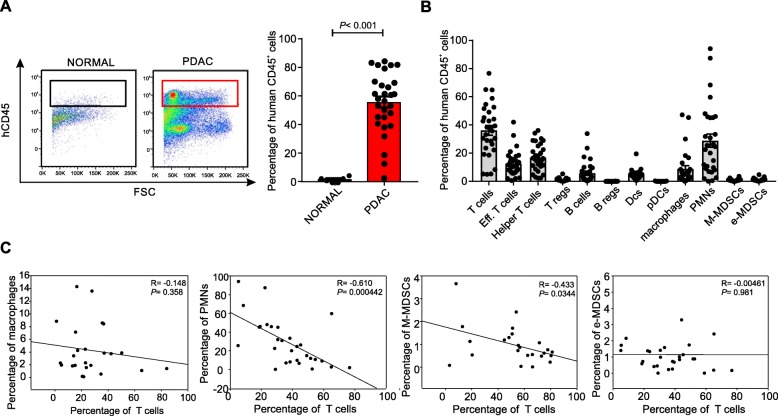
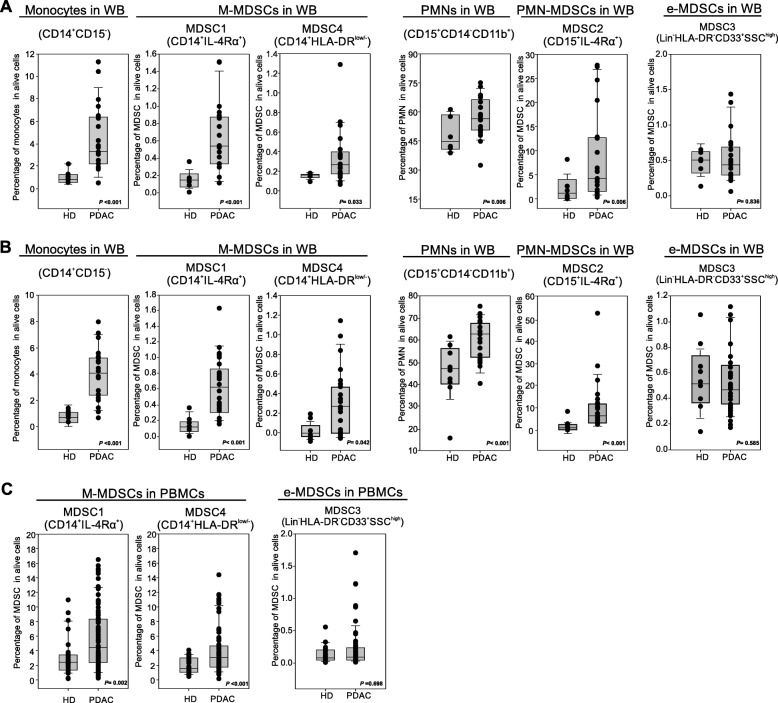
Background: Pancreatic ductal adenocarcinoma (PDAC) is a highly devastating disease with an overall 5-year survival rate of less than 8%. New evidence indicates that PDAC cells release pro-inflammatory metabolites that induce a marked alteration of normal hematopoiesis, favoring the expansion and accumulation of myeloid-derived suppressor cells (MDSCs). We report here that PDAC patients show increased levels of both circulating and tumor-infiltrating MDSC-like cells.

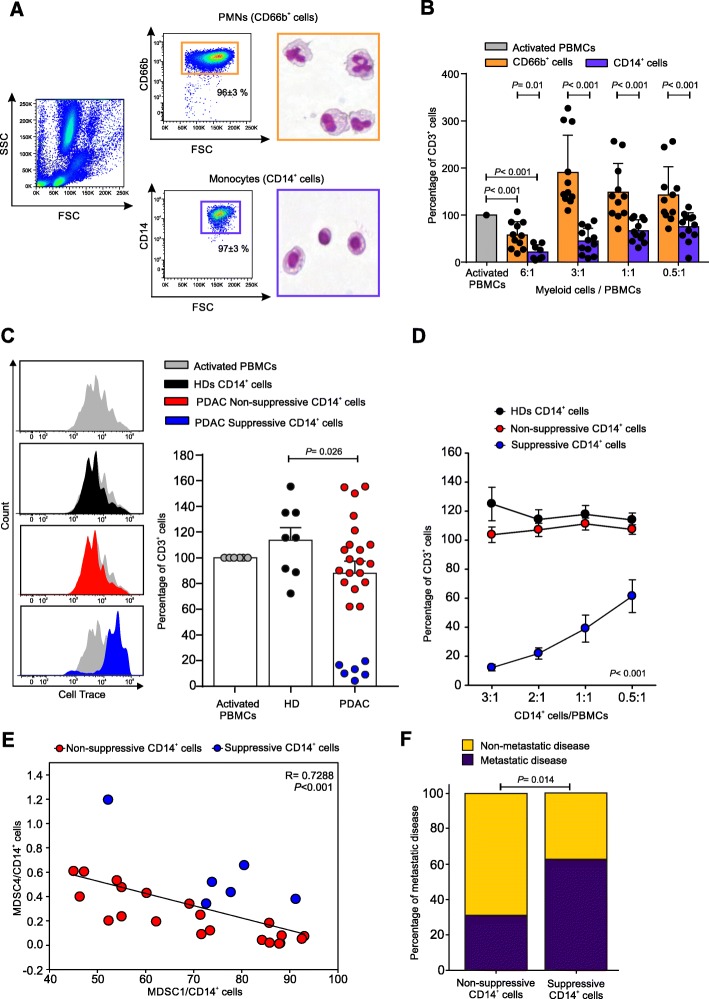
Methods: The frequency of MDSC subsets in the peripheral blood was determined by flow cytometry in three independent cohorts of PDAC patients (total analyzed patients, n = 117). Frequency of circulating MDSCs was correlated with overall survival of PDAC patients. We also analyzed the frequency of tumor-infiltrating MDSC and the immune landscape in fresh biopsies. Purified myeloid cell subsets were tested in vitro for their T-cell suppressive capacity.

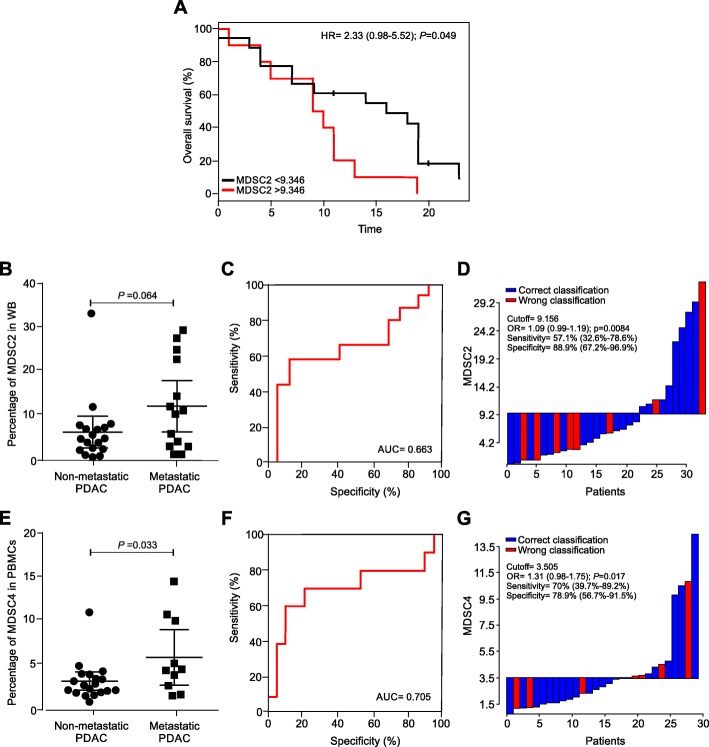
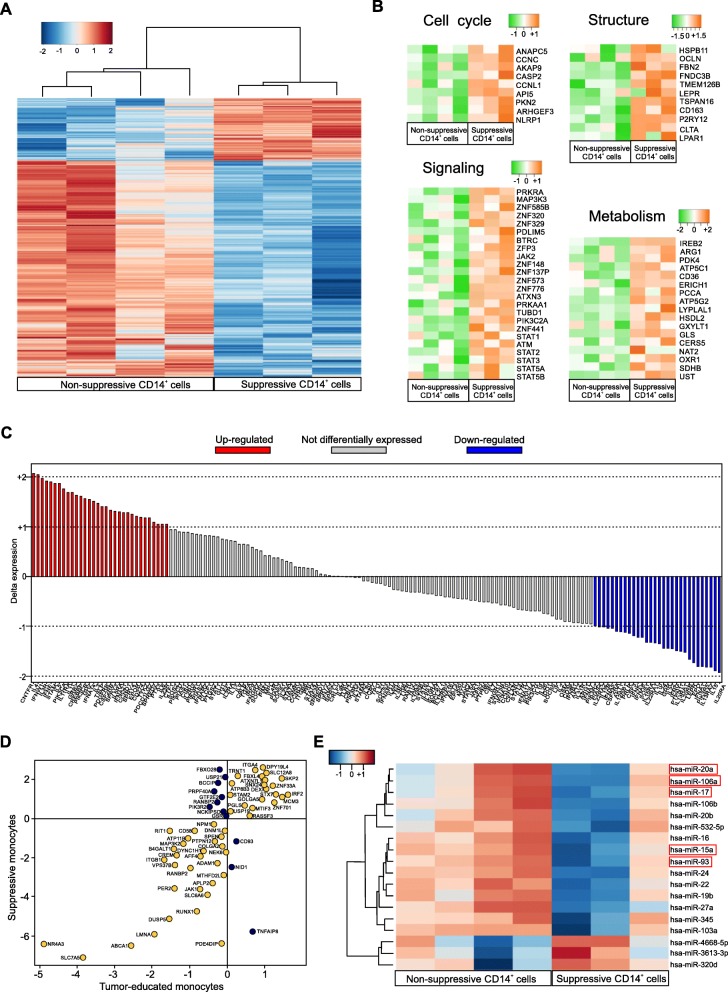
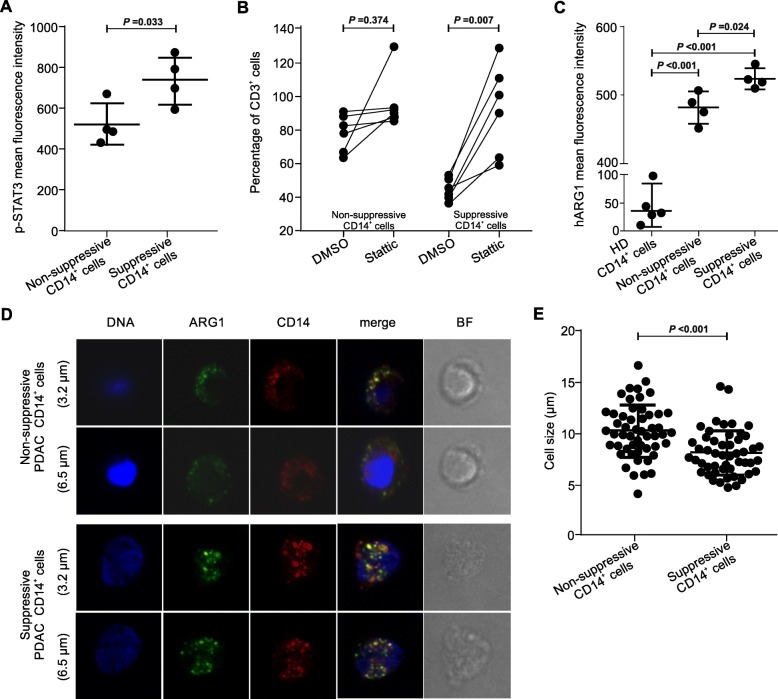
Results: Correlation with clinical data revealed that MDSC frequency was significantly associated with a shorter patients' overall survival and metastatic disease. However, the immunosuppressive activity of purified MDSCs was detectable only in some patients and mainly limited to the monocytic subset. A transcriptome analysis of the immunosuppressive M-MDSCs highlighted a distinct gene signature in which STAT3 was crucial for monocyte re-programming. Suppressive M-MDSCs can be characterized as circulating STAT3/arginase1-expressing CD14+ cells.

Conclusion: MDSC analysis aids in defining the immune landscape of PDAC patients for a more appropriate diagnosis, stratification and treatment.

Keywords: Innate immunity; Myeloid-derived suppressor cells (MDSC); Pancreatic ductal adenocarcinoma (PDAC); Tumor progression; Tumor-associated immunosuppression.


Conflict of interest statement

The authors declare that they have no competing interests.

Figures

Fig. 1
Fig. 1
Immune characterization of PDAC tumor microenvironment. a Leukocytes infiltration (CD45+ cells) in normal pancreas (n = 5) and PDAC tissue (n = 29) biopsies. Statistical analysis was performed by ANOVA test. b Immune populations abundance (% of CD45+ cells) in PDAC tissues. c Correlation between tumor-infiltrating T cells with either macrophages, PMNs, M-MDSCs or e-MDSCs within PDAC tissues. Correlation analysis was performed by Spearman’s rank correlation
Fig. 2
Fig. 2
Blood-circulating MDSC enumeration in PDAC patients. a-b Flow cytometry analysis of circulating myeloid cells in whole blood of two independent cohorts of PDAC patients (b PDAC n = 21, HD = 8; c PDAC n = 23, HD = 9): monocytes (CD14+CD15), MDSC1 (CD14+IL-4Rα+), MDSC4 (CD14+HLA-DRlow/−), granulocytes (CD15+CD14), MDSC2 (CD15+IL-4Rα+) and MDSC3 (LINHLA-DRCD33+SSChigh). c Flow cytometry analysis of circulating M-MDSCs (MDSC1, CD14+IL-4Rα+; MDSC4, CD14+HLA-DRlow/−) and e-MDSCs (MDSC3, LINHLA-DRCD33+SSChigh) in PDAC patients (n = 73) compared to healthy donors (HD; n = 28). M-MDSC percentages were evaluated on frozen PBMCs, whereas e-MDSCs on the whole blood. Statistical analysis was performed by ANOVA test
Fig. 3
Fig. 3
Prognostic potential predictive role of MDSCs in PDAC patients. a Kaplan–Meier curves for OS by significant MDSC2 cutoff frequency in fresh whole blood samples. b MDSC2 percentages in non-metastatic and metastatic PDAC patients. Mean and 95% confidence interval are plotted. Statistical analysis was performed by ANOVA test. c Receiver operator characteristic (ROC) curve for MDSC2 percentage in metastatic disease prediction. d Waterfall plot of optimal dichotomization; blue and red bars represent cases with correct or wrong classification, respectively. e MDSC4 percentage in non-recurrent and recurrent PDAC patients. Mean and 95% confidence interval are plotted. Statistical analysis was performed by ANOVA test. f Receiver operator characteristic (ROC) curve for MDSC4 percentage in metastatic disease prediction. g Waterfall plot of optimal dichotomization, blue and red bars represent cases with correct or wrong classification, respectively
Fig. 4
Fig. 4
Circulating monocytes from PDAC patients are able to restrain T cell proliferation in vitro. a Freshly isolated PMNs (CD66b+ cells, orange box) and monocytes (CD14+ cells, blue box) from PDAC patients analysed by flow cytometry and haematoxylin-eosin staining. b Functional assay reflecting the different ability of PMNs and monocytes to affect T cells proliferation when co-cultured in vitro with CD3/CD28-activated-PBMCs at different ratios. All values are normalized on the activated PBMCs in the absence of myeloid cells (grey bar) and reported as percentage of Cell Trace+CD3+ cells. Statistical analysis was performed by ANOVA test. c Functional assay performed (at 1:3 ratio of PBMCs:CD14+ cells) on monocytes of PDAC patients (n = 26) compared to HDs (n = 8), reported as percentage of CD3+ proliferating cells (right panel) and graphed as proliferation peaks of Cell Trace+CD3+cells after the co-culture (left panel). Among all PDAC patients, “Suppressive CD14+ cells” (blue) and “Non-suppressive CD14+ cells” (red) were grouped based on the quantitative analysis of the in vitro immunosuppressive function. Statistical analysis was performed by ANOVA test. d Different ability of suppressive and non-suppressive monocytes to limit CD3+ T cell proliferation at different cell ratios. Statistical analysis was performed by ANOVA test. e Pearson correlation between MDSC4 and MDSC1 among CD14+ cells of PDAC patients. f Pro-metastatic potential of suppressive CD14+ cells. Statistical analysis was performed by Pearson Chi-Square test
Fig. 5
Fig. 5
Gene profiling of suppressive CD14+ cells isolated from PDAC patient. a Supervised clustering of suppressive and not suppressive monocytes arrays using 1119 differentially expressed genes (FDR < 0.05 and absolute fold change > 2). b Clustering of cell cycle, structure, signaling and metabolism in suppressive- and not suppressive monocytes (absolute fold change > 2; FDR < 20%). c Difference in expression between suppressive monocytes isolated from PDAC patients and human BM-MDSCs samples for genes in JAK/STAT Signaling Pathway. d Dot plot of log fold change demonstrating common (yellow plots) or different (purple plots) gene expression modulation between differentially expressed signature of either tumor-educated or suppressive monocytes to related controls. e miRNAs-expression profile of suppressive and non-suppressive CD14+ cells isolated from PDAC patients using 19 differentially expressed miRNAs (FDR < 0.05 and absolute fold change > 2)
Fig. 6
Fig. 6
STAT3/ARG1 signaling is up-regulated in suppressive monocytes. a p-STAT3 detection in suppressive (n = 4) and non-suppressive (n = 4) PDAC patients’ monocytes was evaluated by flow cytometry. Statistical analysis was performed by ANOVA test. b Functional assay performed (at 1:3 ratio of PBMCs:CD14+ cells) on suppressive (n = 6) and non-suppressive (n = 6) monocytes of PDAC patients. CD14+ cells were treated with Stattic (5 μM) or DMSO for 30 min and, after the treatment, cells were washed three times and plated with T cells. Data are reported as percentage of CD3+ proliferating cells in three independent experiments. Statistical analysis was performed by ANOVA test. c ARG1 detection in suppressive (n = 4) and non-suppressive (n = 4) purified PDAC patients’ monocytes was evaluated by flow cytometry. As control, ARG1 expression in purified monocytes isolated from HDs is shown (n = 5). Statistical analysis was performed by ANOVA test. d Representative images of sorted, not suppressive or suppressive CD14+ cells obtained from patients with PDAC, stained for DNA (DAPI), ARG1 (green) and CD14 (red). BF = bright field. e Quantification of cell size by confocal microscopic analysis. Data shown 13 independent measures of each donors (N = 4). Statistical analysis was performed by ANOVA test

References

    1. Groot VP, et al. Patterns, timing, and predictors of recurrence following pancreatectomy for pancreatic ductal adenocarcinoma. Ann Surg. 2018;267(5):936–945. - PubMed
    1. Neoptolemos JP, et al. Comparison of adjuvant gemcitabine and capecitabine with gemcitabine monotherapy in patients with resected pancreatic cancer (ESPAC-4): a multicentre, open-label, randomised, phase 3 trial. Lancet. 2017;389(10073):1011–1024. - PubMed
    1. Cid-Arregui A, Juarez V. Perspectives in the treatment of pancreatic adenocarcinoma. World J Gastroenterol. 2015;21(31):9297–9316. - PMC - PubMed
    1. Incio J, et al. Obesity-induced inflammation and Desmoplasia promote pancreatic Cancer progression and resistance to chemotherapy. Cancer Discov. 2016;6(8):852–869. - PMC - PubMed
    1. Rielland M, et al. Senescence-associated SIN3B promotes inflammation and pancreatic cancer progression. J Clin Invest. 2014;124(5):2125–2135. - PMC - PubMed

Publication types

MeSH terms