

Identifying clusters of cis-regulatory elements underpinning TAD structures and lineage-specific regulatory networks
- PMID: 31533978
- PMCID: PMC6771399
- DOI: 10.1101/gr.248658.119
Identifying clusters of cis-regulatory elements underpinning TAD structures and lineage-specific regulatory networks
Abstract
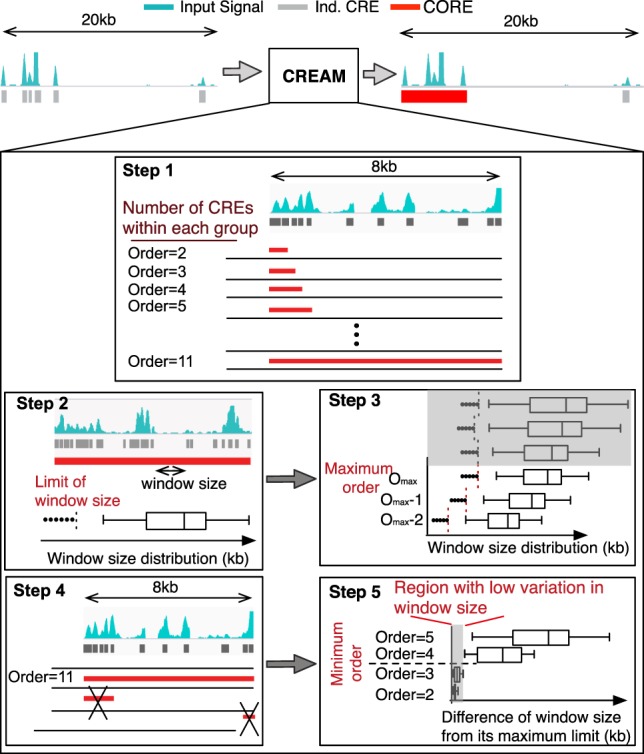
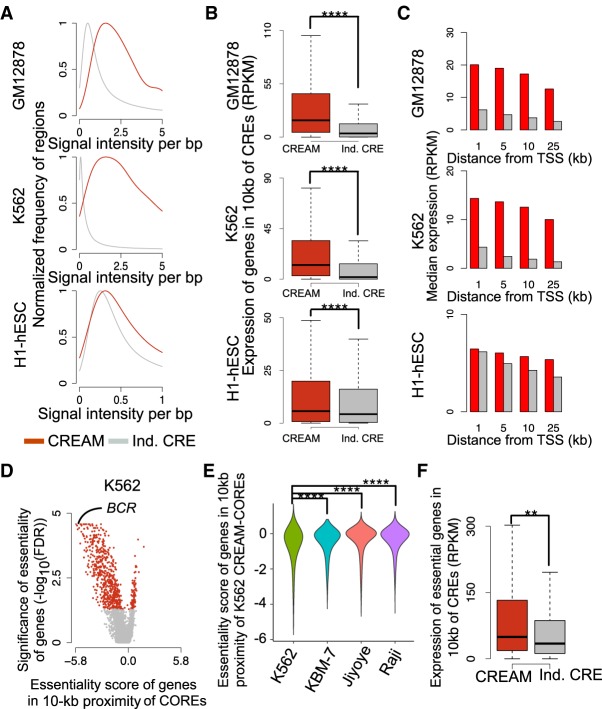
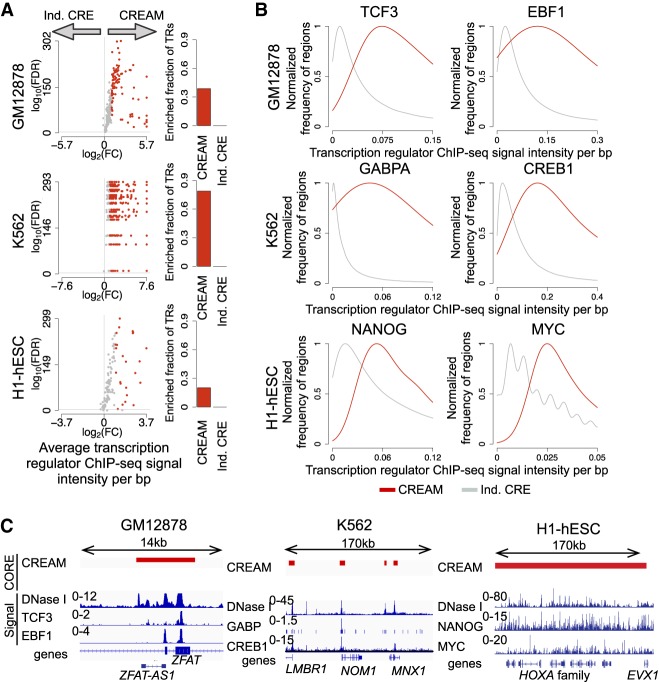
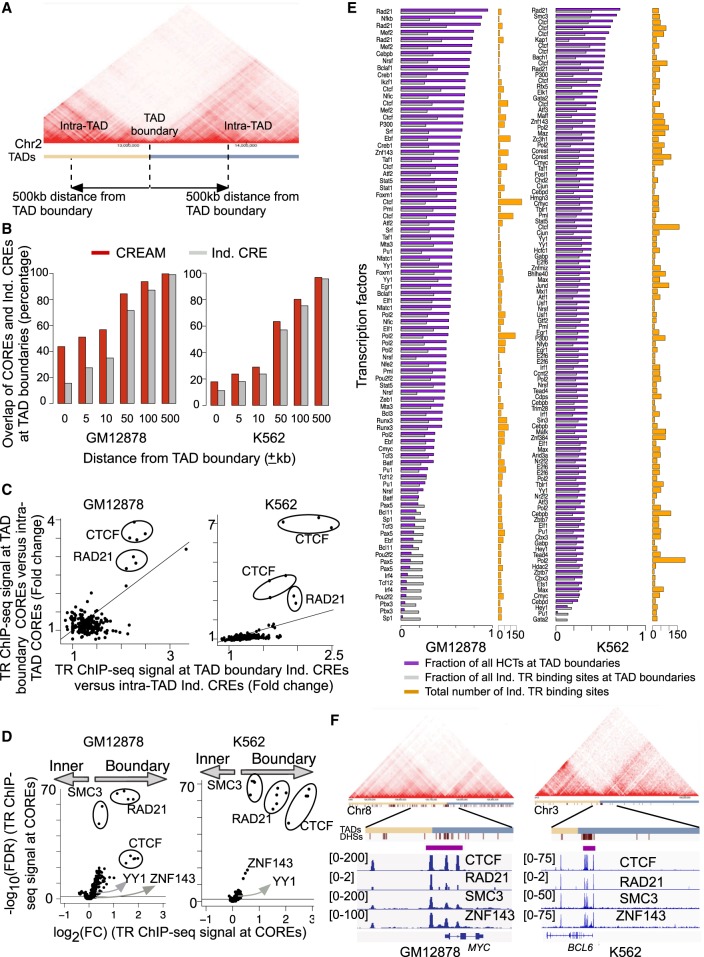
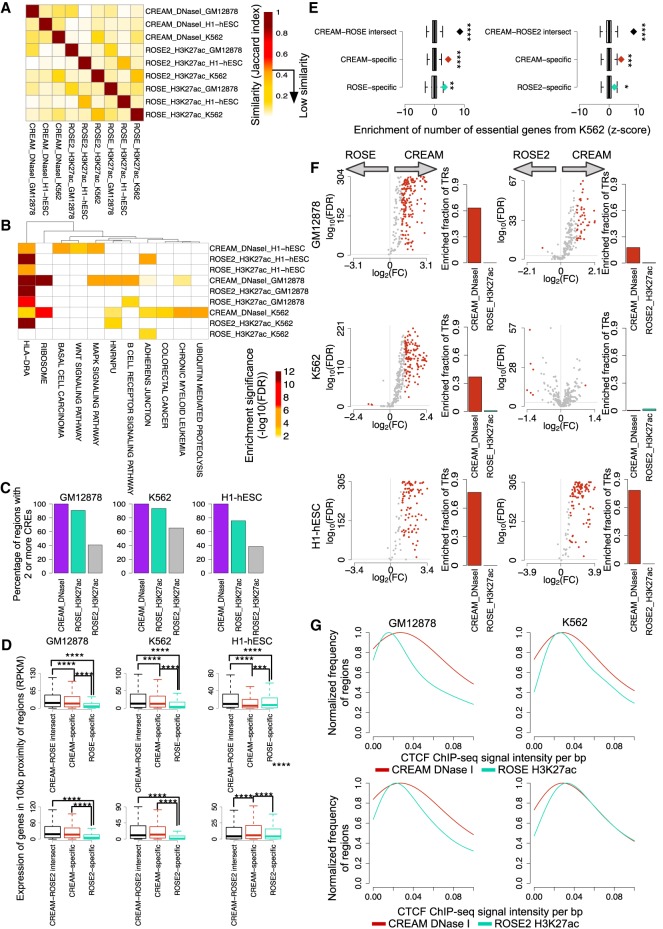
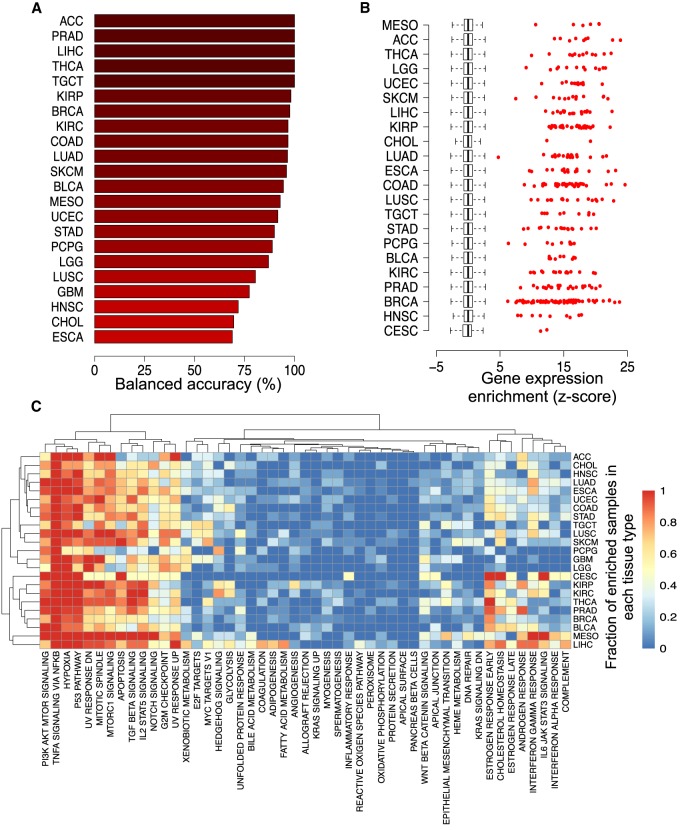
Cellular identity relies on cell-type-specific gene expression controlled at the transcriptional level by cis-regulatory elements (CREs). CREs are unevenly distributed across the genome, giving rise to individual CREs and clusters of CREs (COREs). Technical and biological features hinder CORE identification. We addressed these issues by developing an unsupervised machine learning approach termed clustering of genomic regions analysis method (CREAM). CREAM automates CORE detection from chromatin accessibility profiles that are enriched in CREs strongly bound by master transcription regulators, proximal to highly expressed and essential genes, and discriminating cell identity. Although COREs share similarities with super-enhancers, we highlight differences in terms of the genomic distribution and structure of these cis-regulatory units. We further show the enhanced value of COREs over super-enhancers to identify master transcription regulators, highly expressed and essential genes defining cell identity. COREs enrich at topologically associated domain (TAD) boundaries. They are also preferentially bound by the chromatin looping factors CTCF and cohesin, in contrast to super-enhancers, forming clusters of CTCF and cohesin binding regions and defining homotypic clusters of transcription regulator binding regions (HCTs). Finally, we show the clinical utility of CREAM to identify COREs across chromatin accessibility profiles to stratify more than 400 tumor samples according to their cancer type and to delineate cancer type-specific active biological pathways. Collectively, our results support the utility of CREAM to delineate COREs underlying, with greater accuracy than individual CREs or super-enhancers, the cell-type-specific biological underpinning across a wide range of normal and cancer cell types.
© 2019 Madani Tonekaboni et al.; Published by Cold Spring Harbor Laboratory Press.
Figures
Similar articles
-
Enhancer accessibility and CTCF occupancy underlie asymmetric TAD architecture and cell type specific genome topology.Nat Commun. 2019 Jul 2;10(1):2908. doi: 10.1038/s41467-019-10725-9. Nat Commun. 2019. PMID: 31266948 Free PMC article.
-
Specific Contributions of Cohesin-SA1 and Cohesin-SA2 to TADs and Polycomb Domains in Embryonic Stem Cells.Cell Rep. 2019 Jun 18;27(12):3500-3510.e4. doi: 10.1016/j.celrep.2019.05.078. Cell Rep. 2019. PMID: 31216471 Free PMC article.
-
Multiple CTCF sites cooperate with each other to maintain a TAD for enhancer-promoter interaction in the β-globin locus.FASEB J. 2021 Aug;35(8):e21768. doi: 10.1096/fj.202100105RR. FASEB J. 2021. PMID: 34245617
-
Cell-Selective Regulation of CFTR Gene Expression: Relevance to Gene Editing Therapeutics.Genes (Basel). 2019 Mar 19;10(3):235. doi: 10.3390/genes10030235. Genes (Basel). 2019. PMID: 30893953 Free PMC article. Review.
-
The structural and functional roles of CTCF in the regulation of cell type-specific and human disease-associated super-enhancers.Genes Genomics. 2019 Mar;41(3):257-265. doi: 10.1007/s13258-018-0768-z. Epub 2018 Nov 19. Genes Genomics. 2019. PMID: 30456521 Review.
Cited by
-
Systemic genome-epigenome analysis captures a lineage-specific super-enhancer for MYB in gastrointestinal adenocarcinoma.Mol Syst Biol. 2025 Jun;21(6):696-719. doi: 10.1038/s44320-025-00098-1. Epub 2025 Apr 15. Mol Syst Biol. 2025. PMID: 40234694 Free PMC article.
-
UniBind: maps of high-confidence direct TF-DNA interactions across nine species.BMC Genomics. 2021 Jun 26;22(1):482. doi: 10.1186/s12864-021-07760-6. BMC Genomics. 2021. PMID: 34174819 Free PMC article.
-
In vivo CRISPR screens identify a dual function of MEN1 in regulating tumor-microenvironment interactions.Nat Genet. 2024 Sep;56(9):1890-1902. doi: 10.1038/s41588-024-01874-9. Epub 2024 Sep 3. Nat Genet. 2024. PMID: 39227744 Free PMC article.
-
Chromatin domain alterations linked to 3D genome organization in a large cohort of schizophrenia and bipolar disorder brains.Nat Neurosci. 2022 Apr;25(4):474-483. doi: 10.1038/s41593-022-01032-6. Epub 2022 Mar 24. Nat Neurosci. 2022. PMID: 35332326 Free PMC article.
-
Comprehensive analysis of H3K27me3 LOCKs under different DNA methylation contexts reveal epigenetic redistribution in tumorigenesis.Epigenetics Chromatin. 2025 Jan 20;18(1):6. doi: 10.1186/s13072-025-00570-0. Epigenetics Chromatin. 2025. PMID: 39833880 Free PMC article.
References
Publication types
MeSH terms
Substances
Grants and funding
LinkOut - more resources
Full Text Sources
Other Literature Sources