Randomized Controlled Trial
. 2019 Sep 18;11(510):eaax1880.
doi: 10.1126/scitranslmed.aax1880.

Immune correlates of the Thai RV144 HIV vaccine regimen in South Africa

Affiliations
Randomized Controlled Trial

Immune correlates of the Thai RV144 HIV vaccine regimen in South Africa

Glenda E Gray et al. Sci Transl Med. .

Abstract

One of the most successful HIV vaccines to date, the RV144 vaccine tested in Thailand, demonstrated correlates of protection including cross-clade V1V2 immunoglobulin G (IgG) breadth, Env-specific CD4+ T cell polyfunctionality, and antibody-dependent cellular cytotoxicity (ADCC) in vaccinees with low IgA binding. The HIV Vaccine Trials Network (HVTN) 097 trial evaluated this vaccine regimen in South Africa, where clade C HIV-1 predominates. We compared cellular and humoral responses at peak and durability immunogenicity time points in HVTN 097 and RV144 vaccinee samples, and evaluated vaccine-matched and cross-clade immune responses. At peak immunogenicity, HVTN 097 vaccinees exhibited significantly higher cellular and humoral immune responses than RV144 vaccinees. CD4+ T cell responses were more frequent in HVTN 097 irrespective of age and sex, and CD4+ T cell Env-specific functionality scores were higher in HVTN 097. Env-specific CD40L+ CD4+ T cells were more common in HVTN 097, with individuals having this pattern of expression demonstrating higher median antibody responses to HIV-1 Env. IgG and IgG3 binding antibody rates and response magnitude to gp120 vaccine- and V1V2 vaccine-matched antigens were higher or comparable in HVTN 097 than in RV144 ADCC, and ADCP functional antibody responses were elicited in HVTN 097. Env-specific IgG and CD4+ Env responses declined significantly over time in both trials. Overall, cross-clade immune responses associated with protection were better than expected in South Africa, suggesting wider applicability of this regimen.


Figures

Fig. 1.
Fig. 1.
CONSORT diagram.
Fig. 2.
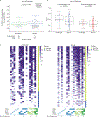
Fig. 2.. T cell responses in vaccinees and placebo recipients in the HVTN 097 and RV144 per-protocol cohorts at the peak immunogenicity timepoint.
T cell responses were measured by intracellular cytokine staining. (A) 92TH023-Env-specific IL-2 and/or IFN-γ CD4+ T cell responses among vaccinees in the HVTN 097 and RV144 per-protocol cohorts. Boxplots are based on positive responders only, with negative responders shown as gray triangles and response rates above the boxes. A response is considered positive if the p-value from a one sided Fisher’s exact test of whether the number of CD4+ T-cells positive for IL-2 and/or IFN-γ is higher in the peptide stimulated samples than in the negative control samples is > 0.00001. Fisher’s exact test p-values comparing response rates (p.rate) and Wilcoxon rank sum test p-values comparing magnitudes (p.mag) among positive responders between HVTN 097 and RV144 vaccine recipients are provided. (B) Functionality and polyfunctionality scores of 92TH023-Env specific CD4+ T cell subsets among vaccinees in the HVTN 097 and RV144 per-protocol cohorts. P-values compare functionality or polyfunctionality scores between HVTN 097 and RV144 vaccinees. (C) Heatmap of COMPASS posterior probabilities for 92TH023-Env specific CD4+ T cell responses among vaccine and placebo recipients in the HVTN 097 and RV144 per-protocol cohorts. White indicates the cytokine subset is not expressed, purple-shaded indicates it is expressed, ordered by degree of functionality. Rows correspond to participants, ordered by treatment group and by functionality score within each group. Each cell shows the probability [ranging from white (zero) to purple (one)] that the corresponding cell-subset (column) demonstrates an antigen-specific response in the corresponding participant (row).
Fig. 3.
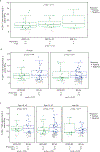
Fig. 3.. IL-2 and/or IFN-γ CD4+ T cell responses to Env among vaccine recipients in the per-protocol cohorts of HVTN 097 and RV144 at the peak immunogenicity timepoint.
(A) Stratified by sex. (B) Stratified by age. (C) Stratified by BMI.
Fig. 4.
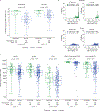
Fig. 4.. IgG binding antibody responses in vaccine recipients to Env gp120 vaccine-insert antigens in the per-protocol cohorts of HVTN 097 and RV144 at the peak immunogenicity timepoint.
IgG binding antibody multiplex assay (BAMA) responses to Env gp120 vaccine-insert antigens (92TH023.AE and A244.AE) at the 1:50 dilution among vaccine recipients in the per-protocol cohorts of HVTN 097 and RV144 two weeks after the second ALVAC/AIDSVAX vaccination are shown by boxplot (A) and histogram (B). The net response magnitude (MFI-blank) is background-subtracted mean fluorescent intensity (MFI), where background refers to a plate level control (i.e., a blank well run on each plate). A post-enrollment sample is considered to be positive if the net magnitude is ≥ an antigen-specific cutoff, the net magnitude is > 3 times the baseline net magnitude, and the MFI is > 3 times the baseline MFI. Fisher’s exact test p-values comparing response rates (p.rate) and Wilcoxon rank sum test p-values comparing magnitudes (p.mag) among positive responders between HVTN 097 and RV144 vaccine recipients are provided in (A). Geometric mean IgG binding antibody responses among vaccine recipients in the per-protocol cohorts of HVTN 097 and RV144 at the peak immunogenicity timepoint (C). Fisher’s exact test p-values comparing response rates (p.rate) and Wilcoxon rank sum test p-values comparing magnitudes (p.mag) among positive responders between HVTN 097 and RV144 vaccine recipients are provided. Boxplots are based on positive responders only represented by the green and blue circles for HVTN 097 and RV144, respectively; negative responders are shown as gray triangles.
Fig. 5.
Fig. 5.. IgG and IgG3 binding antibody responses to V1V2 antigens and magnitude-breadth plot of IgG binding antibody responses to clade C V1V2 antigens among vaccine recipients in the per-protocol cohorts of HVTN 097 and RV144 at the peak immunogenicity timepoint.
(A) IgG binding antibody responses to V1V2 antigens among vaccine recipients in the per-protocol cohorts of HVTN 097 and RV144 two weeks after the second ALVAC/AIDSVAX vaccination. (B) Magnitude-breadth plot of IgG binding antibody responses to clade C V1V2 antigens among vaccine recipients in the per-protocol cohorts of HVTN 097 and RV144 two weeks after the second ALVAC/AIDSVAX vaccination. Solid curves are average breadth across individuals for HVTN 097 and RV144 vaccine recipients with breadth defined by the proportion of antigens in the panel with log10 (MFI – blank) greater than the threshold on the x-axis. Clade C V1V2 antigens = gp70–001428_2_42 V1V2.C, gp70–7060101641 V1V2.C, gp70–96ZM651_02 V1v2.C, gp70-BF1266_431a_V1V2.C, gp70-CAP210_2_00_E8 V1V2.C, gp70-TV1_21 V1V2.C. (C) Binding to peptides in V1V2 region of 3 vaccine strains. Magnitude of binding to overlapping peptides in V1V2 region of vaccine strains by serum IgG at two weeks after the second ALVAC/AIDSVAX vaccination. Thin lines represent individual participants. Thick lines represent weighted means. (D) IgG3 binding antibody responses to V1V2 antigens among vaccine recipients in the per-protocol cohorts of HVTN 097 and RV144 two weeks after the second ALVAC/AIDSVAX vaccination. Boxplots are based on positive responders only with negative responders shown as gray triangles with positive response rates above the boxes. Fisher’s exact test p-values comparing response rates (p.rate) and Wilcoxon rank sum test p-values comparing magnitudes (p.mag) among positive responders between HVTN 097 and RV144 vaccine recipients are provided.
Fig. 6.
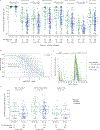
Fig. 6.. Antibody responses in vaccine recipients in HVTN 097 and RV144.
(A) ADCC responses were evaluated against subtype AE 92TH023_gD-neg and A244_gD-neg recombinant gp120-coated CEM.NKRCCR5 target cells for the HVTN 097 (n=73) and RV144 (n=195) samples collected at the peak immunogenicity timepoint (two weeks after the second ALVAC/AIDSVAX vaccination), as indicated on the x-axis. PBMC from one normal healthy HIV seronegative donor were used as source of effector cells. The y-axis represents the values of the area under the curve (AUC) to represent the magnitude of responses. Boxplots are based on positive responders only represented by the green and blue circles for HVTN 097 and RV144, respectively; negative responders are shown as gray triangles. Response rates and number of responders over total are reported above each group boxplot. P-value comparing response rates among positive responders between HVTN 097 and RV144 vaccine recipients is provided. (B) IgG-mediated ADCP was tested at study baseline and two weeks after the second ALVAC/AIDSVAX vaccination for a subset of per-protocol participants, with 63 vaccine recipients (46 in Group T1 and 17 in Group T2) and 5 placebo recipients. ADCP score using the human THP-1 cell line is shown. (C) Neutralizing antibody responses (magnitude-breadth curves) to tier 1 viruses among vaccine recipients in the per-protocol cohorts of HVTN 097 and RV144 two weeks after the second ALVAC/AIDSVAX vaccination. Solid curves are average breadth across individuals for HVTN 097 and RV144 vaccine recipients with breadth defined by the proportion of antigens in the panel with log10 ID50 titer greater than the threshold on the x-axis.
Fig. 7.
Fig. 7.. Association between percent of CD4+ T cells expressing CD40L reactive to HIV-1 envelope vaccine strain 92TH023 and binding antibodies at the peak immunogenicity timepoint.
(A) IgG responses to A244.AE gp120. (B) IgG3 response to A244.AE gp120. (C) IgG response (AUC) to clade C V1V2 panel. (D) IgG3 response (AUC) to clade C V1V2 panel. X-axis is percent of CD4+ T cells expressing CD40L to 92TH023-ENV, and a histogram of that distribution is shown in green. Along the y-axis a histogram of the corresponding y-variable is shown in red.
Fig. 8.
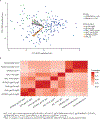
Fig. 8.. Multi-assay principal components analysis (PCA).
(A) Biplot and (B) Spearman correlation heatmap for vaccine recipients in the per-protocol cohorts of HVTN 097 and RV144 at the peak immunogenicity timepoint (two weeks post second ALVAC/AIDSVAX vaccination). In Panel A, the x-axis is the value from the first principal component and the y-axis is the second principal component, where each axis label includes the percentage of variation in the total set of readouts captured by the principal component. Points on the plot represent the values of the principal components of each observation. Points that are close together correspond to observations that have similar values on the components displayed in the plot. The top axis is the first principal component loadings and the right axis is the second principal component loadings, where loadings are the weights by which each original immunogenicity endpoint score should be multiplied to get the value of the first or second principal component. An arrow (vector) is drawn for each immunogenicity endpoint from the origin to the point defined by its first two principal component loadings. Vectors that point in the same direction correspond to endpoints that have similar response profiles on the basis of the first two PCs. The observations whose points project furthest in the direction in which the vector points are the observations that have the most weight of whatever the endpoint measures. Those points t hat project at the other end have the least weight of whatever the endpoint measures. The angle between two arrows conveys information about the correlation of the two endpoint scores, with a zero degree angle denoting perfect correlation and a 90 degree angle denoting no correlation. In the legend of panel A: gp120_IgG3 stands for 92TH023_gp120_IgG3 and A244_gp120_IgG3; gp120_IgG stands for 92TH023_gp120_IgG and A244_gp120_IgG; PFS(FS) stands for Polyfunctionality score (Functionality score).

References

    1. UNAIDS, “Global AIDS Update,” (2016).
    1. Rerks-Ngarm S, Pitisuttithum P, Nitayaphan S, Kaewkungwal J, Chiu J, Paris R, Premsri N, Namwat C, de Souza M, Adams E, Benenson M, Gurunathan S, Tartaglia J, McNeil JG, Francis DP, Stablein D, Birx DL, Chunsuttiwat S, Khamboonruang C, Thongcharoen P, Robb ML, Michael NL, Kunasol P, Kim JH, Investigators M-T, Vaccination with ALVAC and AIDSVAX to prevent HIV-1 infection in Thailand. N Engl J Med 361, 2209–2220 (2009). - PubMed
    1. Robb ML, Rerks-Ngarm S, Nitayaphan S, Pitisuttithum P, Kaewkungwal J, Kunasol P, Khamboonruang C, Thongcharoen P, Morgan P, Benenson M, Paris RM, Chiu J, Adams E, Francis D, Gurunathan S, Tartaglia J, Gilbert P, Stablein D, Michael NL, Kim JH, Risk behaviour and time as covariates for efficacy of the HIV vaccine regimen ALVAC-HIV (vCP1521) and AIDSVAX B/E: a post-hoc analysis of the Thai phase 3 efficacy trial RV 144. Lancet Infect Dis 12, 531–537 (2012). - PMC - PubMed
    1. Haynes BF, Gilbert PB, McElrath MJ, Zolla-Pazner S, Tomaras GD, Alam SM, Evans DT, Montefiori DC, Karnasuta C, Sutthent R, Liao HX, DeVico AL, Lewis GK, Williams C, Pinter A, Fong Y, Janes H, DeCamp A, Huang Y, Rao M, Billings E, Karasavvas N, Robb ML, Ngauy V, de Souza MS, Paris R, Ferrari G, Bailer RT, Soderberg KA, Andrews C, Berman PW, Frahm N, De Rosa SC, Alpert MD, Yates NL, Shen X, Koup RA, Pitisuttithum P, Kaewkungwal J, Nitayaphan S, Rerks-Ngarm S, Michael NL, Kim JH, Immune-correlates analysis of an HIV-1 vaccine efficacy trial. N Engl J Med 366, 1275–1286 (2012). - PMC - PubMed
    1. Gottardo R, Bailer RT, Korber BT, Gnanakaran S, Phillips J, Shen X, Tomaras GD, Turk E, Imholte G, Eckler L, Wenschuh H, Zerweck J, Greene K, Gao H, Berman PW, Francis D, Sinangil F, Lee C, Nitayaphan S, Rerks-Ngarm S, Kaewkungwal J, Pitisuttithum P, Tartaglia J, Robb ML, Michael NL, Kim JH, Zolla-Pazner S, Haynes BF, Mascola JR, Self S, Gilbert P, Montefiori DC, Plasma IgG to linear epitopes in the V2 and V3 regions of HIV-1 gp120 correlate with a reduced risk of infection in the RV144 vaccine efficacy trial. PLoS One 8, e75665 (2013). - PMC - PubMed

Publication types

MeSH terms