

Temporal changes in transcriptome profile provide insights of White Spot Syndrome Virus infection in Litopenaeus vannamei
- PMID: 31534145
- PMCID: PMC6751192
- DOI: 10.1038/s41598-019-49836-0
Temporal changes in transcriptome profile provide insights of White Spot Syndrome Virus infection in Litopenaeus vannamei
Abstract
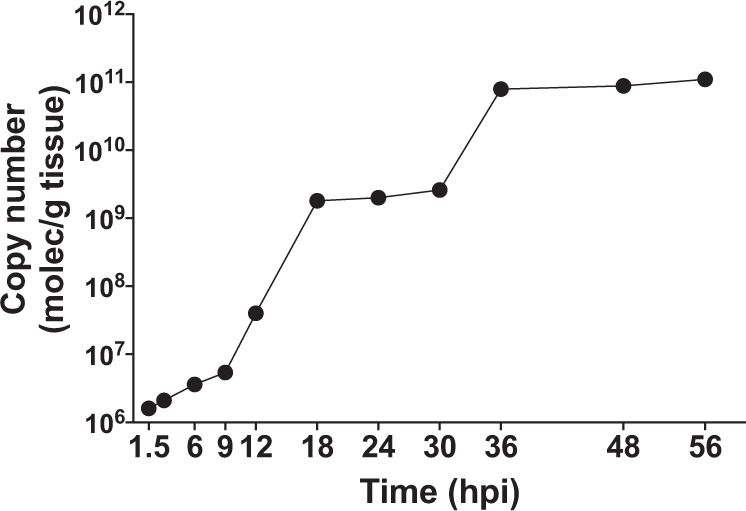
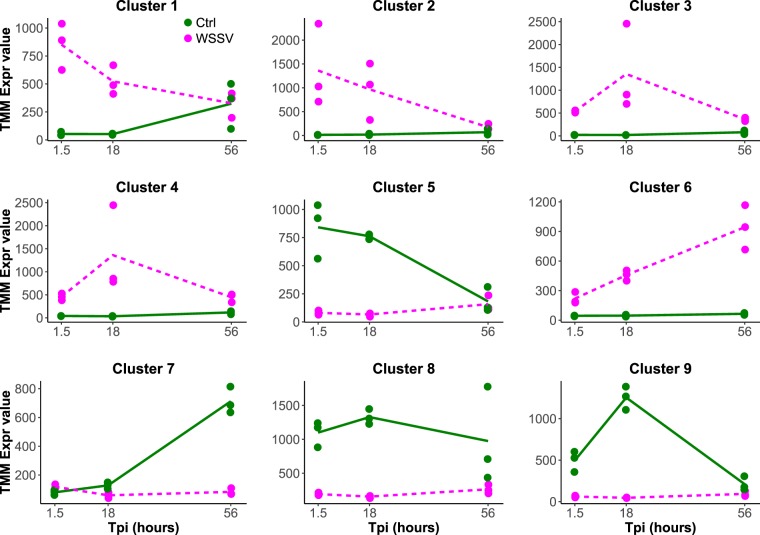
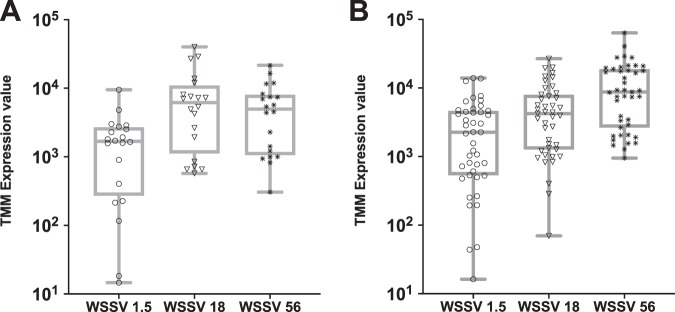
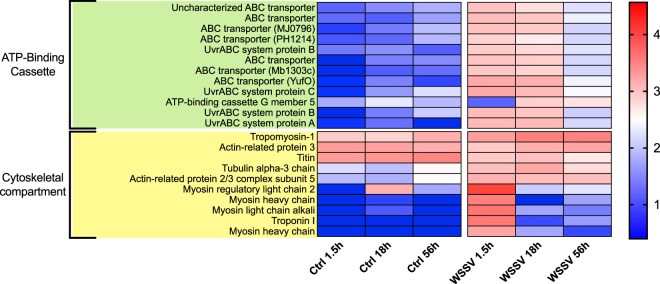
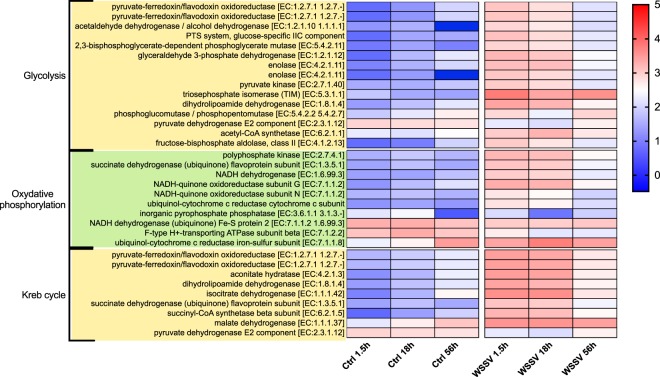
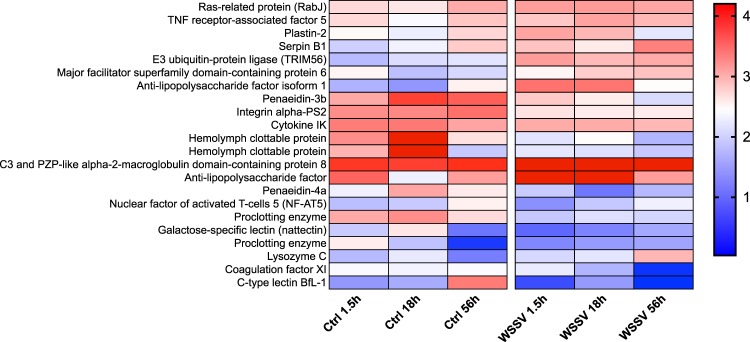
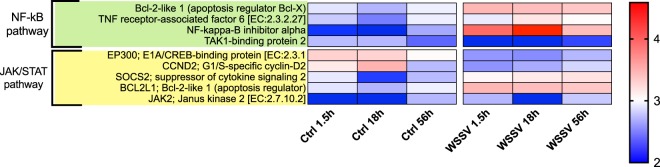
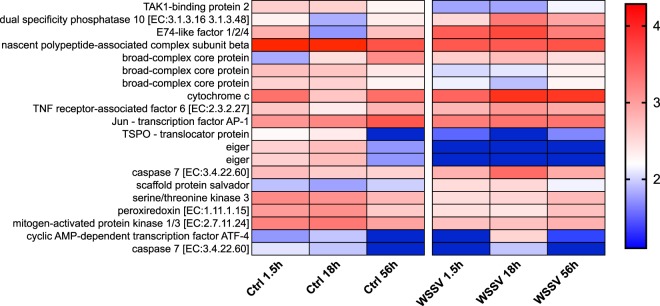
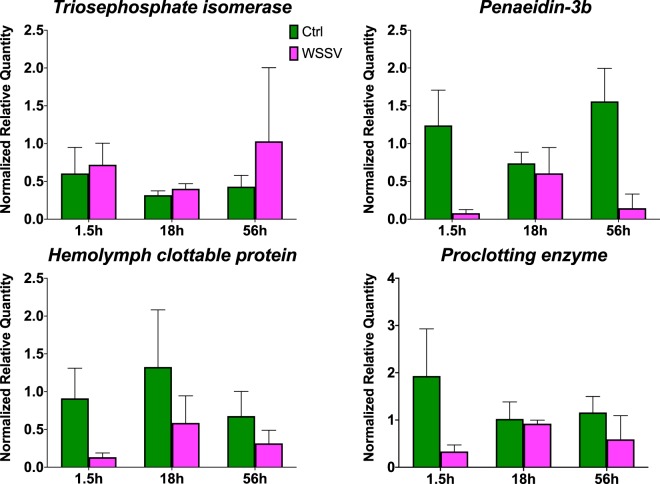
Shrimp aquaculture is severely affected by WSSV. Despite an increasing effort to understand host/virus interaction by characterizing changes in gene expression (GE) following WSSV infection, the majority of published studies have focussed on a single time-point, providing limited insight on the development of host-pathogen interaction over the infection cycle. Using RNA-seq, we contrasted GE in gills of Litopenaeus vannamei at 1.5, 18 and 56 hours-post-infection (hpi), between WSSV-challenged and control shrimps. Time course analysis revealed 5097 differentially expressed genes: 63 DEGs were viral genes and their expression in WSSV group either peaked at 18 hpi (and decreased at 56 hpi) or increased linearly up to 56 hpi, suggesting a different role played by these genes during the course of infection. The remaining DEGs showed that WSSV altered the expression of metabolic, immune, apoptotic and cytoskeletal genes and was able to inhibit NF-κB and JAK/STAT pathways. Interestingly, GE changes were not consistent through the course of infection but were dynamic with time, suggesting the complexity of host-pathogen interaction. These data offer novel insights into the cellular functions that are affected during the course of infection and ultimately provide a valuable resource towards our understanding of the host-pathogen dynamics and its variation with time.
Conflict of interest statement
The authors declare no competing interests.
Figures
Similar articles
-
Alginate from Sargassum siliquosum Simultaneously Stimulates Innate Immunity, Upregulates Immune Genes, and Enhances Resistance of Pacific White Shrimp (Litopenaeus vannamei) Against White Spot Syndrome Virus (WSSV).Mar Biotechnol (NY). 2019 Aug;21(4):503-514. doi: 10.1007/s10126-019-09898-7. Epub 2019 May 21. Mar Biotechnol (NY). 2019. PMID: 31111339
-
A comparative synthesis of transcriptomic analyses reveals major differences between WSSV-susceptible Litopenaeus vannamei and WSSV-refractory Macrobrachium rosenbergii.Dev Comp Immunol. 2020 Mar;104:103564. doi: 10.1016/j.dci.2019.103564. Epub 2019 Dec 6. Dev Comp Immunol. 2020. PMID: 31816330
-
Sequencing and de novo analysis of the hemocytes transcriptome in Litopenaeus vannamei response to white spot syndrome virus infection.PLoS One. 2013 Oct 18;8(10):e76718. doi: 10.1371/journal.pone.0076718. eCollection 2013. PLoS One. 2013. PMID: 24204661 Free PMC article.
-
Insights into the molecular basis of immunosuppression and increasing pathogen infection severity of ammonia toxicity by transcriptome analysis in pacific white shrimp Litopenaeus vannamei.Fish Shellfish Immunol. 2019 May;88:528-539. doi: 10.1016/j.fsi.2019.03.026. Epub 2019 Mar 16. Fish Shellfish Immunol. 2019. PMID: 30885745
-
Recent insights into host-pathogen interaction in white spot syndrome virus infected penaeid shrimp.J Fish Dis. 2015 Jul;38(7):599-612. doi: 10.1111/jfd.12279. Epub 2014 Jun 23. J Fish Dis. 2015. PMID: 24953507 Review.
Cited by
-
Investigation of Pathogenic Mechanism of Covert Mortality Nodavirus Infection in Penaeus vannamei.Front Microbiol. 2022 May 31;13:904358. doi: 10.3389/fmicb.2022.904358. eCollection 2022. Front Microbiol. 2022. PMID: 35711775 Free PMC article.
-
Microbes and pathogens associated with shrimps - implications and review of possible control strategies.Front Mar Sci. 2024;11:1397708. doi: 10.3389/fmars.2024.1397708. Epub 2024 Oct 6. Front Mar Sci. 2024. PMID: 39498300 Free PMC article.
-
Variation in Shrimp Allergens: Place of Origin Effects on Food Safety Assessment.Int J Mol Sci. 2024 Apr 20;25(8):4531. doi: 10.3390/ijms25084531. Int J Mol Sci. 2024. PMID: 38674116 Free PMC article.
-
Evaluation of the relationship between the 14-3-3ε protein and LvRab11 in the shrimp Litopenaeus vannamei during WSSV infection.Sci Rep. 2021 Sep 28;11(1):19188. doi: 10.1038/s41598-021-97828-w. Sci Rep. 2021. PMID: 34584112 Free PMC article.
-
Resistance to white spot syndrome virus in the European shore crab is associated with suppressed virion trafficking and heightened immune responses.Front Immunol. 2022 Dec 27;13:1057421. doi: 10.3389/fimmu.2022.1057421. eCollection 2022. Front Immunol. 2022. PMID: 36636327 Free PMC article.
References
-
- Chandrakala, N. & Priya, S. Vibriosis in Shrimp Aquaculture A Review. IJSRSET (2017).
-
- Stentiford GD, Bonami JR, Alday-Sanz V. A critical review of susceptibility of crustaceans to Taura syndrome, Yellowhead disease and White Spot Disease and implications of inclusion of these diseases in European legislation. Aquaculture. 2009;291:1–17. doi: 10.1016/j.aquaculture.2009.02.042. - DOI
Publication types
MeSH terms
Grants and funding
LinkOut - more resources
Full Text Sources
