. 2019 Sep 18;9(1):13519.
doi: 10.1038/s41598-019-50077-4.

Improved Dynamic Light Scattering using an adaptive and statistically driven time resolved treatment of correlation data

Affiliations

Improved Dynamic Light Scattering using an adaptive and statistically driven time resolved treatment of correlation data

Alexander V Malm et al. Sci Rep. .

Erratum in

Abstract

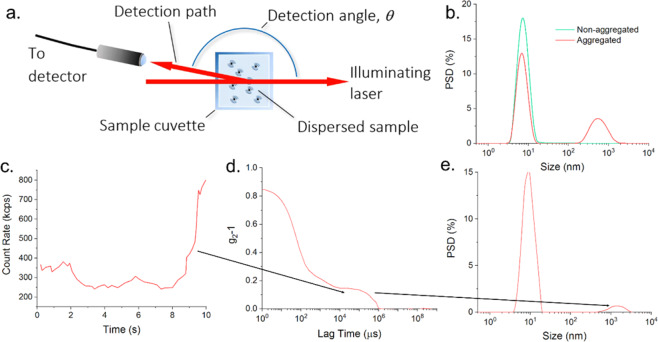
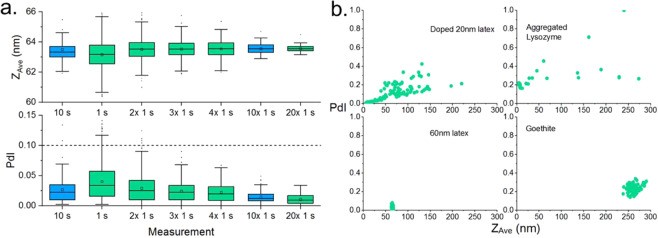
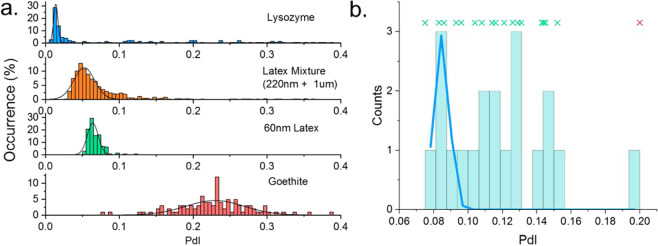
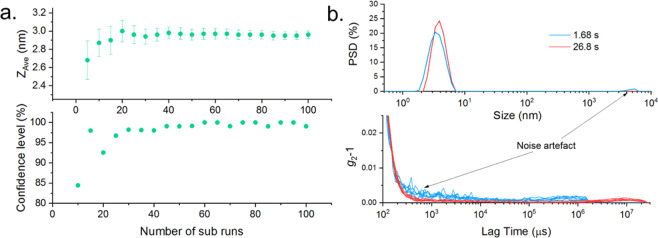
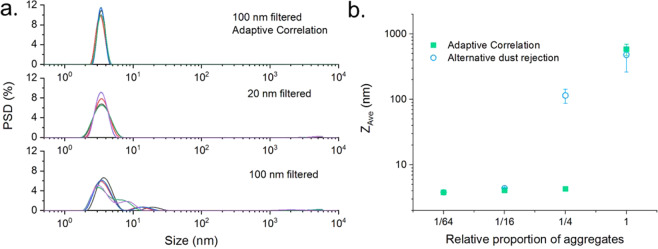
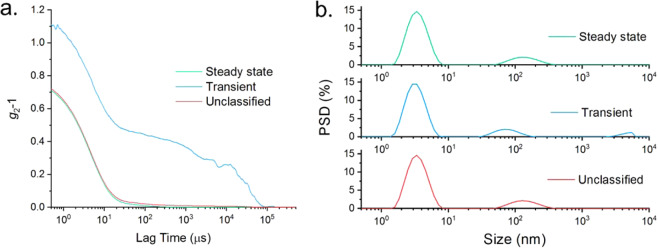
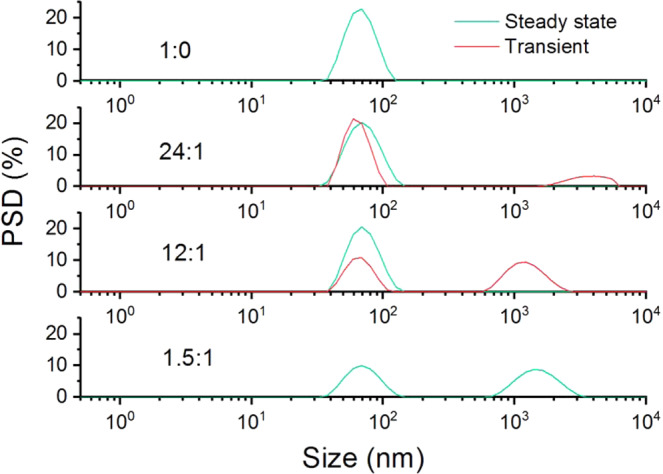
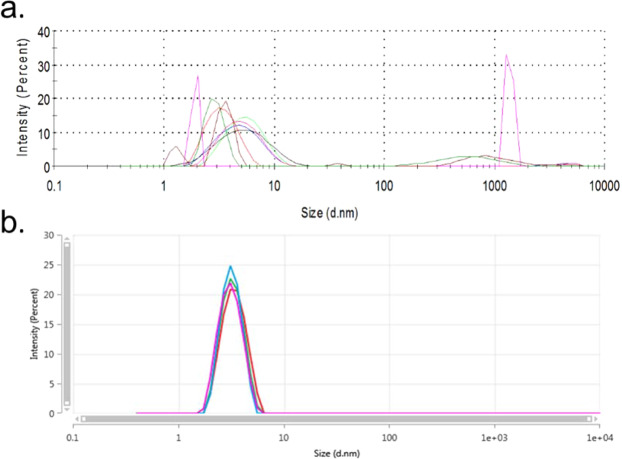
Dynamic Light Scattering (DLS) is a ubiquitous and non-invasive measurement for the characterization of nano- and micro-scale particles in dispersion. The sixth power relationship between scattered intensity and particle radius is simultaneously a primary advantage whilst rendering the technique sensitive to unwanted size fractions from unclean lab-ware, dust and aggregated & dynamically aggregating sample, for example. This can make sample preparation iterative, challenging and time consuming and often requires the use of data filtering methods that leave an inaccurate estimate of the steady state size fraction and may provide no knowledge to the user of the presence of the transient fractions. A revolutionary new approach to DLS measurement and data analysis is presented whereby the statistical variance of a series of individually analysed, extremely short sub-measurements is used to classify data as steady-state or transient. Crucially, all sub-measurements are reported, and no data are rejected, providing a precise and accurate measurement of both the steady state and transient size fractions. We demonstrate that this approach deals intrinsically and seamlessly with the transition from a stable dispersion to the partially- and fully-aggregated cases and results in an attendant improvement in DLS precision due to the shorter sub measurement length and the classification process used.


Conflict of interest statement

The authors declare no competing interests.

Figures

Figure 1
Figure 1
(a) Schematic of a typical DLS instrument, configured to detect backscattered light from the dispersed sample. (b) Replicate time averaged particle size distributions for a protein sample, showing the intermittent appearance of a large size component which also coincides with a perturbation to the position of the primary peak. (ce) Analysis process of a DLS measurement- Light scattering intensity (c) showing a spike in the signal due to the appearance of an aggregate at t > 8 s, which can which can degrade the measured correlation function (g2-1) (d) and the accuracy of the intensity weighted particle size distribution (e).
Figure 2
Figure 2
(a) Distribution of ZAve and PdI as a function of sub measurement duration and number of sub measurements. All recorded data are shown. i.e. no data were de-selected for this figure: See main text for discussion. The dashed line shows the ISO standard for polydispersity index. (b) Examples of polydispersity index, PdI, as a function of ZAve for samples containing trace amounts of additional large material (top), (see supplementary information) and stable, well-prepared samples (bottom).
Figure 3
Figure 3
(a) Distributions of PdI for a range of aggregated/contaminated samples, demonstrating the need for a sample specific definition to identify the measurement of transient particles. These distributions also show that the PdI is a biased distribution, and as such, a three standard-deviations from the mean threshold for outliers would not be robust. (b) Histogram of a sparsely collected set of measurements for a sample of lysozyme. Whilst fitting using a least squares regression and a Gaussian model in (a) reliably allowed the statistics of sufficiently sampled data sets to be determined, an attempt to fit to a sparse data set is shown in blue but shows poor correlation with the distribution data due to apparent under sampling. Also shown is a scatter plot of the individual values showing their spread. The individual point show in red is successfully identified as an outlier by the Rosner generalised many outlier procedure.
Figure 4
Figure 4
(a) Top: The reported ZAve against the number of measured sub measurements during the measurement of a sample of lysozyme. An estimate of the standard error on each reported size is shown by error bars. The result is initially inaccurate and variable but stabilises after a sufficient amount of data is gathered. Bottom: Confidence level (CL) of a hypothesis test of data similarity, calculated for successive values shown for the ZAve. When the confidence level has reached a threshold, no resolvable difference in ZAve is expected and recording of additional sub measurements can therefore end. (b) Top: Intensity weighted particle size distribution for measurements of 1 mg/mL lysozyme using short and long correlation times measured at a 90° detection angle. The short sub measurements show an apparent large size component which is a noise artefact associated with the low scattering intensity of the sample. Bottom: Corresponding correlation function baselines for repeat measurements using long and short sub measurements. The short sub measurements show a temporally resolved, additional decay artefact.
Figure 5
Figure 5
(a) Intensity weighted particle size distributions for a 5 mg/mL dispersion of lysozyme. The top figure was generated using Adaptive Correlation, with an aliquot filtered using a 100 nm filter. The middle and bottom figures show results using a legacy method, with the sample filtered using a 20 nm and 100 nm filter respectively. (b) Reported ZAve for measurements of the size of lysozyme, following different filtering processes. Results are shown for Adaptive Correlation and a previously used dust rejection technique. A sharp inflection in the data is seen as the average size becomes dominated by the presence of a small mass of larger aggregate particles.
Figure 6
Figure 6
(a) Autocorrelation functions for the steady state, transient and unclassified data for a measurement of 5 mg/mL dispersion of lysozyme. The unclassified and steady state data appear closely comparable, but analysis of the transient data gives insight to the presence of trace large particles. (b) Intensity weighted particle size distributions for an aggregated sample of 5 mg/mL lysozyme, calculated independently for the steady state, transient and unclassified data sets. In all instances, a monomer and aggregate peak are observed at 3.8 and ~100 nm, however the transient data also shows an additional large size peak.
Figure 7
Figure 7
Intensity weighted particle size distributions for polystyrene latex mixtures, containing 60 nm latex and 1.6 µm latex at different volume ratios, measured at a 90° scattering angle. With increasing concentration of the large size component, a transition is seen between this not being detected, appearing in only the transient data and then in the steady state.
Figure 8
Figure 8
Software reported steady state intensity weighted particle size distributions measured for a thermally agitated 1 mg/ml dispersion of lysozyme, showing results for replicate measurements of the same aliquot of sample, measured using a traditional ‘dust rejection’ measurement process (a) and Adaptive Correlation (b). Replicate measurements in the top figure show highly variable results with broad peaks observed at a range of mode sizes due to skewing caused by trace amounts of aggregate material, whereas the same sample measured using Adaptive Correlation is significantly more precise and accurate.

References

    1. Berne, B. & Pecora, R. Dynamic Light Scattering, Courier Dover Publications (2000).
    1. Pike, E. & Abbiss, J. Light scattering and photon correlation spectroscopy, Springer (1997).
    1. Kaszuba M, McKnight D, Connah M, McNeil-Watson F, Nobbmann U. Measuring sub nanometre sizes using dynamic light scattering. Journal of Nanoparticle Research. 2008;10:823–829. doi: 10.1007/s11051-007-9317-4. - DOI
    1. Fissan H, Ristig S, Kaminski H, Asbach C, Epple M. Comparison of different characterization methods for nanoparticle dispersions before and after aerosolization. Analytical Methods. 2014;6:7324–7334. doi: 10.1039/C4AY01203H. - DOI
    1. Bauer K, Göbel M, Schwab M, Schermeyer M, Hubbuch J. Concentration-dependent changes in apparent diffusion coefficients as indicator for colloidal stability of protein solutions. Int. J. Pharm. 2016;511:276–287. doi: 10.1016/j.ijpharm.2016.07.007. - DOI - PubMed