. 2019 Sep;573(7775):595-599.
doi: 10.1038/s41586-019-1577-5. Epub 2019 Sep 18.

α-Ketoglutarate links p53 to cell fate during tumour suppression

Affiliations

α-Ketoglutarate links p53 to cell fate during tumour suppression

John P Morris 4th et al. Nature. 2019 Sep.

Abstract

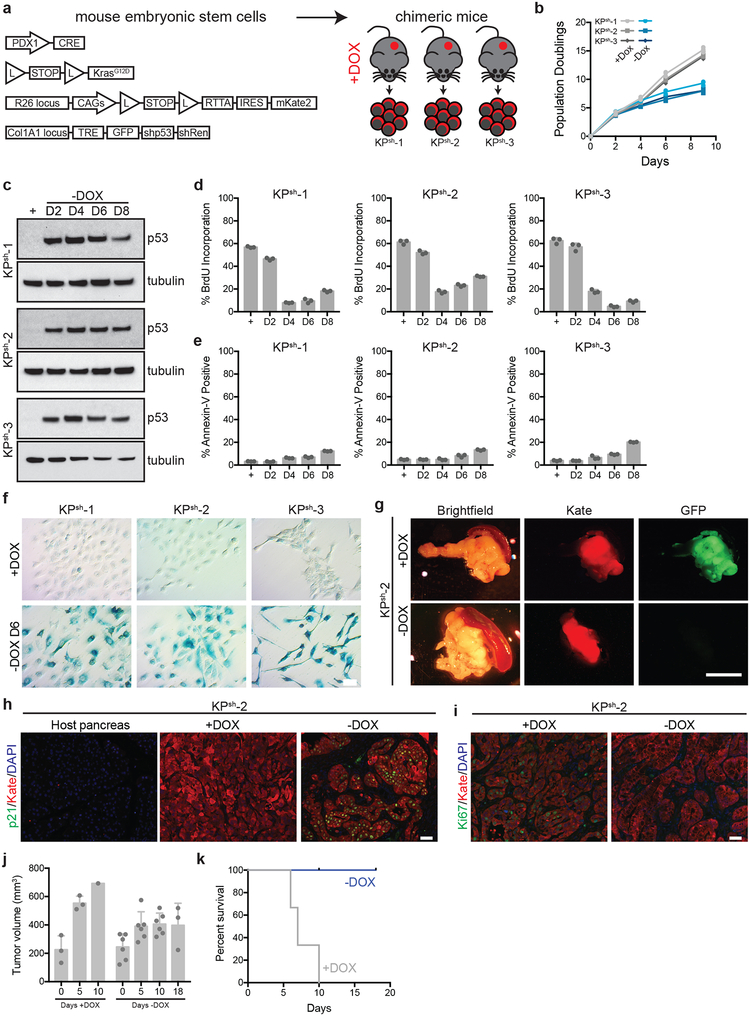
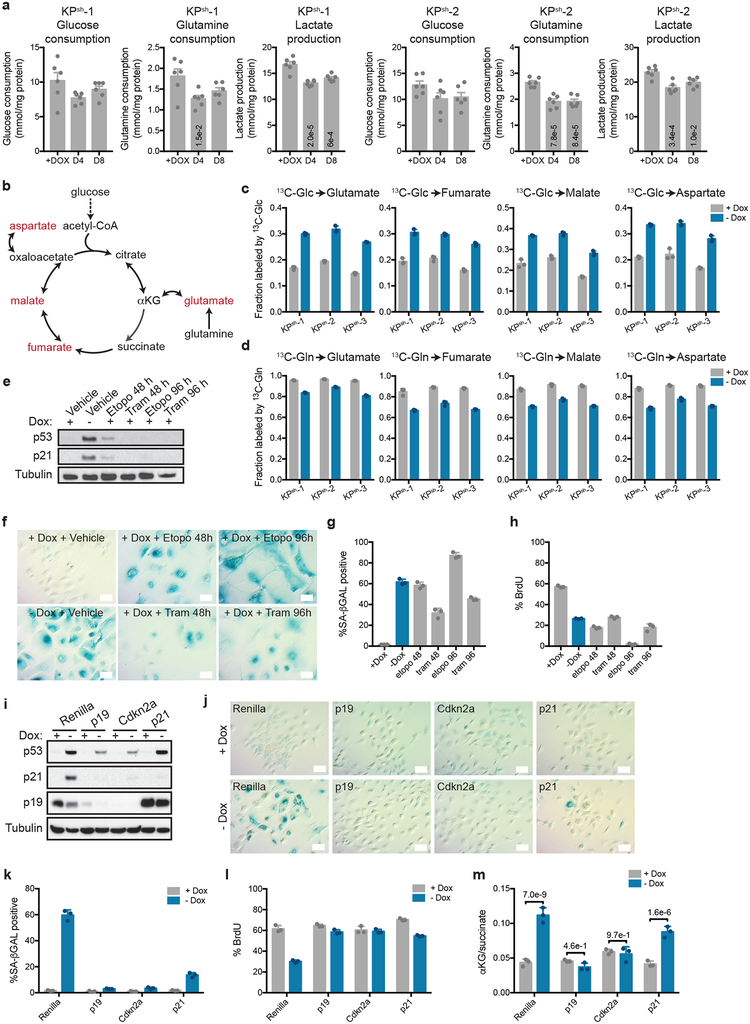
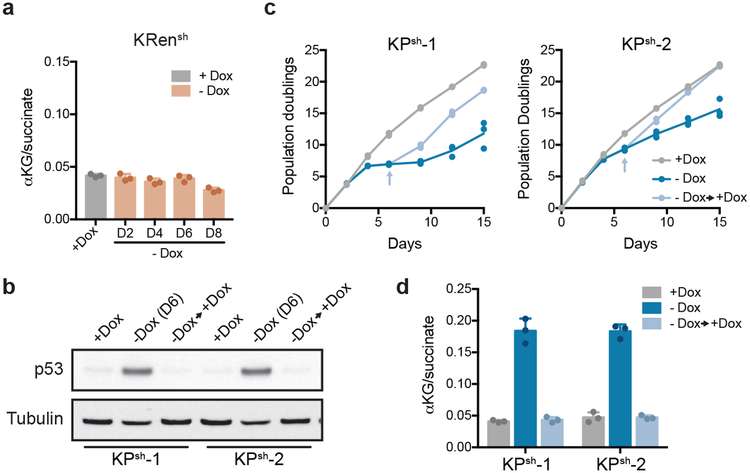
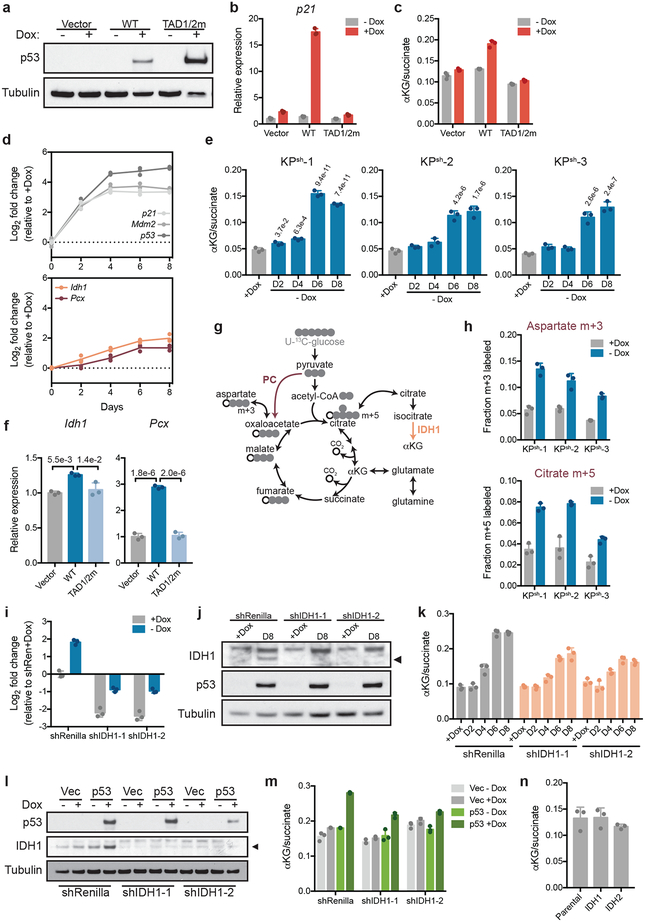
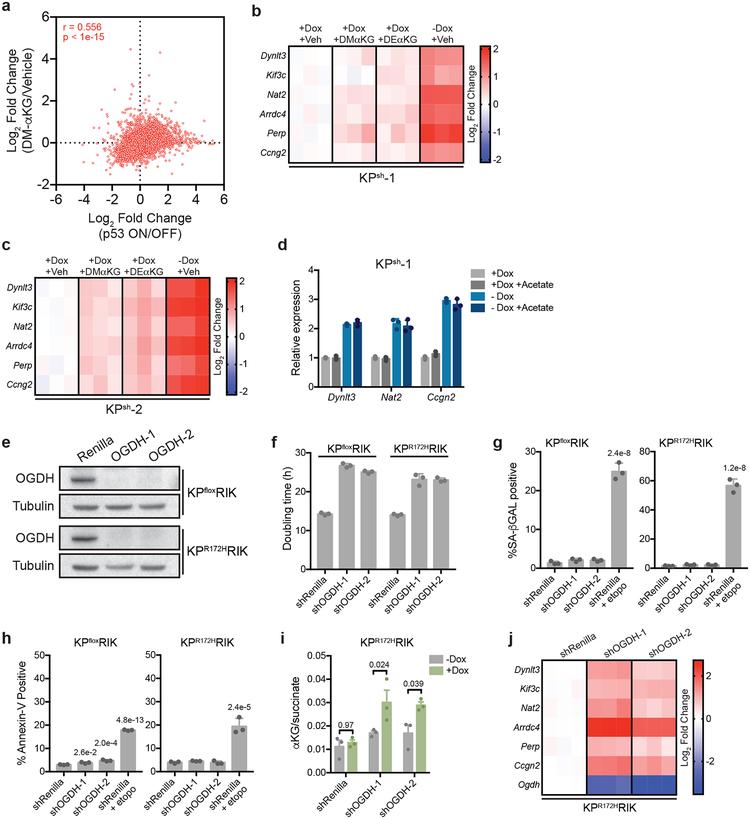
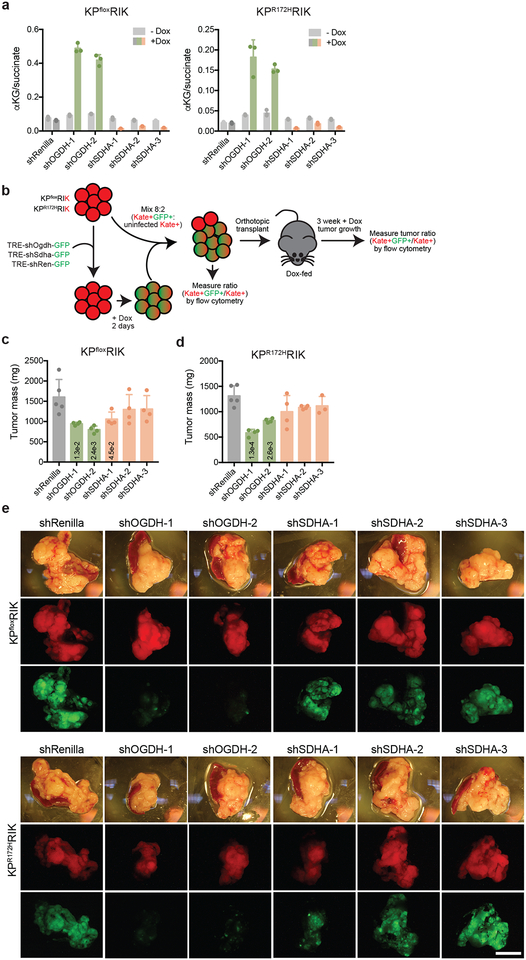
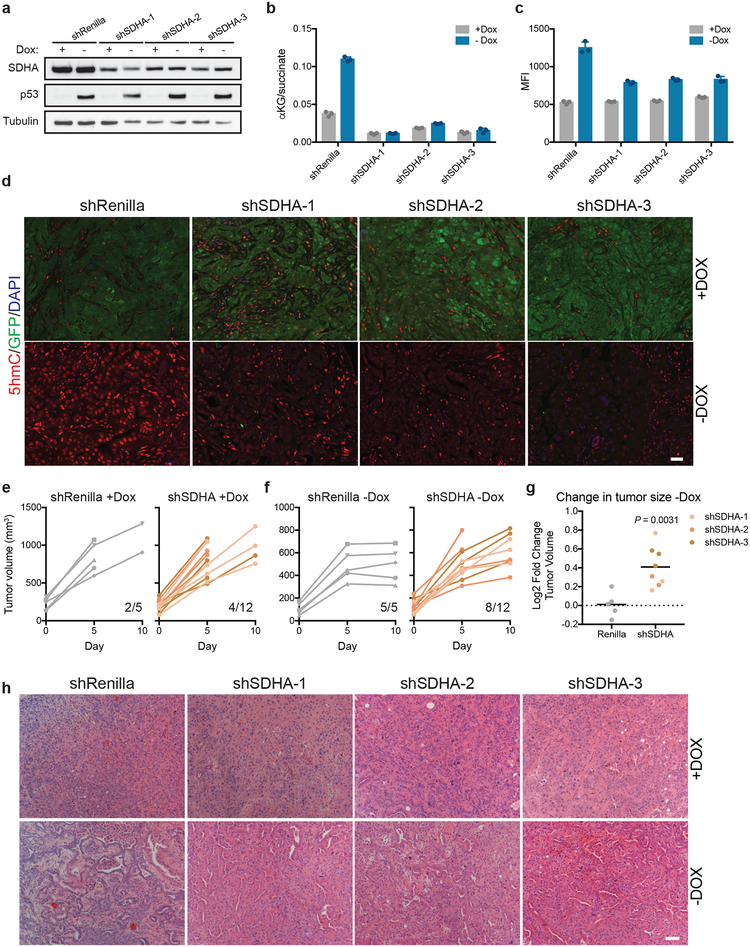
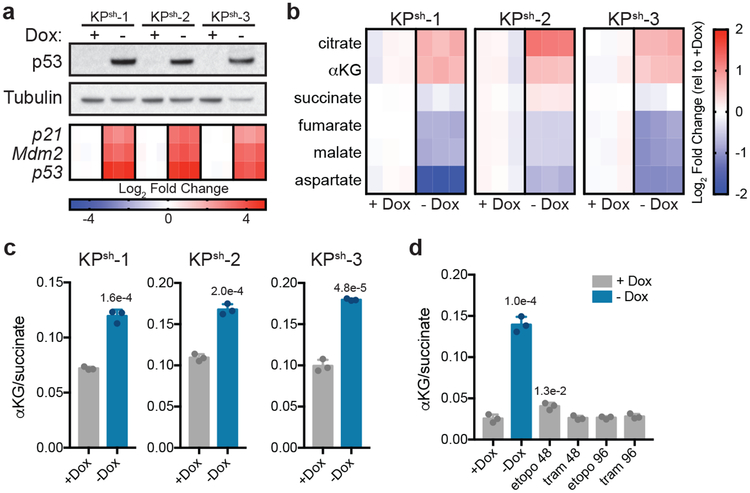
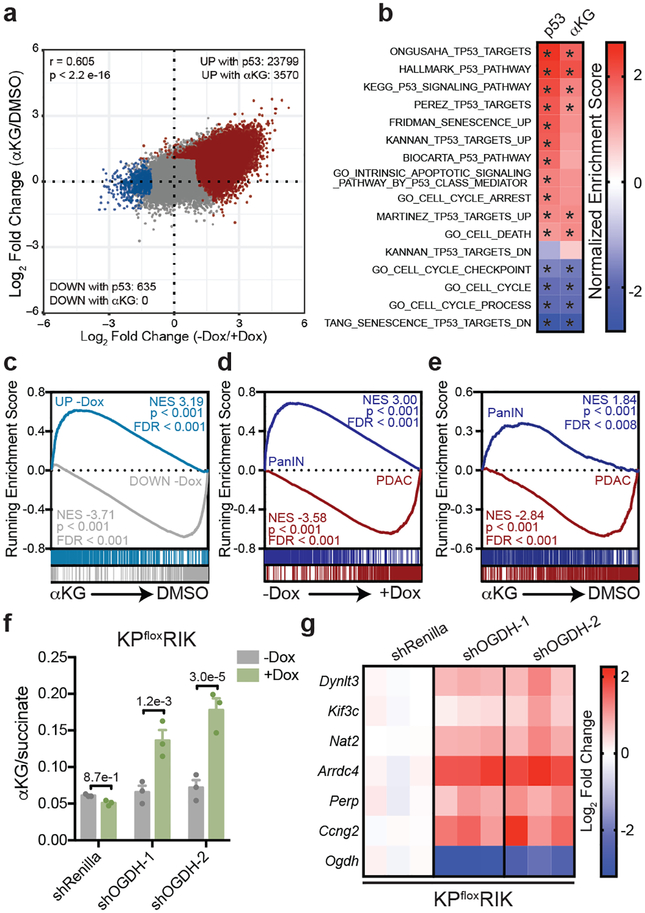
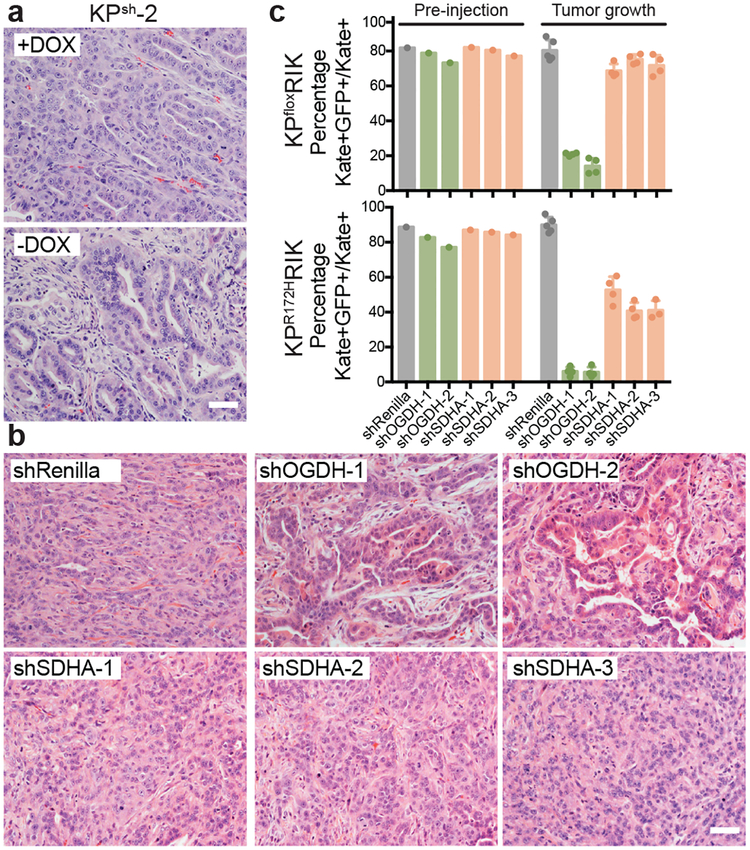
The tumour suppressor TP53 is mutated in the majority of human cancers, and in over 70% of pancreatic ductal adenocarcinoma (PDAC)1,2. Wild-type p53 accumulates in response to cellular stress, and regulates gene expression to alter cell fate and prevent tumour development2. Wild-type p53 is also known to modulate cellular metabolic pathways3, although p53-dependent metabolic alterations that constrain cancer progression remain poorly understood. Here we find that p53 remodels cancer-cell metabolism to enforce changes in chromatin and gene expression that favour a premalignant cell fate. Restoring p53 function in cancer cells derived from KRAS-mutant mouse models of PDAC leads to the accumulation of α-ketoglutarate (αKG, also known as 2-oxoglutarate), a metabolite that also serves as an obligate substrate for a subset of chromatin-modifying enzymes. p53 induces transcriptional programs that are characteristic of premalignant differentiation, and this effect can be partially recapitulated by the addition of cell-permeable αKG. Increased levels of the αKG-dependent chromatin modification 5-hydroxymethylcytosine (5hmC) accompany the tumour-cell differentiation that is triggered by p53, whereas decreased 5hmC characterizes the transition from premalignant to de-differentiated malignant lesions that is associated with mutations in Trp53. Enforcing the accumulation of αKG in p53-deficient PDAC cells through the inhibition of oxoglutarate dehydrogenase-an enzyme of the tricarboxylic acid cycle-specifically results in increased 5hmC, tumour-cell differentiation and decreased tumour-cell fitness. Conversely, increasing the intracellular levels of succinate (a competitive inhibitor of αKG-dependent dioxygenases) blunts p53-driven tumour suppression. These data suggest that αKG is an effector of p53-mediated tumour suppression, and that the accumulation of αKG in p53-deficient tumours can drive tumour-cell differentiation and antagonize malignant progression.


Conflict of interest statement

Competing interests. S.W.L. is a founder and scientific advisory board member of Blueprint Medicines, Mirimus Inc., and ORIC pharmaceuticals, and on the scientific advisory board of Constellation Pharmaceuticals, Petra Pharmaceuticals, and PMV Pharmaceuticals. C.B.T. is a founder of Agios Pharmaceuticals and a member of its scientific advisory board. He also previously served on the board of directors of Merck and Charles River Laboratories.

Figures

Extended Data Figure 1.
Extended Data Figure 1.. KPsh ESC-GEMM PDAC model driven by mutant Kras and inducible and reversible p53 silencing.
a, KPsh embryonic stem cell-based genetically engineered mouse model (ESC-GEMM) of pancreatic ductal adenocarcinoma (PDAC). Embryonic stem cells express Pdx1-Cre (transgenic expression of Cre in pancreatic progenitors); LSL-KrasG12D (knock-in, conditional heterozygous expression of mutant Kras); RIK (knock in, conditional heterozygous expression of rtTA and fluorescent mKate2 from the Rosa26 locus); Col1a1-TRE-GFP-shp53-shRenilla (Col1a1 homing cassette (CHC) targeted with doxycycline inducible tandem shRNA expressing shp53 and shRenilla linked to GFP). KPsh mice were generated by blastocyst injection and mothers enrolled on dox chow at day 5. Cell lines were derived and maintained in dox-containing media from tumors arising in dox fed mice. All KPsh cells constitutively express mKate2 (Kate) and rtTA. b, Population doublings of KPsh-1–3 lines grown on/off dox. c-f, Characterization of p53 levels (c), BrdU incorporation (d), Annexin-V staining (e) and senescence-associated β-galactosidase (SA-β GAL) staining (f) in three independent KPsh lines grown on/off dox (D, day). g, Representative gross pathology and epifluorescence images of pancreatic tumors resulting from orthotopic transplant of KPsh-2 cells into dox fed mice maintained on dox chow (top, n=3 mice) or withdrawn from dox chow for 10 days (bottom, n=3 mice). KPsh cells uniformly express Kate, while GFP expression indicates cell actively expressing the p53 shRNA. h, Representative Cdkn1a/p21 immunostainig in matched normal host pancreas, or in orthotopic KPsh-2 tumors maintained on dox (n=3) or 10 days following dox withdrawal (n=3). Kate indicates injected KPsh-2 cells. i, Representative Ki67 immunostaining in orthotopic KPsh-2 tumors maintained on dox (n= 3 mice) or 10 days following dox withdrawal (n=3 mice). Kate indicates injected KPsh-2 cells. j, Small animal ultrasound measurement of tumor volume. KPsh-2 cells were injected into dox-fed mice and mice were maintained on dox diet for 2 weeks. After two weeks (D0), tumor size was measured and mice were randomized into off (n=6 mice) and on dox chow groups (n=3 mice). Subsequent tumor size was measured at the indicated time points. n=3 mice on dox were collected for analysis upon sacrifice, n=3 mice were analyzed after 5 and 10 days of dox withdrawal, respectively. k, Survival of mice shown in i after randomization into groups maintained on dox food (n=3 mice) or following dox withdrawal (n= 6 mice). b-f were repeated twice with similar results. Data are presented as either representative independently treated wells (c,f) or mean ± SD of n=3, independently treated wells with individual data points shown (b,d,e). For gel source data (c), see Supplementary Figure 1. Scale bar for immunostaining 50 μM. Scale bar for pathology 1 cm.
Extended Data Figure 2.
Extended Data Figure 2.. p53 restoration increases the αKG/succinate ratio independently of changes in proliferation or senescence.
a, Glucose/glutamine consumption, lactate production in KPsh-1,2 cultured on/off dox for 4 or 8 days (D, days). b, TCA cycle schematic indicating entry points for glucose- and glutamine-derived carbons. Metabolites in red were assessed by isotope tracing experiments. c,d, Metabolite fraction containing 13C derived from [U-13C]glucose (13C-Glc) (c) or derived from [U-13C]glutamine (13C-Gln) (d) after four h of labeling off/on dox for six days. e, f p53 immunoblot (e) or Senescence-associated β-galactosidase (SA-β GAL) staining (f) in on dox KPsh-2 treated with 3 μM etoposide (Etopo) or 25 nM trametinib (Tram) for 48 or 96 h. Cells grown in the absence of dox (-dox) for six days are included as a positive control. g,h, SA-βGAL (g) or BrdU positive (h) cells treated as described in (e). i, Western blot of cells expressing shRenilla, shp19, shp16/p19, or shCdkn1a/p21 on/off dox for six days. j, SA-βGAL staining of cells described in (i). k,l, SA-βGAL (k) or BrdU positive (l) cells treated as described in (i). m, αKG/succinate ratio in cells expressing shRenilla, shp19, p16/p19, or shCdkn1a/p21 on/off dox for six days. a,c,d,f-m were repeated twice with similar results and e was performed once. Data are presented as mean ± SEM of n=6, independently treated wells (a), mean ± SD of n=3, independently treated wells from a representative experiment with individual data points shown (c,d,f,g,h,k,l,m), or representative of 1 independently treated well (e,f,i,j). For gel source data (e,i), see Supplementary Figure 1. Significance assessed in comparison to cells grown with dox by 1-way ANOVA with Tukey’s multiple comparison post-test (a) or in the indicated comparisons by 2-way ANOVA with Sidak’s post-test (m). Scale bar 50 μM.
Extended Data Figure 3.
Extended Data Figure 3.. Characterization of reversibility of p53 dependent effects in KPsh cells.
a, αKG/succinate ratio in KrasG12D; TRE-shRenilla (KRsh) PDAC cells cultured with or without dox for indicated number of days. b-d, Western blot for p53 (b), population doublings (c) and αKG/succinate ratio (d) in 2 KPsh lines cultured with (+Dox) or without dox (-Dox) for 6 days days or cultured without dox for 6 days, followed by 6 days of culture with dox (-Dox→+Dox, arrow indicates when dox was re-introduced). a, c were performed twice with similar results and b,d were performed once. For gel source data (b), see Supplementary Figure 1. Data are presented as mean ± SD of n=3, independently treated wells of a representative experiment with individual data points shown (a,c,d) or or representative of 1 independently treated well (b).
Extended Data Figure 4.
Extended Data Figure 4.. Functional p53 transactivation is required to increase the cellular αKG/succinate ratio.
a-c, p53 immunoblot (a), Cdkn1a/p21 qRT-PCR (b), and αKG/succinate ratio (c) in KPfloxRIK-TRE-Empty, KPfloxRIK-TRE-p53WT (dox inducible expression, wt p53), and KPfloxRIK-TRE-p53TAD1/2M (dox inducible expression, p53 with mutations in both transactivation domain 1 and 2) cells 2 days off/on dox. d Cdkn1a/p21, Mdm2, p53 (top), Idh1 and Pcx (bottom) qRT-PCR in KPsh-2 off/on dox. Day 0 and day 6 Cdkn1a/p21, Mdm2, and p53 values also shown in Fig. 1a. e, αKG/succinate ratio in KPsh1–3 grown on/off dox. f, Idh1 and Pcx qRT-PCR in KPfloxRIK-TRE-Empty, KPfloxRIK-TRE-p53WT, and KPfloxRIK-TRE-p53TAD1/2M off/on dox for 2 days. g, PC activity associated glucose labeling patterns. IDH1 and PC dependent reactions labeled. h, Fractional m+3 (top) or m+5 (bottom) labeling of aspartate and citrate in KPsh1–3 on/off dox for six days after four hours with [U-13C]glucose. i, Idh1 qRTPCR in KPsh-2 expressing shRenilla or shIdh1 on/off dox for 8 days. j, Idh1 and p53 levels in KPsh-2 expressing shRenilla or shIdh1 grown on/off dox for 8 days. Arrowhead: specific Idh1 band. k, αKG/succinate ratio in KPsh-2 expressing shRenilla or shIdh1 grown on/off dox. l,m. p53 and Idh1 immunoblot (l) and αKG/succinate ratio (m) in KPfloxRIK-TRE-Empty, KPfloxRIKTRE-p53WT, and KPfloxRIK-TRE-p53TAD1/2M expressing shRenilla or shIdh1 grown with dox for 2 days. n, αKG/succinate ratio in parental KPsh-2 versus KPsh-2 expressing IDH1 or IDH2 cDNA grown on dox. a-e,h-n were repeated twice with similar results. Data are presented as representative of 1 independently treated well (a,j,l) or as mean ± SD of n=3 independently treated wells of a representative experiment with individual data points shown (b-f, h,i,k,m,n). For gel source data (a,j,l), see Supplementary Figure 1. Significance assessed compared to cells grown on dox by 1-way ANOVA with Sidak’s multiple comparisons post-test (e) or indicated comparisons (f).
Extended Data Figure 5.
Extended Data Figure 5.. p53 binding at Pcx and Idh1.
a. Analysis of ChIP-Seq signal at the Pcx locus in primary p53WT and p53null (KO) mouse embryonic fibroblasts after treatment with doxorubicin. b. Analysis of ChIP-Seq signal at the Idh1 locus in primary p53WT and p53null (KO) mouse embryonic fibroblasts after treatment with doxorubicin. p53 binding sites predicted by MACs comparison of immunoprecipitation samples with input. Response elements predicted by Homer analysis as described in methods. ChIP-Seq data from ref.
Extended Data Figure 6.
Extended Data Figure 6.. Elevating intracellular αKG levels phenocopies the effect of p53 reactivation on gene expression.
a, Mean log2 fold change of all genes following p53 reactivation or cell-permeable αKG in n=2, independently treated wells of KPsh-1 cells. All samples treated with equal amounts of DMSO (vehicle). Spearman correlation r = 0.556, p < 1e-15. b, c qRT-PCR of genes upregulated with both p53 restoration and αKG in KPsh-1 (b) and KPsh-2 (c) cells treated for 72 hours with vehicle, dimethyl-αKG (DM-αKG), diethyl-αKG (DE-αKG) or following p53 restoration (-dox 8 days). d, qRT-PCR of PanIN-cell associated genes in KPsh-1 cells grown on/off dox and treated with 4 mM sodium acetate for 72 h. e, Ogdh immunoblot in p53 null KPfloxRIK or p53 mutant KPR172HRIK cells expressing shOgdh for 4 days. f, Doubling time, day 1–4, of KPfloxRIK and KPR172HRIK cells expressing dox-inducible shOgdh or shRenilla. g,h, Percentage SA-βGAL positive (g) or Annexin-V positive (h) shRNA expressing KPfloxRIK and KPR172HRIK cells off/on dox for 4 days. Etoposide (etopo, 96hrs, 3 μM) included as a positive control. i, αKG/succinate ratio of KPCR172HRIK cells expressing dox-inducible shOgdh or shRenilla grown 4 days off/on dox. j, qRT-PCR of p53/αKG co-regulated genes in shOgdh KPR172HRIK cells compared to shRenilla controls. b-d,i,j were repeated twice with similar results and e was performed once. f-h were repeated in 2 additional lines. For gel source data (e), see Supplementary Figure 1. Data presented as individual data points (b,c,j). mean ± SD (d,f,g,h), mean ± SEM (i), or as a representative image (e) of n=3, independently treated wells of a representative experiment with individual data points shown. Significance assessed in the indicated comparisons by 2-way ANOVA with Sidak’s multiple comparison post test (i) or compared to shRenilla expressing cells by 1-way ANOVA with Tukey’s multiple comparison post-test (g,h).
Extended Data Figure 7.
Extended Data Figure 7.. Ogdh depletion induces differentiation and decreases tumor growth.
a, Representative CK19 staining of KPsh-2 derived orthotopic tumors injected in mice on dox (n=3 mice) or ten days after dox withdrawal (n=3 mice). Kate marks injected KPsh-2 cells. b, Representative gross images of KPflox derived orthotopic tumors 12 days following injection of cells expressing shRenilla (n=5), shOgdh (n=4 mice), or shSdha (n=4 mice) into dox fed mice. GFP indicates shRNA expressing cells. c, Small animal ultrasound measurement of tumors derived from KPflox cells dox inducuble shRenilla (n=4 mice), shOgdh (Ogdh-1, n=4 mice, Ogdh-2, n=3 mice), or shSdha (n=4) after enrolling on dox chow. d, Representative H&E staining of KPflox derived orthotopic tumors 9 days after expression of dox-inducible shRenilla, shOgdh, or shSdha in established tumors from c. GFP marks injected KPflox cells expressing indicated shRNA. e, Representative CK19 staining of KPflox derived orthotopic tumors expressing dox-inducible shRenilla, shOgdh, or shSdha from Figure 3b. GFP marks injected KPflox cells expressing indicated shRNA. f, Representative CK19 staining of KPflox derived orthotopic tumors 9 days after expression of dox-inducible shRenilla, shOgdh, or shSdha in established tumors from c. GFP marks cells expressing indicated shRNA. g, Western blot (top) of Sdha in KPflox cells expressing dox-inducible shRenilla or shSdha grown with dox for 4 days. αKG/succinate ratio (bottom) in in KPflox cells expressing dox-inducible shRenilla or shSdha grown with dox for 4 days. For c, data are presented as mean ± SD and individual, longitudinally tracked tumor volumes are presented in the source data. For gel source data (g), see Supplementary Figure 1. g was performed once and GCMS is presented as mean ± SD of n=3, independently treated wells with individual data points shown. Scale bar for immunostaining 50 μM. Scale bar for pathology 1 cm.
Extended Data Figure 8.
Extended Data Figure 8.. Ogdh inhibition reduces tumor cell competitive fitness in vivo.
a, αKG/succinate ratio of KPCfloxRIK and KPCR172HRIK cells expressing dox-inducible shRNAs targeting Renilla, Ogdh, and Sdha grown 4 days with or without dox. b, Schematic of in vivo competition assay. Kate positive KPfloxRIK and KPR172HRIK cells were infected with retroviruses encoding dox inducible, GFP linked shRNAs targeting Renilla, Ogdh, or Sdha. Cells were selected for viral integration, induced with dox for 2 days, mixed with uninfected parental cellsat a ratio of 8:2 and analyzed by flow cytometry to determine initial ratio of shRNA expressing cells to uninfected cells. This cell mixture was injected orthotopically into dox fed recipient mice. After 3 weeks of tumor growth, pancreatic tumors were removed, weighed, dissociated, and analyzed by flow cytometry to measure final ratio of shRNA expressing to uninfected cells. Data are presented in Fig. 3c. c,d, Tumor mass of orthotopically injected KPfloxRIK (c) or KPR172HRIK (d) cells expressing a mixture of shRNAs targeting Renilla, Ogdh, or Sdha from Fig. 3c. KPfloxRIK: n= 5 mice shRenilla, n=4 mice shOgdh, shSdha. KPR172KRIK : n= 5 mice shRenilla, n=4 mice shOgdh, shSdha-1,2, n=3 mice shSdha-3. e, Representative gross images of pancreatic tumors arising in dox fed mice 3 weeks days following orthotopic transplant of KPCfloxRIK (top) and KPCR172HRIK (bottom) cells expressing dox-inducible shRNAs targeting Renilla, Ogdh, and Sdha mixed 8:2 from Fig. 3c. a was performed once. Data are presented as mean ± SD of n=3, independently treated wells of a representative experiment with individual data points shown. Significance assessed compared to shRenilla controls by 1-way ANOVA with Dunnet’s multiple comparison post-test (c). Scale bar 1 cm.
Extended Data Figure 9.
Extended Data Figure 9.. p53 reactivation and Ogdh inhibition induce 5hmC accumulation in PDAC cells.
a, Median fluorescence intensity of 5hmC in KPsh-2 cells grown with or without dox for 8 days. b, qRT-PCR of Tet1, Tet2, and Tet3 expression in KPsh-2 cells grown with or without dox for indicated number of days. c, Sequence analysis of CRISPR/Cas9 editing. Percentage of amplicons flanking sgRNA target sequence with indicated genotype amplified from KPsh-2 cells expressing sgRNAs targeting Tet1, Tet2, and Tet3. d, 5hmC Median fluorescence intensity (MFI) in KPsh-2 cells expressing sgRNAs targeting Tet1, Tet2, and Tet3 grown with or without dox for 8 days. e, 5hmC MFI in KPsh-2 cells grown with 4 mM DM-αKG for 72 h. f, 5hmC MFI in 8988 and Panc1 cells grown with 4 mM DM-αKG for 72 h. g, 5hmC MFI in KPCfloxRIK and KPCR172HRIK cells expressing dox-inducible shRNAs targeting Renilla or Ogdh grown 4 days with or without dox. h, Representative 5hmC staining in orthotopic tumors derived from KPflox cells expressing dox-inducible hairpins targeting Renilla (n=5 mice), Ogdh (n=4 mice), or Sdha (n=4 mice) two weeks after injection in mice maintained on dox. i, Representative 5hmC staining of orthotopic tumors derived from KPflox cells 9 days after activation of dox-inducible hairpins targeting Renilla (n=4 mice), Ogdh (Ogdh-1, n=4 mice, Ogdh-2, n=3 mice), or Sdha-1–3 (n=4) in established tumors. GFP marks cells expressing indicated shRNA. a,d-g were repeated twice with similar results, b was repeated in an additional line. Data are presented as mean ± SD of n=3, independently treated wells of a representative experiment with individual data points shown. Significance assessed by two-tailed Student’s t-test (a,e,f) or compared to shRenilla controls by 1-way ANOVA with Tukey’s multiple comparison post-test (g). Scale bar 50 μM
Extended Data Figure 10.
Extended Data Figure 10.. Increase in the cellular αKG/succinate ratio enforces p53 driven tumor suppression.
a-c, Sdha and p53 immunoblot (a), αKG/succinate ratio (b) and 5hmC MFI (c) in KPsh-2 cells expressing constitutive shRNAs targeting Sdha or Renilla grown with or without dox for 8 days. d, Representative 5hmC staining in orthotopic tumors derived from KPsh-2 cells expressing constitutive shRNAs targeting Sdha or Renilla in mice maintained on dox (n=3 mice) or ten days following dox withdrawal (n=3 mice). GFP denotes cells expressing hairpin targeting p53. 5hmC staining per nucleus is quantified in Fig. 4g. e,f, Small animal ultrasound measurement of tumors derived from KPsh-2 cells expressing constitutive shRNAs targeting Renilla (left) or Sdha (right) orthotopically injected into dox-fed mice maintained on dox diet for 2 weeks. After two weeks (D0), tumor size was measured and mice were randomized into off and on dox chow groups (shRenilla n=5 mice, shSdha n=4 mice). Subsequent tumor size and mouse survival was monitored up to 10 days after dox withdrawal. g, Fold change in tumor size from day 5 to day 10 following withdrawal of dox chow (D0) from mice bearing orthotopic tumors derived from KPsh-2 cells expressing constitutive shRNAs targeting Sdha or Renilla. h, Representative H&E staining of orthotopic tumors derived from KPsh-2 cells expressing constitutive shRNAs targeting Sdha or Renilla maintained on dox or 10 days following dox withdrawal. a and b were performed once, c was repeated twice with similar results. For gel source data (a), see Supplementary Figure 1. Data are presented as either a representative independently treated well (a), or as mean ± SD of n=3 independently treated wells with individual data points shown (b,c). Significance assessed by two-tailed, unpaired t-test (g). Scale bar 50 μM.
Figure 1.
Figure 1.. p53 restoration increases the cellular αKG/succinate ratio independently of changes in proliferation.
a, Western blot (top) and qRT-PCR (bottom) of KPsh-1–3 lines cultured with or without doxycycline (dox) for six days. Gene expression is represented as the log2 fold change relative to +dox controls for each line. b,c Steady-state levels of TCA cycle metabolites (b) or αKG/succinate ratio (c) in cells cultured with or without dox for eight days. d, αKG/succinate ratio in cells cultured on dox with 25 nM trametinib or 3 μM etoposide for 48 or 96 has shown. Cells cultured without dox for six days are included as a control. a-d were repeated twice with similar results. Data are presented as either a representative independently treated well (a, top), as individual data points (a bottom, b), or as mean ± SD of n=3 independently treated wells with individual data points shown (c,d). For gel source data (a), see Supplementary Figure 1. Significance assessed by two-tailed Student’s t-test (c) or 1-way ANOVA with Tukey’s post-test (d) in comparison with vehicle treated cells grown with dox.
Figure 2.
Figure 2.. αKG recapitulates gene expression changes induced by p53 restoration.
a, Mean log2 fold change of all ATAC-Seq peaks following p53 reactivation or treatment with cell-permeable αKG in n=2, independently treated wells of KPsh-1 cells. All samples contained equivalent amounts of vehicle (DMSO). Pearson correlation r = 0.605, p < 2.2e-16. Number of peaks increased (red) or decreased (blue) at least two-fold with a false discovery rate < 0.1 in each condition are indicated. b, Normalized gene enrichment score of published p53-associated gene sets in KPsh-1 cells following p53 reactivation or αKG treatment. Gene sets significantly (p < 0.05) enriched (red) or depleted (blue) are marked with an asterisk. Genes are listed in Supplementary Table 2. c, GSEA analyses of RNA-Seq data of KPsh-1 cells treated with cell-permeable αKG showing enrichment of genes upregulated (genes UP) or downregulated (genes DOWN) at least 2-fold, padj < 0.05 following p53 restoration. d,e, GSEA of PanIN-cell and PDAC-cell associated genes associated genes following p53 restoration or αKG treatment (d,e). Gene sets derived from (Boj et al) and listed in Supplementary Table 2. RNA-Seq in b-e performed on n=2, independently treated wells. f, αKG/succinate ratio of p53 null (KPfloxRIK) cells expressing dox-inducible shRNAs targeting Ogdh or Renilla luciferase (control) grown 4 days with or without dox. g, qRT-PCR of genes upregulated by both p53 restoration and αKG treatment in KPsh-1 cells by RNA-Seq. Gene expression is represented as the log2 fold change relative to shRenilla expressing cells. f,g were repeated twice with similar results. Data are presented as mean ± SEM of n=3, independently treated wells with individual data points shown (f), or as individual data points (g). Significance assessed in indicated comparisons by 2-way ANOVA with Sidak’s multiple comparisons post-test.
Figure 3.
Figure 3.. Both p53 restoration and Ogdh inhibition promote tumor cell differentiation and tumor suppression.
a, Representative hematoxylin and eosin (H&E) staining of orthotopic tumors derived from KPsh-2 cells grown in mice on dox-diet (n=3) or ten days after dox withdrawal (n=3). b, Representative H&E staining of orthotopic tumors derived from KPflox cells expressing dox-inducible shRenilla, shOgdh, or shSdha two weeks after injection in mice maintained on dox. n= 5 mice shRenilla, n=4 mice (shOgdh, shSdha). c, In vivo competition assay tracking frequency of KPfloxRIK (top) or KPR172KRIK (bottom) cells expressing shRenilla, shOgdh, or shSdha (GFP+) after three weeks of tumor growth in dox-fed mice. Data are presented as mean ± SD of individual tumors. KPfloxRIK: n= 5 mice shRenilla, n=4 mice (shOgdh, shSdha). KPR172KRIK : n= 5 mice shRenilla, (shOgdh, shSdha-1,2), n=3 mice shSdha-3. Scale bar 50 μm.
Figure 4.
Figure 4.. p53 status and cellular αKG/succinate ratio dictates 5hmC levels in mouse models of PDAC.
a, Representative 5hmC and p53 staining in PDAC arising in KPC mice (n=3). High p53 staining denotes malignant cells. b, Representative 5hmC staining in human PanIN 1–3 and PDAC samples. b-catenin marks tumor epithelium. c, Fraction 5hmC-positive nuclei (binned into quartiles) in indicated numbers of human tumors. d, Representative 5hmC staining in orthotopic tumors derived from KPsh-2 cells in mice maintained on dox (n=3) or 10 days off dox (n=3). GFP denotes cells expressing shp53. e, Nuclear 5hmC intensity in lineage-traced (i.e., GFP high, +DOX; GFP low −DOX) tumor cells from three images each from n=3 independent tumors from d. n= 1074, 1571, 1359, 1569, 1253, 781 nuclei quanitified per mouse. f, Nuclear 5hmC intensity in lineage-traced (i.e., GFP+) tumor cells from three images each from n=3 independent tumors derived by orthotopic injection of KPflox cells expressing dox-inducible shRenilla, shOgdh, or shSdha two weeks after injection in mice maintained on dox. n =1609, 1796, 1947, 1581, 1751, 1619, 1636, 1786, 1907, 1801, 1892, 1758, 1829, 2001, 1898, 1982, 1839, 1926 nuclei quanitified per mouse. GFP denotes shRNA-expressing cells. g, Nuclear 5hmC intensity in lineage-traced (i.e., GFP high, +Dox; GFP low −Dox) tumor cells from three images each from n=3 independent tumors derived by orthotopic injection of KPsh-2 cells expressing shRenilla or shSdha maintained on dox or 10 days off dox. n=1810, 1720, 1980, 1837, 1739, 1670, 1695, 1592, 1583, 1690, 1428, 1734, 1351, 1434, 1708, 1543, 1308, 1413, 1641, 1893, 1476, 1586, 1597, 1547 nuclei quanitified per mouse. e-g, Population medians were taken for each mouse and points represent total 5hmC levels of individual nuclei normalized to DAPI. e-g, Significance assessed in indicated comparisons using two tailed Students t-test. Scale bar 50 μm.

Comment in

  • Suppressed fate.
    Dart A. Dart A. Nat Rev Cancer. 2019 Nov;19(11):610. doi: 10.1038/s41568-019-0215-8. Nat Rev Cancer. 2019. PMID: 31578518 No abstract available.

References

    1. Waddell N et al. Whole genomes redefine the mutational landscape of pancreatic cancer. Nature 518, 495–501, doi:10.1038/nature14169 (2015). - DOI - PMC - PubMed
    1. Kastenhuber ER & Lowe SW Putting p53 in Context. Cell 170, 1062–1078, doi:10.1016/j.cell.2017.08.028 (2017). - DOI - PMC - PubMed
    1. Kruiswijk F, Labuschagne CF & Vousden KH p53 in survival, death and metabolic health: a lifeguard with a licence to kill. Nature reviews. Molecular cell biology 16, 393–405, doi:10.1038/nrm4007 (2015). - DOI - PubMed
    1. Morris J. P. t., Wang SC & Hebrok M KRAS, Hedgehog, Wnt and the twisted developmental biology of pancreatic ductal adenocarcinoma. Nature reviews. Cancer 10, 683–695, doi:10.1038/nrc2899 (2010). - DOI - PMC - PubMed
    1. Bailey P et al. Genomic analyses identify molecular subtypes of pancreatic cancer. Nature 531, 47–52, doi:10.1038/nature16965 (2016). - DOI - PubMed

Publication types

MeSH terms