. 2019 Oct;574(7776):117-121.
doi: 10.1038/s41586-019-1560-1. Epub 2019 Sep 18.

Stunted microbiota and opportunistic pathogen colonization in caesarean-section birth

Affiliations

Stunted microbiota and opportunistic pathogen colonization in caesarean-section birth

Yan Shao et al. Nature. 2019 Oct.

Abstract

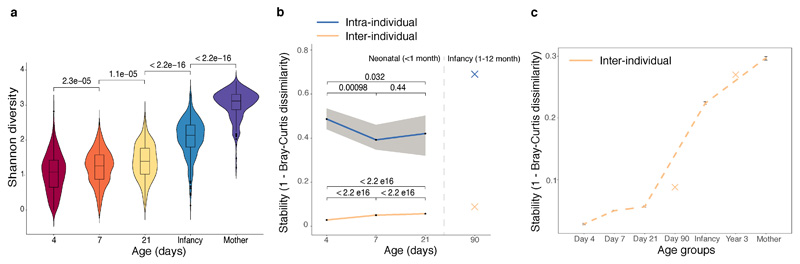
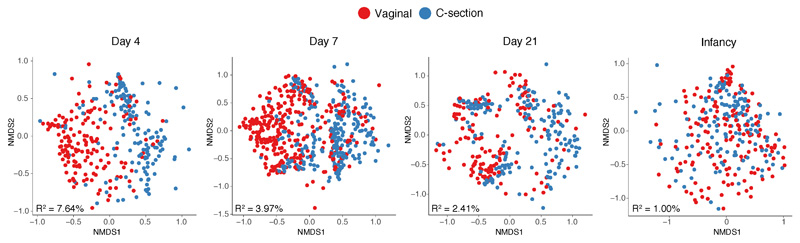
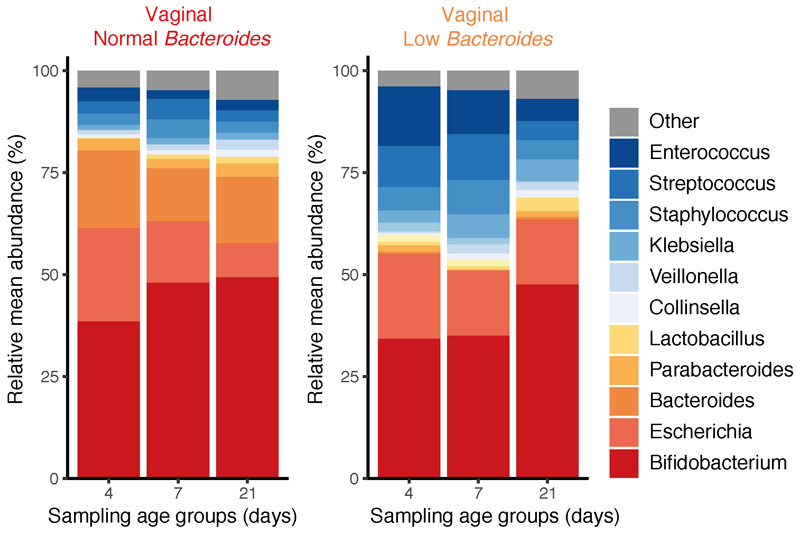
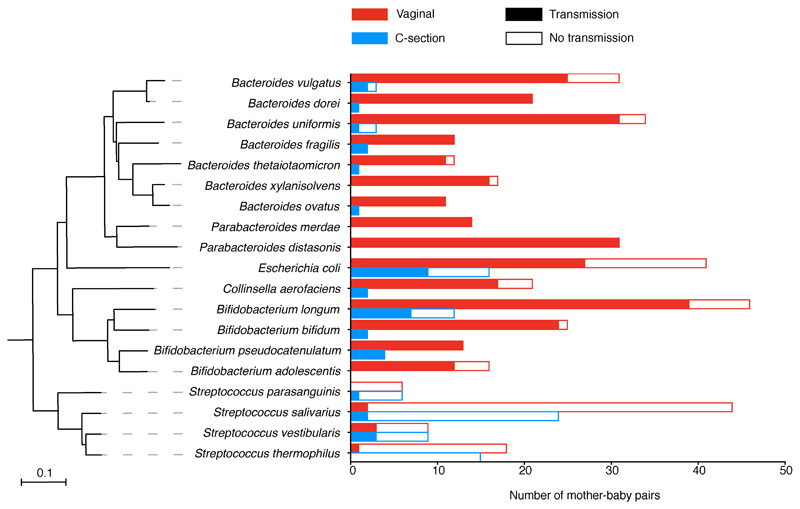
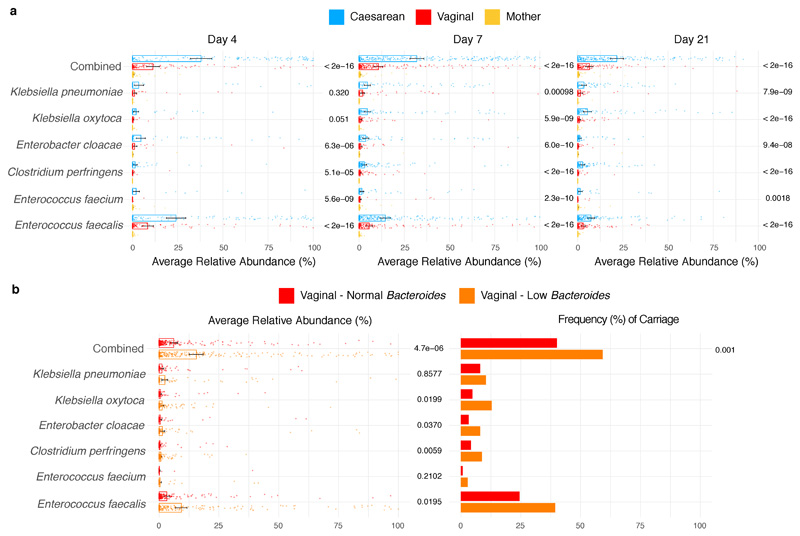
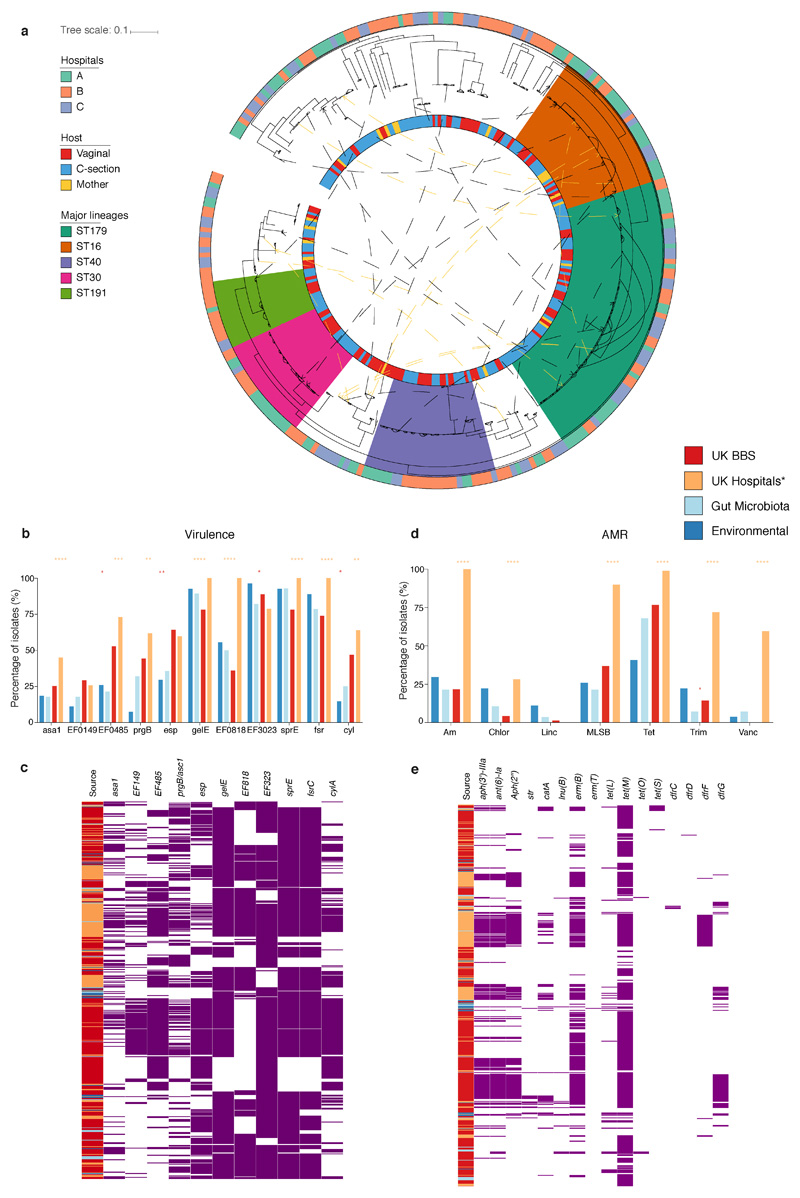
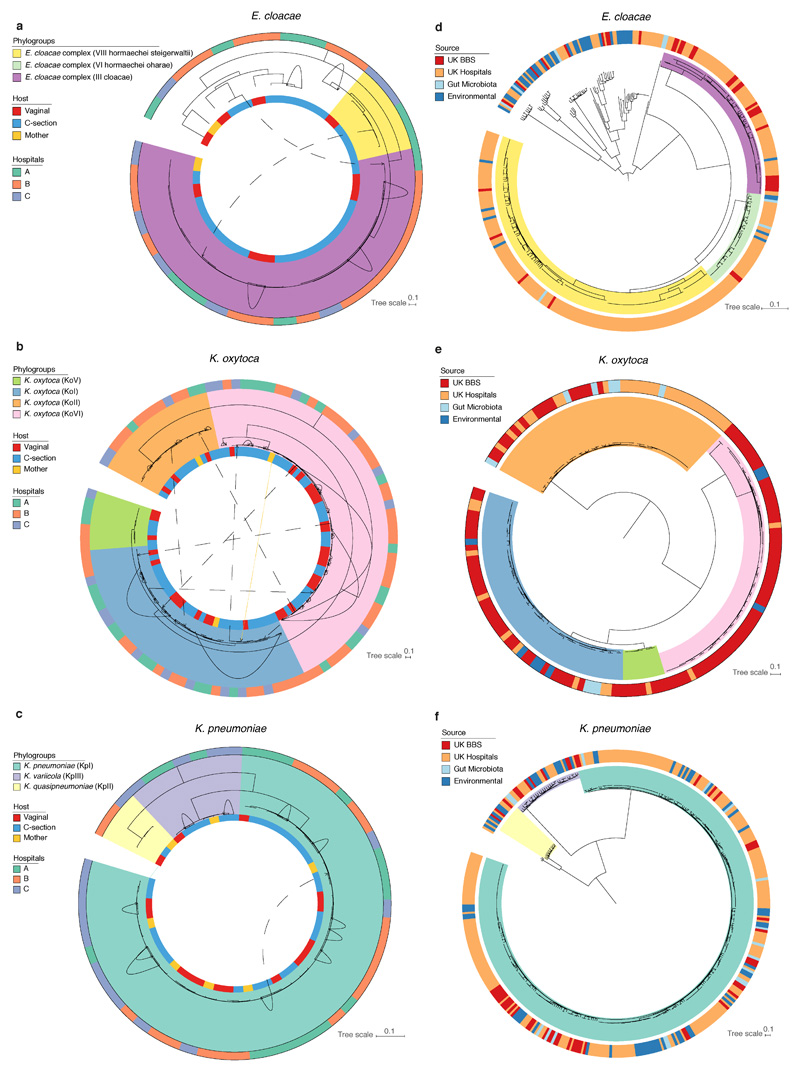
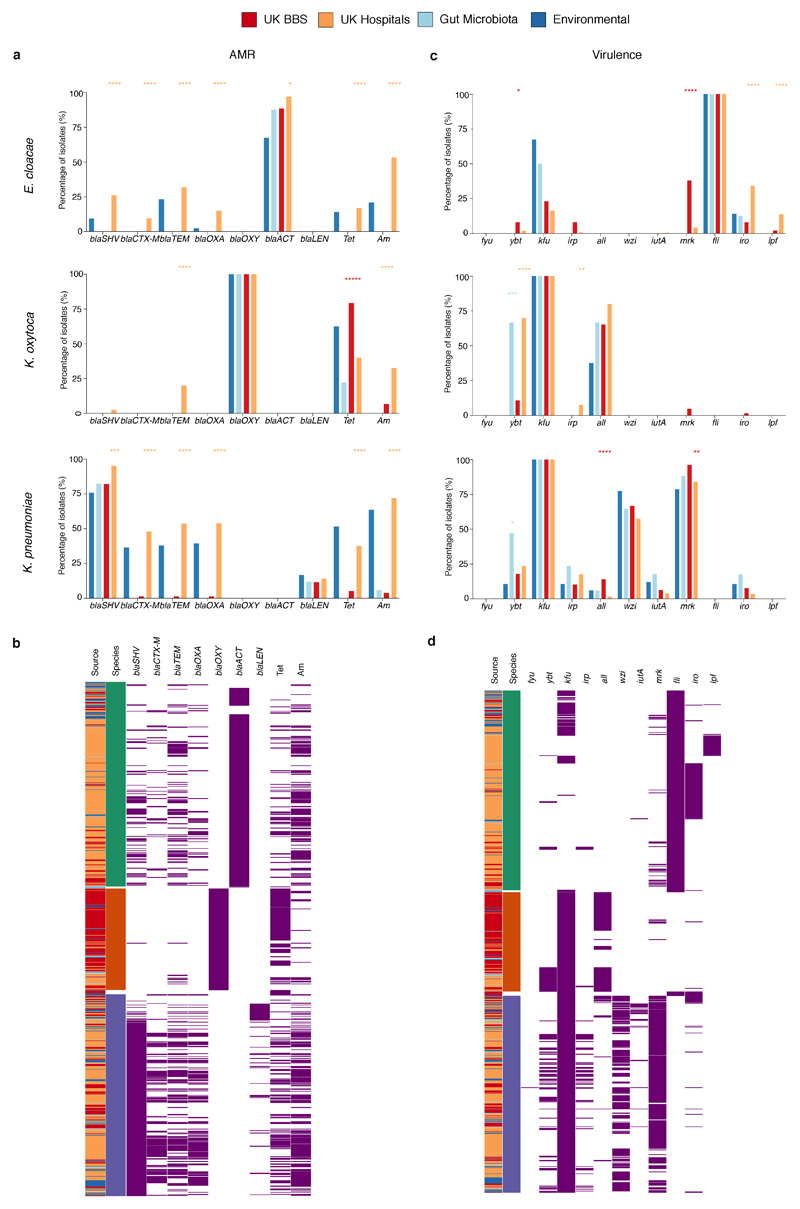
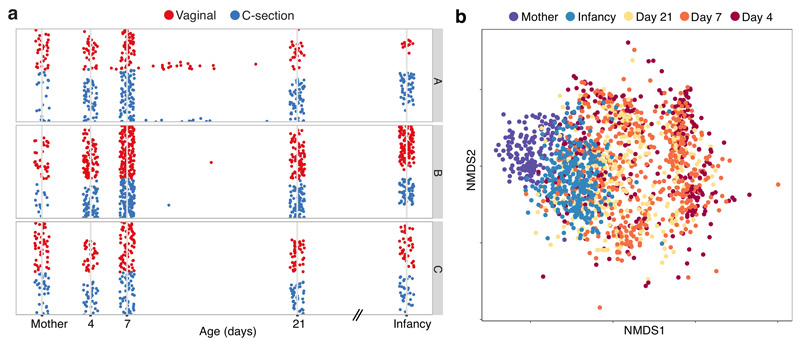
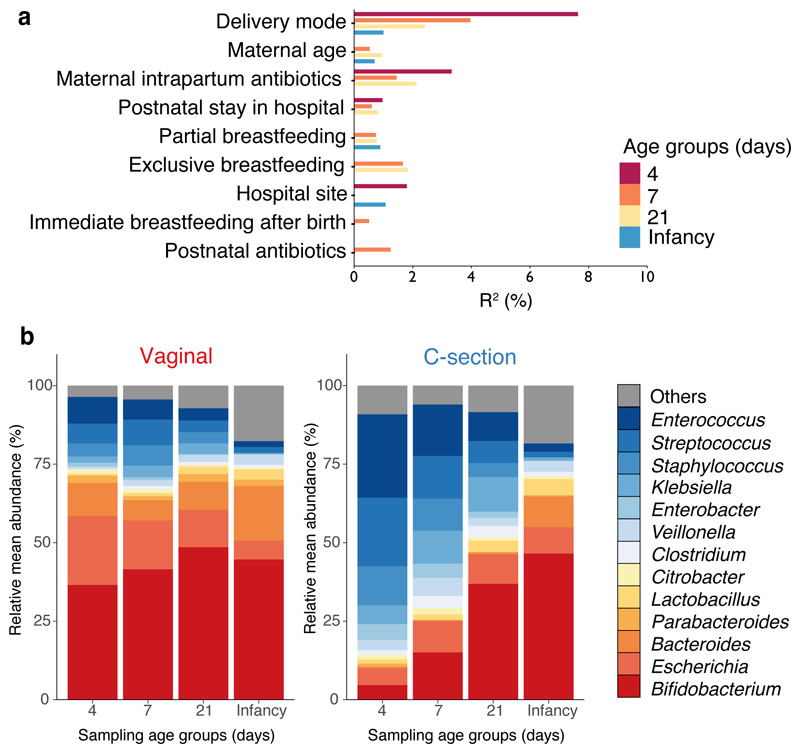
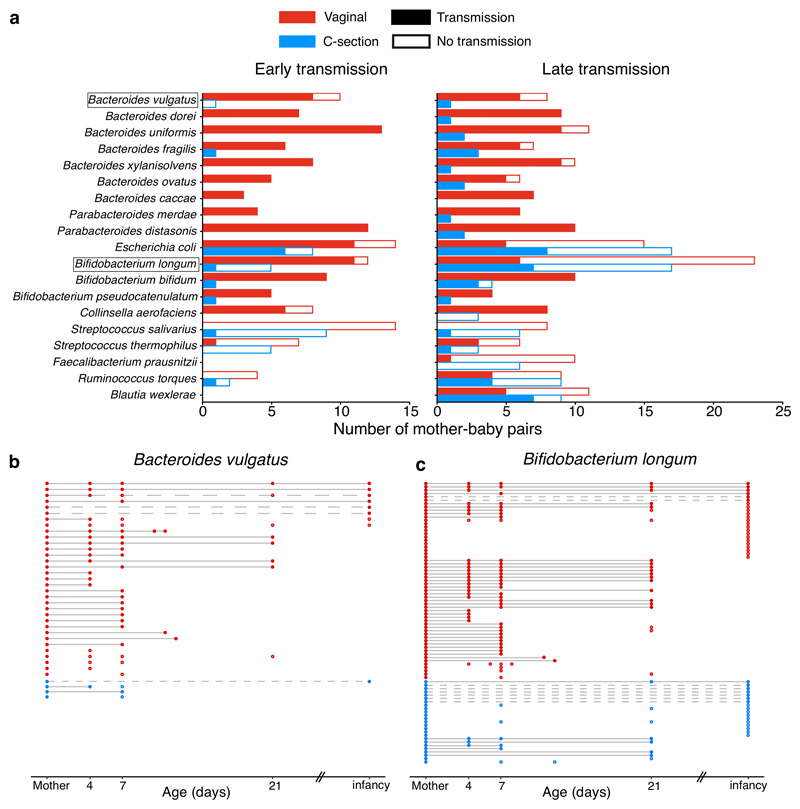
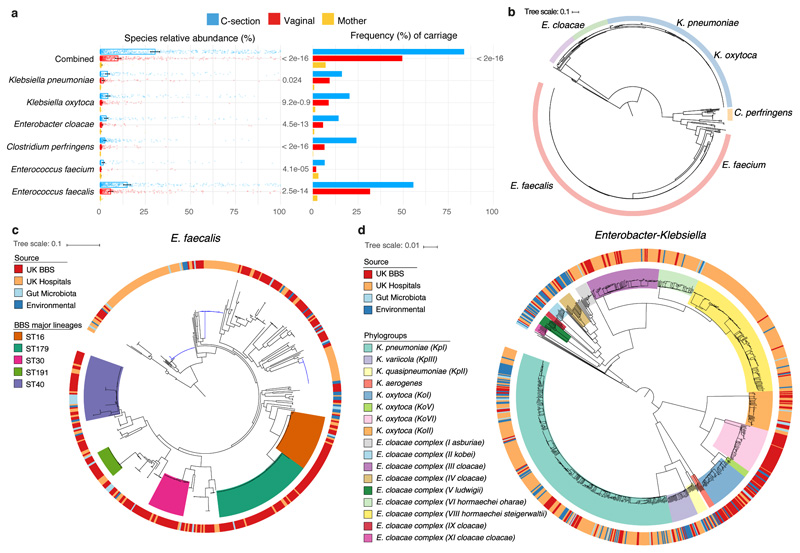
Immediately after birth, newborn babies experience rapid colonization by microorganisms from their mothers and the surrounding environment1. Diseases in childhood and later in life are potentially mediated by the perturbation of the colonization of the infant gut microbiota2. However, the effects of delivery via caesarean section on the earliest stages of the acquisition and development of the gut microbiota, during the neonatal period (≤1 month), remain controversial3,4. Here we report the disrupted transmission of maternal Bacteroides strains, and high-level colonization by opportunistic pathogens associated with the hospital environment (including Enterococcus, Enterobacter and Klebsiella species), in babies delivered by caesarean section. These effects were also seen, to a lesser extent, in vaginally delivered babies whose mothers underwent antibiotic prophylaxis and in babies who were not breastfed during the neonatal period. We applied longitudinal sampling and whole-genome shotgun metagenomic analysis to 1,679 gut microbiota samples (taken at several time points during the neonatal period, and in infancy) from 596 full-term babies born in UK hospitals; for a subset of these babies, we collected additional matched samples from mothers (175 mothers paired with 178 babies). This analysis demonstrates that the mode of delivery is a significant factor that affects the composition of the gut microbiota throughout the neonatal period, and into infancy. Matched large-scale culturing and whole-genome sequencing of over 800 bacterial strains from these babies identified virulence factors and clinically relevant antimicrobial resistance in opportunistic pathogens that may predispose individuals to opportunistic infections. Our findings highlight the critical role of the local environment in establishing the gut microbiota in very early life, and identify colonization with antimicrobial-resistance-containing opportunistic pathogens as a previously underappreciated risk factor in hospital births.


Conflict of interest statement

Competing interests

The authors declare no competing financial interests.

Figures

Extended Data Fig. 1
Extended Data Fig. 1. The neonatal gut microbiotas exhibited high volatility and individuality.
a, Microbiota diversity (alpha diversity) increased over developmental time. The violin plot outlines illustrate kernel probability density, with the width of the shaded area representing the proportion of the data shown. Centre lines show the medians; box limits indicate the 25th and 75th percentiles; whiskers extend 1.5 times the interquartile range from the 25th and 75th percentiles, outliers are represented by dots. Number of gut microbiotas on day 4 (n=310), 7 (n=532) and 21 (n=325), in infancy (n = 302), and from matched mothers (n = 175). b-c, Gut microbiota stability, stratified by inter-individual (day 4, n=310; day 7, n=532; day 21, n=325) and intra-individual comparisons in sliding time windows (day 4 to 7, n = 274; day 7 to 21, n=285) during the neonatal period (b), in the context of the overall infancy period (c) with the TEDDY study microbiota stability measurements (earliest measurements on day 90, and year 3) plotted in crosses. Solid lines show the median per time window. Shaded areas show the 99% confidence interval estimated using binomial distribution. Error bars indicate median absolute deviation. Statistical significance between groups was determined by two-sided Wilcoxon rank-sum test.
Extended Data Fig. 2
Extended Data Fig. 2. Microbiota variation associated with mode of delivery in the neonatal period and infancy.
Non-metric multidimensional scaling (NMDS) ordination of Bray–Curtis dissimilarity between the species relative abundance profiles of the gut microbiota sampled from babies on day 4 (vaginal, n=157; C-section, n=153), day 7 (vaginal, n=280; C-section, n=252), day 21 (vaginal, n=147; C-section, n=178), during infancy (vaginal, n=160; C-section, n = 142) and from mothers (vaginal, n=110; C-section, n=65). Microbial variation explained by factor mode of delivery is represented by the PERMANOVA R2 value (bottom left) and statistically significant across four cross-sectional PERMANOVA tests (FDR-corrected p-values reported in Supplementary Table 2).
Extended Data Fig. 3
Extended Data Fig. 3. Microbial succession in the vaginally-delivered neonatal gut microbiota over the first 21 days of life.
Bar plots show longitudinal changes in the mean relative abundance (RA) of faecal bacteria at the genus level at day 4, 7 and 21 days of life, for genera with > 1% RA across all neonatal samples. Left panel: n = 316 from 160 vaginally delivered babies detected with Bacteroides, right panel: n = 290 from 154 vaginally delivered babies with low Bacteroides status (defined in Methods).
Extended Data Fig. 4
Extended Data Fig. 4. Maternal strain transmission during the early neonatal period.
Maternal strain transmission across 178 mother-baby pairs (vaginal: 112, C-section: 66) sampled at least once during the early neonatal period. Only the frequently shared species detected with sufficient coverage for strain analysis in more than 10 pairs are shown. The neighbour-joining tree is constructed based on the pairwise mash distances of the respective reference genomes. Phylogenetically related species shared similar transmission timing pattern, for example the frequent transmission of Bacteroides/Parabacteroides spp. and Bifidobacterium spp. in vaginally delivered babies and the lack thereof in C-section born babies; and that most Streptococcus species were transmitted from other sources (non-maternal) in the environment.
Extended Data Fig. 5
Extended Data Fig. 5. Frequency and abundance of opportunistic pathogens in the gut microbiotas.
a-b, C-section and low-Bacteroides vaginally delivered babies were more frequently carrying opportunistic pathogens (as defined in Methods) and at higher level of species relative abundance (RA), compared to vaginally delivered babies (a) and normal-Bacteroides vaginally delivered babies (b), respectively. Significant differential presence in neonatal samples within each major neonatal period sampling groups (day 4 (n = 310), 7 (n = 532) and 21 (n = 325)) in terms of mean (RA) and frequency of six known opportunistic pathogens associated with the healthcare environment, which are rarely carried by adults (mothers, n=175) (b). Number of individuals sampled in the neonatal period: vaginal, n=314; vaginal-normal (Bacteroides level), n=160; vaginal-low (Bacteroides level), n=154. Error bars indicate the 95% CI of the mean RA. Statistical significance in mean species RA and combined pathogen carriage (defined in Methods) frequency was obtained by applying two-sided Wilcoxon signed-rank test and Fisher’s exact test, respectively.
Extended Data Fig. 6
Extended Data Fig. 6. Phylogeny and pathogenicity potential of the BBS E. faecalis strains.
a, Phylogenetic tree of the BBS E. faecalis strains (n=282, isolated from 269 faecal samples of 160 subjects). Midpoint-rooted maximum likelihood is based on SNPs in 1,827 core genes. The five major lineages (>10 BBS strain representatives; ST179, n=60; ST16, n=30, ST40, n=27; ST30, n=21, ST191, n=14) identified with UK hospital collection distributed across three hospitals in this study with no phylogroup limited to any single hospital. Solid lines between indicated the intra-subject persistence (n=92 in 67 babies). Dash lines indicated phylogenetically distinct strains isolated from longitudinal samples (n=18) or mother-baby paired samples (yellow, n=10) with arrows indicating the direction of potential transmission (early-to-later or mother-to-baby). Where multiple identical strains (no SNP difference in species core-genome) were isolated from the same faecal sample, only one representative strain was included in the species phylogenetic tree (total number of strains, n=356). b-e, Prevalence of virulence (b-c) and AMR genes (grouped by antibiotic class) (d-e) were detected in the BBS E. faecalis strains. Statistical significance results shown are coloured according to the group with higher frequency of detected genes by two-sided Fisher's exact test between the groups of gut microbiotas (n=28) versus BBS strains (n=356), and BBS versus the UK hospital epidemic strains (n=89, tree branches coloured blue in Fig. 4c). ****P<0.0001, ***P < 0.001, **P < 0.01, *P < 0.05. Virulence genes: asa1, EF0149, EF0485, prgB = Aggregation substance; esp = enterococcal surface protein; Exoenzymes: gelE = gelatinase; EF0818, EF3023 = hyaluronidase (spreading factor); sprE = serine protease; fsr = Quorum sensing system; Toxin: cyl = cytolysin. Genes that detected across all isolates (dfrE, efrA, efrB, emeA, lsaA) are not shown. AMR genes: Am = aminoglycosides (aph3"-III, ant(6)-Ia, aph(2''), str); Chlor = chloramphenicol (catA); Linc = lincosamides (lnuB); MLSB = macrolide, lincosamide, streptogramin B (ermB or ermT); Tet = tetracycline (tetL, tetM, tetO, tetS); Trim = trimethoprim (dfrC, dfrD, dfrF or dfrG); Vanc = vancomycin.
Extended Data Fig. 7
Extended Data Fig. 7. Phylogenies of the BBS E. cloacae, K. oxytoca and K. pneumoniae strains.
a-f, Midpoint-rooted core-genome maximum likelihood trees of the E. cloacae complex, K. oxytoca and K. pneumoniae strains isolated in this study (a-c) and in the context of public genomes (d-f). a-c, Number of BBS strains of E. cloacae (a, n=37, isolated from 37 faecal samples of 30 subjects, 1,861 core genes), K. oxytoca (b, n=107, isolated from 90 faecal samples of 62 subjects, 2,910 core genes) and K. pneumoniae strains (c, n=53, isolated from 47 faecal samples of 35 subjects, 3,471 core genes). Solid lines between indicated the intra-subject strain persistence (E. cloacae, n=5; K. oxytoca, n= 25 in 18 babies; K. pneumoniae, n=11 in 8 babies). Dash lines indicated phylogenetically distinct strains isolated from longitudinal samples (E. cloacae, n=2; K. oxytoca, n=7 in 6 subjects; K. pneumoniae, n=1) with arrows indicating the direction of potential transmission (early-to-later samples). Where multiple identical strains (no SNP difference in species core-genome) were isolated from the same faecal sample, only one representative strain was included in the species phylogenetic tree (number of non-redundant BBS strains: E. cloacae, n=52; K. oxytoca, n=150; K. pneumoniae, n=78). For each species, the main phylogroups identified with UK hospital collection (E. cloacae: III, VIII; K. oxytoca: KoI, KoII, KoV, KoVI; K. pneumoniae: KpI, KpII, KpIII) distributed across three hospitals in this study with no phylogroup limited to any single hospital. d-f, Number of public genomes included in the phylogenetic analysis of E. cloacae (d, UK hospitals, n=314; gut microbiotas, n=8; environmental sources, n=43; 1,484 core genes), K. oxytoca (e, UK hospitals, n=40; gut microbiotas, n=9; environmental sources, n=8; 3,399 core genes), and K. pneumoniae strains (f, UK hospitals, n=250; gut microbiotas, n=17; environmental sources, n=66; 2,510 core genes).
Extended Data Fig. 8
Extended Data Fig. 8. Prevalence of AMR and virulence in the Klebsiella and Enterobacter strains.
a-d, Frequency and heatmaps of isolates for putative AMR (a-b) and virulence genes (grouped by antibiotic class) (c-d) most frequently detected in the UK hospital collection strains of E. cloacae (green), K. oxytoca (orange) and K. pneumoniae (blue). Statistical significance results shown are coloured according to the group with higher frequency of detected genes by two-sided Fisher's exact test between the groups of gut microbiota (E. cloacae, n=8; K. oxytoca, n=9; K. pneumoniae, n=17) versus BBS strains (E. cloacae, n=52; K. oxytoca, n=150; K. pneumoniae, n=78), and BBS versus the UK hospital strains (E. cloacae, n=314; K. oxytoca, n=40; K. pneumoniae, n=250). ****P<0.0001, ***P < 0.001, **P < 0.01, *P < 0.05. AMR genes: extended-spectrum beta-lactamases (ESBLs): blaSHV, blaCTX-M, blaTEM; other beta-lactamases: blaOXA, blaOXY, blaACT, blaLEN; Tet = tetracycline (tetA, tetR); Am = aminoglycosides (aac(3), aac(6’), aad, str). Virulence genes: iron acquisition: fyu, ybt = yersiniabactin, kfu = iron transporter permease, irp = iron regulatory proteins; all = allatonin metabolism; wzi = capsule; iutA = aerobactin siderophore receptor; mrk = fimbriae and biofilm formation; fli = flagella biosynthesis; iro = siderophore production; lpf = fimbrial chaperones. Genes detected across all isolates are not shown.
Fig. 1
Fig. 1. Developmental dynamics of the neonatal gut microbiota.
a, Longitudinal metagenomic sampling of 1,679 early-life gut microbiotas of 771 individuals from three participating hospitals (A, B, C) of the Baby Biome Study. Each row corresponds to the time course of a subject, comprising 596 babies sampled during the neonatal period primarily on day 4 (n=310), 7 (n=532) and 21 (n=325), in infancy (8.75 ± 1.98 months of age, n = 302), and from matched mothers (n = 175). b, Non-metric multidimensional scaling (NMDS) ordination of Bray–Curtis dissimilarity, n = 917) between the species relative abundance profiles of the gut microbiota sampled from babies sampled on day 4, day 7, day 21, in infancy and from mothers.
Fig. 2
Fig. 2. Perturbed neonatal gut microbiota composition and development associated with the mode of delivery
a, Bar plot illustrating the clinical covariates associated with the neonatal gut microbiota variations on day 4 (n=310), day 7 (n=532), day 21 (n=325) and in infancy (n=302). Only the statistically significant associations in cross-sectional tests are shown. Covariates are ranked by the number statistically significant effect observed across sampling age groups. The proportion of explained variance (R2) and statistical significance were determined by PERMANOVA on between-sample Bray-Curtis distances. b, Longitudinal changes in the mean relative abundance (RA) of faecal bacteria at the genus level sampled on day 4, 7, 21 days of life and in infancy, for genera with > 1% RA across all neonatal period samples. Vaginal, n=744 from 310 babies; C-section, n=725 from 281 babies.
Fig. 3
Fig. 3. Disrupted maternal strain transmission in C-section-delivered babies.
a, Early and late transmission of the maternal strains in mother-baby pairs (vaginal: 35, C-section: 24) longitudinally sampled during the neonatal (early) and infancy (late) period. Only the frequently shared species detected with sufficient coverage for strain analysis in more than 10 pairs are shown. b, c Transmission events of maternal B. vulgatus (b) and B. longum (c) strains in vaginally delivered, and C-section delivered babies over time. In each row of mother-baby paired samples, each circle represents a detectable strain either identical to (filled) or distinct from (hollow) the maternal strain. Across the rows, identical strains are linked by a solid line representing early transmission and persistence to infancy, while the dashed line indicates late transmission.
Fig. 4
Fig. 4. Extensive and frequent colonisation of C-section delivered babies with diverse opportunistic pathogen species previously associated with healthcare infection.
a, The mean relative abundance (RA) and frequency (>1% RA) of six opportunistic pathogen species enriched in C-section born babies (n=596), compared to vaginal-born babies (n=606) during the first 21 days of life, in the context of the maternal level carriage (n=175). Error bars indicate the 95% CI of the mean RA. Statistical significance (P values indicated above) of the difference in RA and combined pathogen carriage frequency between vaginal and C-section babies was determined by two-sided Wilcoxon signed-rank test and Fisher’s exact tests, respectively. b, Phylogenetic representation of 836 bacterial strains cultured from raw faecal samples, including six opportunistic pathogens isolated five major genera: Enterococcus spp. (red, n=451); Clostridium spp. (yellow, n=24); Klebsiella spp. (blue, n=235), Enterobacter spp. (green, n=52) and Escherichia spp. (purple, n=41). c, Phylogeny of the BBS E. faecalis isolates (n=282) in the context of public isolates from the UK hospitals (n=168), human gut microbiotas (n=28) and environmental sources (n=27) with the high-risk UK epidemic lineage branches coloured in blue. Midpoint-rooted maximum likelihood tree is based on SNPs in 1,656 core genes. d, Diverse Enterobacter-Klebsiella complex strain populations among the BBS collection (n=202), in the context of the UK hospital (n=604), human gut microbiota (n=37) and environmental strains (n=120).

References

    1. Dominguez-Bello MG, et al. Delivery mode shapes the acquisition and structure of the initial microbiota across multiple body habitats in newborns. PNAS. 2010;107:11971–11975. - PMC - PubMed
    1. Tamburini S, Shen N, Wu HC, Clemente JC. The microbiome in early life: implications for health outcomes. Nat Med. 2016;22:713–722. - PubMed
    1. Chu DM, et al. Maturation of the infant microbiome community structure and function across multiple body sites and in relation to mode of delivery. Nat Med. 2017 doi: 10.1038/nm.4272. - DOI - PMC - PubMed
    1. Wampach L, et al. Birth mode is associated with earliest strain-conferred gut microbiome functions and immunostimulatory potential. Nat Commun. 2018;9 5091. - PMC - PubMed
    1. Koenig JE, et al. Succession of microbial consortia in the developing infant gut microbiome. Proc Natl Acad Sci USA. 2011;108(Suppl 1):4578–4585. - PMC - PubMed

Publication types

MeSH terms