. 2019 Aug 27:2019:1815371.
doi: 10.1155/2019/1815371. eCollection 2019.

Novelty and Novel Objects Increase c-Fos Immunoreactivity in Mossy Cells in the Mouse Dentate Gyrus

Affiliations

Novelty and Novel Objects Increase c-Fos Immunoreactivity in Mossy Cells in the Mouse Dentate Gyrus

Hannah L Bernstein et al. Neural Plast. .

Abstract

The dentate gyrus (DG) and its primary cell type, the granule cell (GC), are thought to be critical to many cognitive functions. A major neuronal subtype of the DG is the hilar mossy cell (MC). MCs have been considered to play an important role in cognition, but in vivo studies to understand the activity of MCs during cognitive tasks are challenging because the experiments usually involve trauma to the overlying hippocampus or DG, which kills hilar neurons. In addition, restraint typically occurs, and MC activity is reduced by brief restraint stress. Social isolation often occurs and is potentially confounding. Therefore, we used c-fos protein expression to understand when MCs are active in vivo in socially housed adult C57BL/6 mice in their home cage. We focused on c-fos protein expression after animals explored novel objects, based on previous work which showed that MCs express c-fos protein readily in response to a novel housing location. Also, MCs are required for the training component of the novel object location task and novelty-encoding during a food-related task. GluR2/3 was used as a marker of MCs. The results showed that MC c-fos protein is greatly increased after exposure to novel objects, especially in ventral DG. We also found that novel objects produced higher c-fos levels than familiar objects. Interestingly, a small subset of neurons that did not express GluR2/3 also increased c-fos protein after novel object exposure. In contrast, GCs appeared relatively insensitive. The results support a growing appreciation of the role of the DG in novelty detection and novel object recognition, where hilar neurons and especially MCs are very sensitive.


Conflict of interest statement

The authors declare that they have no conflicts of interest.

Figures

Figure 1
Figure 1
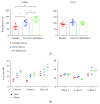
Experimental timeline for the comparison of control and novel object exposure. (a) For animals exposed to novel objects, 2 animals were housed together for over 2 weeks. They were brought to the laboratory and housed there until the next day when they were placed on a lab bench, the cage lid was removed, and 2 identical LEGO objects were placed in the cage center about 6 inches apart. After 5 min, the objects were removed. After 90 min, one animal was perfusion fixed, and 20 min later the remaining animal was perfused. For this series of experiments, mice were not acclimated to objects prior to testing. (b) For control mice, procedures were the same as (a), but objects were not placed in the cage.
Figure 2
Figure 2
Experimental timeline for the comparison of familiar and novel object conditions. (a,1) For animals exposed to novel objects, 2 animals were housed together for over 2 weeks. They were brought to the laboratory and housed there until the next day, Day 1. On Day 1, the cage lid was removed, and 2 objects were placed in the cage center about 6 inches apart. After 5 min, the objects were removed. This was repeated so that there were 3 exposures for 5 min, one hour apart. (a, 2) For animals exposed to familiar objects, a similar procedure was used, but the objects were different. (a, 3) For animals with no habituation, no objects were presented to the animal on Day 1. (b, 1) For animals exposed to novel objects, procedures on Day 2 were similar to Day 1 but the objects were different. Also, after objects were removed, one animal was perfused 90 min after object exposure began, and the second was perfused at 110 min. (b, 2) For animals exposed to familiar objects, procedures were the same as Day 1. However, object exposure occurred once, and one mouse was perfused 90 min after object exposure and the other was perfused at 110 min. (b, 3) For the no habituation group, novel objects were placed in the cage on Day 2. One mouse was perfused 90 min after object exposure and the other was perfused at 110 min.
Figure 3
Figure 3
Hilar c-fos+ cells after exposure to novel objects. (a, 1) A section through the ventral hippocampus is shown. There are few c-fos+ cells in the hilus of a control mouse. Calibrations: 75 μm (main image, left) and 50 μm (inset, right). HIL: hilus; GCL: granule cell layer; CA3: area CA3 pyramidal cell layer. (a, 2) In a mouse exposed to novel objects as described in Figure 1, there were many c-fos+ cells in the hilus (arrows). Same calibrations as (a, 1). (b, 1) A dorsal section shows little c-fos+ hilar cells in the control. (b, 2) Numerous hilar c-fos+ cells are present in the dorsal section of a mouse exposed to novel objects (arrows; as described in Figure 1). Calibrations: 75 μm (main image, left) and 60 μm (inset, right).
Figure 4
Figure 4
Quantitative differences in hilar c-fos+ cells between control mice and mice exposed to novel objects. (a, 1) The mean number of hilar c-fos+ cells is listed according to their septotemporal location. A RMANOVA showed a significant effect of the behavioral task (control vs. novel object: F(1, 70) = 27.90; p = 0.0005) and a significant effect of the septotemporal location (relatively ventral or dorsal: F(7, 70) = 5.52; p < 0.0001) but no interaction of factors (F(7, 70) = 1.17; p = 0.333). (a, 2) The values for hilar c-fos+ cells in the 4 most ventral and 4 most dorsal sections were pooled and were listed as ventral and dorsal, respectively. The total (ventral+dorsal) is listed as well. A two-way ANOVA showed a significant effect of the behavioral task (control vs. novel object: F(1, 20) = 42.35; p < 0.0001). There was a significant effect of septotemporal location (F(1, 20) = 9.64; p = 0.006) with the novel object group showing significantly more ventral than dorsal c-fos protein expression (Tukey's post hoc test, p < 0.05) and no interaction of factors (F(1, 20) = 2.41; p = 0.136). Totals were significantly different (Student's t-test; t = 5.292; df 10; p = 0.0004). (b, 1) The mean number of c-fos+ cells in the GCL is listed according to their septotemporal location (ventral or dorsal). A RMANOVA showed no significant effect of the behavioral task (control vs. novel object: F(1, 70) = 1.28; p = 0.285) and a significant effect of the septotemporal location (F(7, 70) = 46.96; p < 0.0001). There was no interaction of factors (F(7, 70) = 0.436; p = 0.875). (b, 2) The values for GCL c-fos+ cells in the 4 most ventral and 4 most dorsal sections are pooled and are shown; average total values (ventral+dorsal) are also presented. A two-way ANOVA showed no significant effect of the behavioral task (F(1, 20) = 1.37; p = 0.256). There were more dorsal than ventral c-fos+ GCs (F(1,20) = 69.07; p < 0.0001; Tukey's post hoc test, p < 0.05) and no interaction of factors (F(1, 20) = 1.145; p = 0.294). Totals were not significantly different (Student's t-test; t = 1.87; df 10; p = 0.091).
Figure 5
Figure 5
The majority of hilar c-fos+ cells were double labeled for a marker of glutamatergic neurons, GluR2/3, suggesting that they were MCs. (a, 1) A dorsal section from a control mouse double labeled for c-fos (black) and GluR2/3 (orange). Few double-labeled cells are present in the hilus. Calibration: 100 μm. MOL=molecular layer. (a, 2) A dorsal section of a mouse exposed to novel objects shows more double-labeled hilar cells. Calibration: 100 μm. (a, 3) Inset: at higher gain. Double-labeled cells (arrows) and cells only expressing GluR2/3 (arrowhead) are shown. Calibration: 25 μm. (b, 1) The mean value for hilar c-fos+ cells is listed for 4 controls and 4 mice exposed to novel objects (NO). The differences were significant (t-test: t = 2.37, df 6; p = 0.025). (b, 2) The mean value for hilar c-fos+/GluR2/3+ double-labeled cells is shown for the same mice as (b, 1). Differences were significant (t-test: t = 3.96, df 6; p = 0.007). (b, 3) The mean value of hilar double-labeled cells (presumably MCs) as a fraction of all hilar c-fos+ cells is expressed as a percent. Differences were significant (t-test: t = 3.59, df 6; p = 0.011). (c, 1) Values for c-fos+ hilar cells are plotted along the septotemporal axis for 8 sections selected at intervals throughout the axis. These data suggest that the differences in groups were mainly ventral, which was also observed in (c, 2) and (c, 3). Some control sections showed no c-fos+ cells in the hilus, so the most ventral sections and the most dorsal sections were pooled. A two-way ANOVA showed a significant effect of condition (control vs. novel object: F(1, 12) = 17.19; p = 0.001) and no effect of ventral vs. dorsal position (F(1, 12) = 3.78; p = 0.076). There was a trend towards an interaction between condition and position (F(1, 12) = 4.51; p = 0.055) which appeared to underlie a significant difference in post hoc tests comparing ventral location. Thus, Tukey's post hoc test showed a significant difference in the ventral but not dorsal locations.
Figure 6
Figure 6
Hilar c-fos labeling is weak in mice exposed to familiar objects compared to novel objects and very strong when mice had not been previously exposed to objects. Three sections are shown with insets showing more detail. The sections are from comparable dorsoventral levels. Mice were either exposed to familiar objects (a) or novel objects (b) or had not been exposed previously to objects (c). Arrows point to c-fos ir hilar cells. Calibrations: 100 μm. MOL=molecular layer.
Figure 7
Figure 7
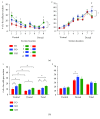
Hilar c-fos labeling is greatest in animals exposed to novelty and relatively unaffected in the GCL. (a) Hilar c-fos labeled cells are shown for the following 3 groups (mean, SD): mice exposed to familiar objects (FO), mice exposed to novel objects (NO), and mice with no prior exposure to objects (no habituation; NH). (a, 1) Hilar c-fos-labeled cell counts were normalized to the mean of the cohort. A one-way ANOVA showed a significant effect of exposure (F(2, 16) = 17.45; p < 0.0001) with the c-fos+ cells of the familiar group significantly less than the novel object group (p = 0.014) and no habituation group (p = 0.0001). The novel object group showed significantly fewer c-fos cells than the group with no habituation (p = 0.044). (a, 2) Normalized GCL c-fos+ cell counts did not exhibit statistical differences (one-way ANOVA, F(2, 16) = 2.33; p = 0.131). (b) Comparison of FO, NO, and NH for 3 cohorts. (b, 1) Hilar c-fos cell numbers are shown for all animals. The data are organized into 3 cohorts, with 2 animals/behavior for each cohort. Data for individual animals are designated by circles; means are indicated by bars between the circles. Red: FO; blue: NO; green: NH. Note the same pattern for each cohort, i.e., FO<NO<NH. (b, 2) c-Fos cell numbers are shown for the GCL. Data for each cohort do not indicate a consistent difference between FO, NO, and NH.
Figure 8
Figure 8
Septotemporal distribution of hilar and GCL c-fos expression in response to familiar objects (FO), novel objects (NO), and no habituation (NH). (a, 1) The numbers of c-fos+ hilar cells are shown for the same animals as Figure 5, plotted from the most ventral [34] to dorsal [56] levels. A two-way RMANOVA showed a significant effect of the task (FO: red; NO: blue; NH: green; F(2, 105) = 6.25; p = 0.011) and ventral-dorsal location (F(7, 105) = 19.06; p < 0.0001), and there was no interaction of factors (F(14, 105) = 1.68; p = 0.071). Tukey's post hoc tests showed significance (p < 0.05) at discrete locations along the septotemporal axis as indicated by symbols. Asterisk (∗) = NH > FO; dollar sign ($) = NH > NO; number symbol (#) = NO > NH; at sign (@) = NO > FO. (a, 2) Data are shown for GCL c-fos+ cells. A two-way RMANOVA showed no statistical effect of the task (F(2, 105) = 0.86; p = 0.441), but it showed a significant effect of the ventral-dorsal location (F(7, 105) = 105.50; p < 0.0001) with the most dorsal level exhibiting differences by Tukey's post hoc tests (p < 0.05). There was a significant interaction (F(14, 105) = 2.17; p = 0.014) because only the most dorsal level showed significant differences between the tasks by Tukey's post hoc tests. (b, 1) An analysis of the data from (a) is shown, pooling all ventral sections [5, 34, 35, 89] and comparing them to all dorsal sections [1, 57, 65, 73]. Totals are also shown (all 8 sections). A two-way ANOVA showed significant ventral-dorsal differences (F(1, 15) = 62.58; p < 0.0005) and a significant effect of the task (FO, NO, or NH: F(2, 15) = 29.52; p < 0.0001). There was no interaction of factors (F(2, 15) = 1.57; p = 0.253). Tukey's post hoc tests showed the significant differences of each task when comparisons were made of ventral vs. dorsal levels (e.g., ventral FO vs. dorsal FO, ventral NO vs. dorsal NO). For the ventral data, there were additional significant differences between FO and NO as well as FO and NH. For the dorsal data, FO vs. NH was significant by Tukey's post hoc test. A one-way ANOVA for pooled data (total) showed significant differences between tasks (F(2, 15) = 6.25; p = 0.011) and Tukey's post hoc tests were significant for all comparisons (FO vs. NO, FO vs. NH, and NO vs. NH). (b, 2) The ventral and dorsal data for the GCL are shown. A two-way ANOVA showed ventral-dorsal differences (F(1, 15) = 144.8; p < 0.0001) but no differences between tasks (F(2, 15) = 2.51; p = 0.126) and no interaction (F(2, 15) = 3.08; p = 0.091). Within ventral levels, there were no differences between tasks. For dorsal levels, FO vs. NO was significant. When all levels were pooled (total), a one-way ANOVA showed no significant differences between tasks (F(2, 15) = 1.75; p = 0.208).

References

    1. Bakker A., Kirwan C. B., Miller M., Stark C. E. L. Pattern separation in the human hippocampal CA3 and dentate gyrus. Science. 2008;319(5870):1640–1642. doi: 10.1126/science.1152882. - DOI - PMC - PubMed
    1. Knierim J. J., Neunuebel J. P. Tracking the flow of hippocampal computation: pattern separation, pattern completion, and attractor dynamics. Neurobiology of Learning and Memory. 2016;129:38–49. doi: 10.1016/j.nlm.2015.10.008. - DOI - PMC - PubMed
    1. Leutgeb J. K., Leutgeb S., Moser M. B., Moser E. I. Pattern separation in the dentate gyrus and CA3 of the hippocampus. Science. 2007;315(5814):961–966. doi: 10.1126/science.1135801. - DOI - PubMed
    1. Myers C. E., Scharfman H. E. A role for hilar cells in pattern separation in the dentate gyrus: a computational approach. Hippocampus. 2009;19(4):321–337. doi: 10.1002/hipo.20516. - DOI - PMC - PubMed
    1. Anacker C., Hen R. Adult hippocampal neurogenesis and cognitive flexibility — linking memory and mood. Nature Reviews Neuroscience. 2017;18(6):335–346. doi: 10.1038/nrn.2017.45. - DOI - PMC - PubMed

Publication types

Substances

LinkOut - more resources