. 2019 Apr 15;5(5):358-369.
doi: 10.1038/s41558-019-0456-2.

Contributions of GRACE to understanding climate change

Affiliations

Contributions of GRACE to understanding climate change

Byron D Tapley et al. Nat Clim Chang. .

Abstract

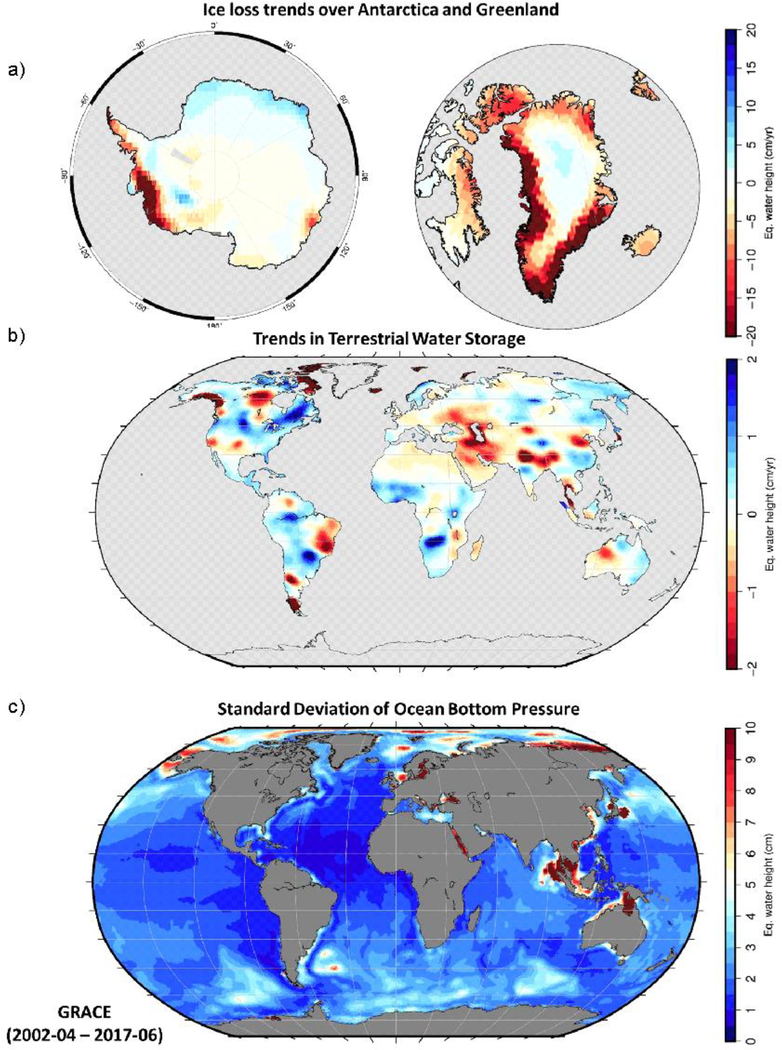
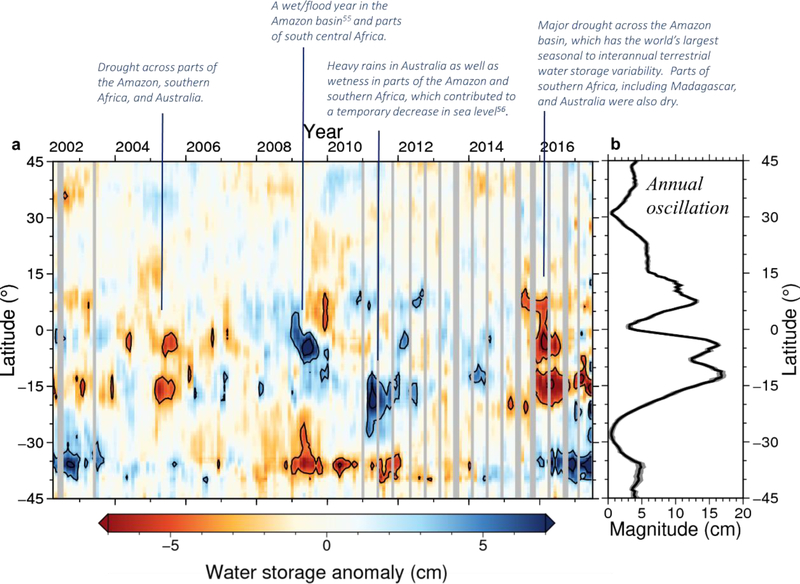
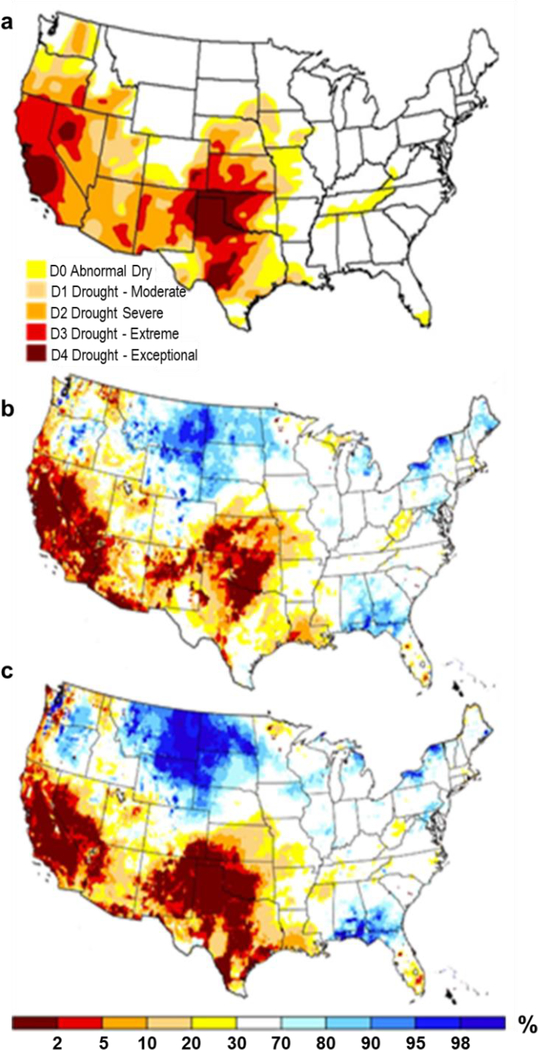
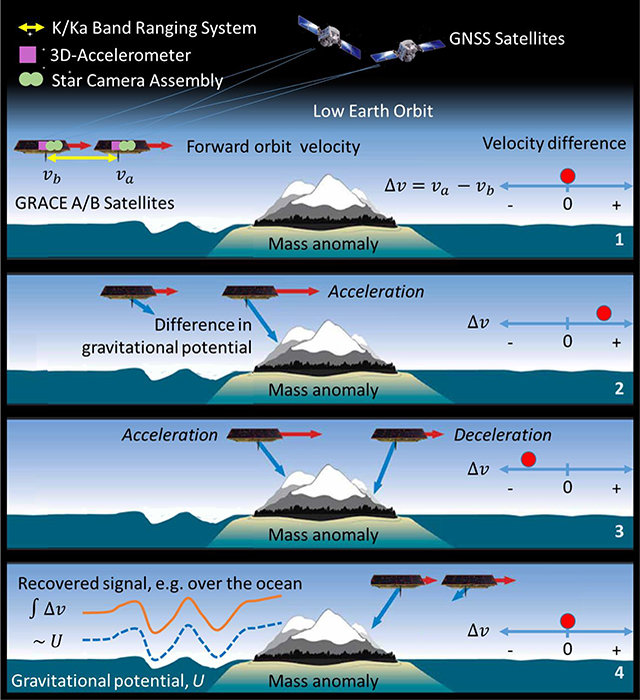
Time-resolved satellite gravimetry has revolutionized understanding of mass transport in the Earth system. Since 2002, the Gravity Recovery and Climate Experiment (GRACE) has enabled monitoring of the terrestrial water cycle, ice sheet and glacier mass balance, sea level change and ocean bottom pressure variations and understanding responses to changes in the global climate system. Initially a pioneering experiment of geodesy, the time-variable observations have matured into reliable mass transport products, allowing assessment and forecast of a number of important climate trends and improve service applications such as the U.S. Drought Monitor. With the successful launch of the GRACE Follow-On mission, a multi decadal record of mass variability in the Earth system is within reach.


Conflict of interest statement

Competing financial interests The authors declare no competing financial interests.

Figures

Fig. 1:
Fig. 1:
Global representation of trends and variability in ice and water mass recovered by GRACE over 15 years. a, the trend maps over Antarctica, Greenland and the part of the Arctic mainly represent changes in ice mass. b, the trend map mainly represents changes in the terrestrial water storage, as well as large trends due to glacier ice loss from continental areas, such as Alaska, Patagonia, Arctic Canada, etc.. The trends of the terrestrial water storage are partially related to climate variability causing floods and droughts, but also reflect e.g. long-term changes in groundwater depletion by human activity. c, standard deviation of the ocean bottom pressure obtained as the sum of mainly high resolution information of the ocean background model used in the GRACE data processing plus corrections of the background model from GRACE,which are particularly relevant in the southern oceans and the Arctic Ocean. From the color scale on the plots a, b, the red colors represent mass loss and the blue represents mass gain. In plot c, the color scales represent variability with the highest variability shown by the red colors. The data source is CSR RL05M Mascons. A glacial-isostatic adjustment (GIA) correction has been subtracted in a and b. Details on the data shown are presented in Additional information.
Fig. 2.
Fig. 2.
GRACE observations of mass change of the Polar ice sheets between April 2002 and June 2017. Annual mass balance of the a, Greenland Ice Sheet and the b, Antarctic Ice Sheet. Time series of mass change of the, c, Greenland Ice Sheet and the, d, Antarctic Ice Sheet (black), as well as the region of the Amundsen Sea Embayment only (red). Updated from Sasgen et al.,. The data source is CSR RL05. Details on the data shown are presented in Additional information.
Fig. 3:
Fig. 3:
GRACE zonal mean of terrestrial water storage anomalies (cm equivalent water height) for April 2002 to June 2017. a, The time series of anomalies after subtracting an annual periodic component, offset and linear trend. Contour levels are at ± 4 and ± 8 cm. b, The magnitude of the annual oscillation. Based on CSR RL05M Mascons. Details on the data shown are presented in Additional information.
Fig. 4:
Fig. 4:
Global mean sea-level (GMSL) observed with satellite altimetry, GRACE and Argo floats for the time period 2005 until end of 2016. Shown are the observed sea-level change from altimetry (black) and the total sea-level change (blue) calculated as the sum of the mass (orange) and volume (red) components. The ocean mass changes are recovered with GRACE, temperature-driven volume (thermosteric) changes are estimated from Argo floats. The black line shows the sum of the mass and volume changes. The values represent three-month (seasonal means), i.e. January, February March; April, May, June; July, August, September; October, November, December. Updated from Chambers . Details on the data shown are presented in Additional information.
Fig. 5:
Fig. 5:
Operational drought monitoring supported by GRACE. a, Comparison of the U.S. Drought Monitor map for 20 May 2014 with the, b, GRACE data assimilation based root zone soil moisture and, c, shallow groundwater wetness/drought indicators for 19 May 2014. The scale bar for the latter two describes current wet or dry conditions, expressed as a percentile showing the probability of a given location being dryer at present than at the same time of year during the period of record from 1948 to the present.
Box 1:
Box 1:
The GRACE and GRACE-Follow-On measurement is implemented by two identical satellites (GRACE A/B) orbiting one behind the other in a near-polar orbit plane. The along-track separation is kept within a range of 220 ± 50 km. The satellites experience positive and negative gravitationally induced along-track accelerations due to the varying mass distribution underneath. Each satellite will experience the effects of the local mass, i.e. the associated change in a surface of constant gravitational potential U, at slightly different times, causing a differential acceleration. The differential acceleration in turn causes distance (range) variations and velocity differences Δv that are proportional to the mass attraction. The relative distance between the satellites is measured with micron level precision by a high accuracy inter-satellite K/Ka band ranging system. An accurate three-axis accelerometer measures the effects of all non-gravitational forces acting on each satellite, including atmospheric drag, direct and Earth reflected solar radiation pressure and thrusting. A GPS receiver on each satellite provides position and time synchronization, and a dual star camera assembly gives information on the satellites’ orientation in space. The satellites overfly the entire Earth surface within approximately 30 days, allowing monthly estimates of a global gravity model with a surface spatial resolution of typically 300 km with an accuracy of 2 cm.

References

    1. Tapley BD, Bettadpur S, Watkins M & Reigber C The gravity recovery and climate experiment: Mission overview and early results. Geophys. Res. Lett 31, (2004).
    1. National Research Council. Satellite gravity and the geosphere: contributions to the study of the solid Earth and its fluid envelopes. (National Academies Press, 1997).
    1. Marti U Gravity, Geoid and Height Systems: Proceedings of the IAG Symposium GGHS2012, October 9–12, 2012, Venice, Italy: 141, (Springer, 2015).
    1. Save H, Bettadpur S & Tapley BD High-resolution CSR GRACE RL05 mascons. J. Geophys. Res. Solid Earth 121, 7547–7569 (2016).
    1. Luthcke SB et al. Recent Greenland ice mass loss by drainage system from satellite gravity observations. Science 314, 1286–1289 (2006). - PubMed