. 2019 Jul 28;9(19):5517-5531.
doi: 10.7150/thno.33876. eCollection 2019.

Focused ultrasound activates voltage-gated calcium channels through depolarizing TRPC1 sodium currents in kidney and skeletal muscle

Affiliations

Focused ultrasound activates voltage-gated calcium channels through depolarizing TRPC1 sodium currents in kidney and skeletal muscle

Scott R Burks et al. Theranostics. .

Erratum in

Abstract

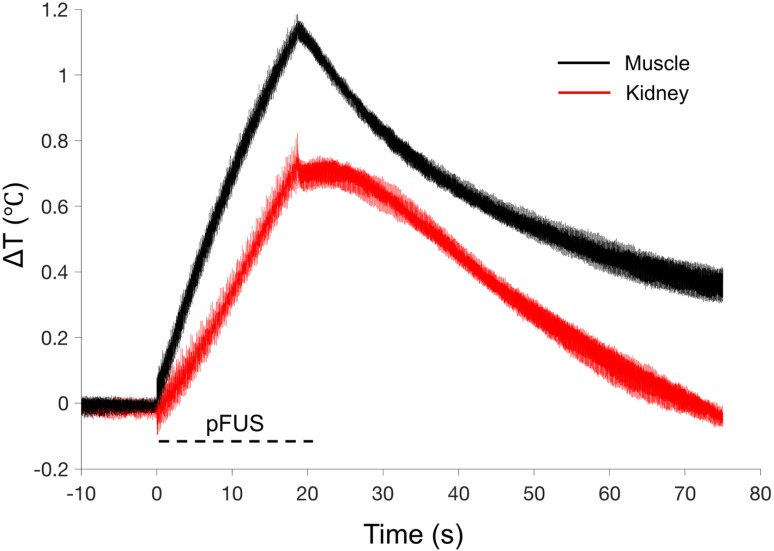
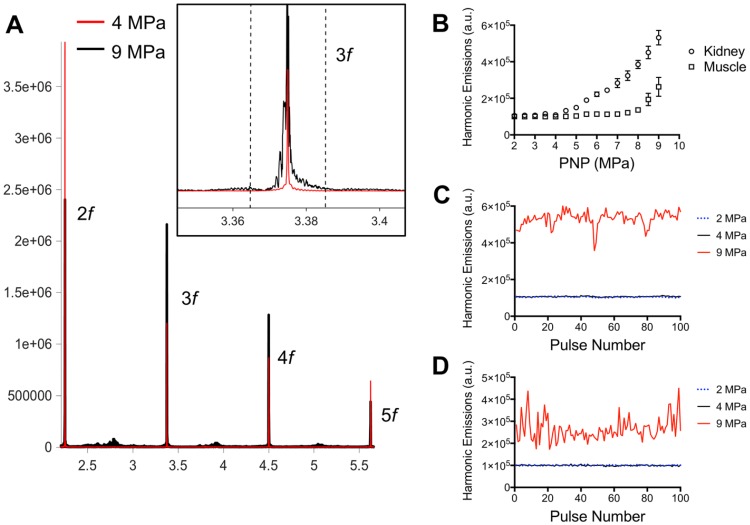
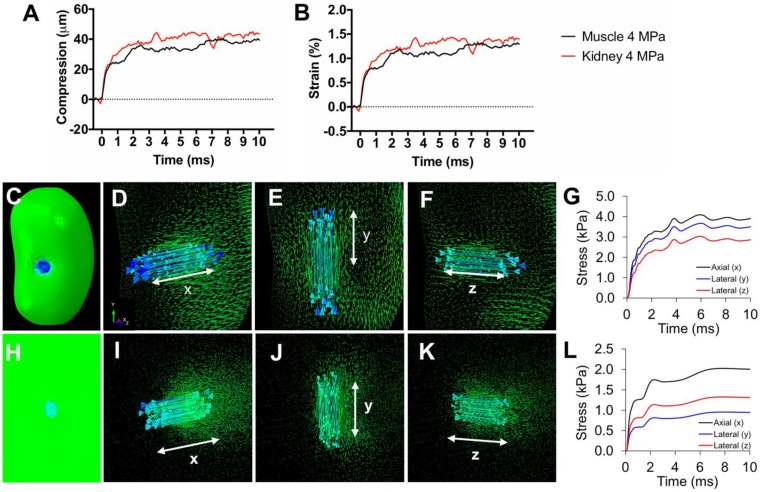
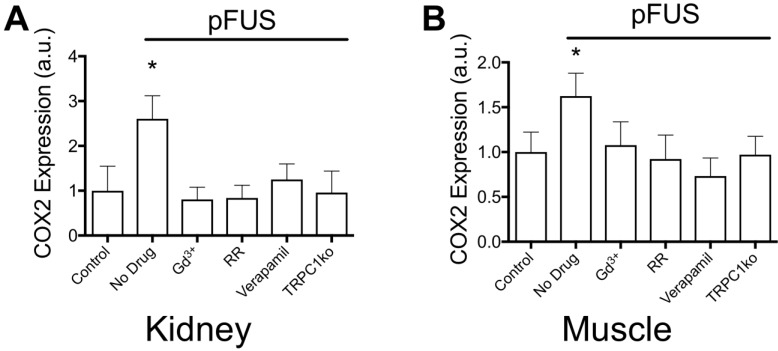
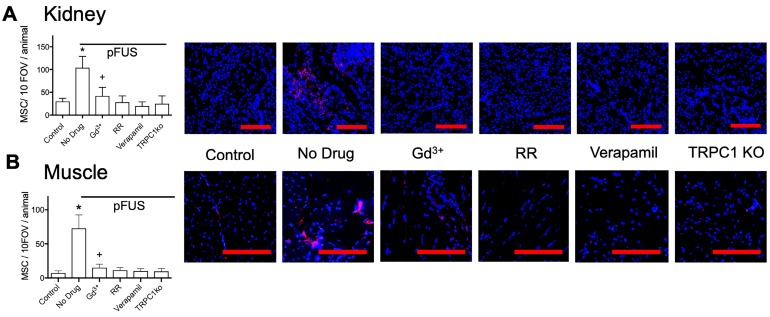
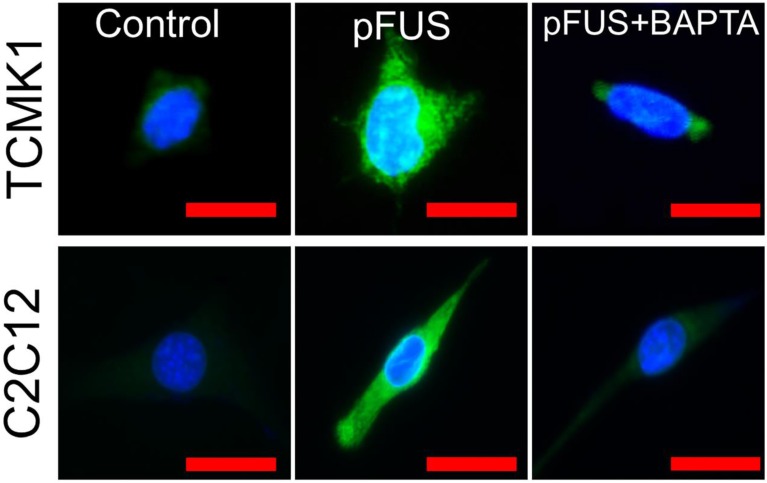
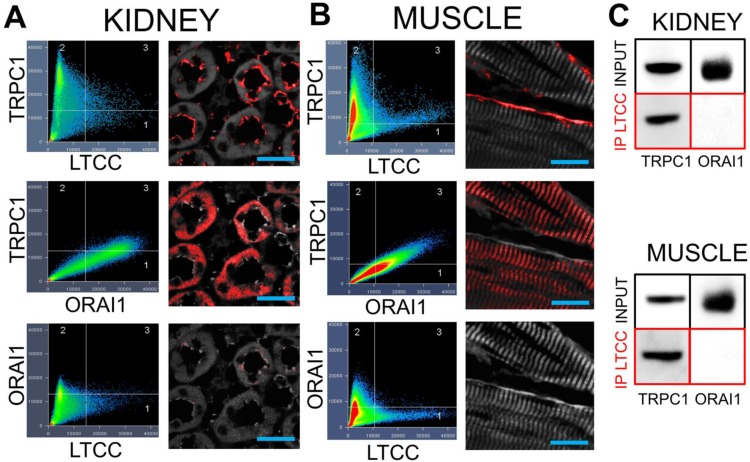
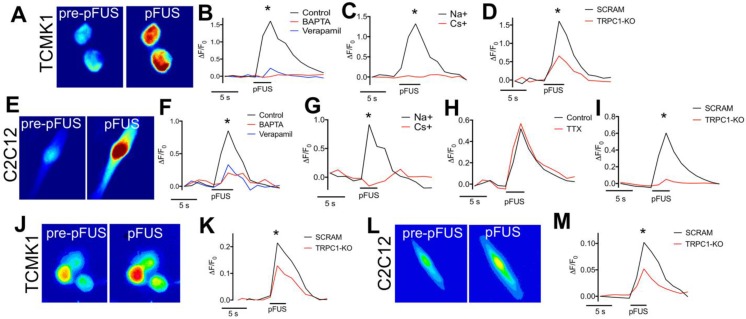
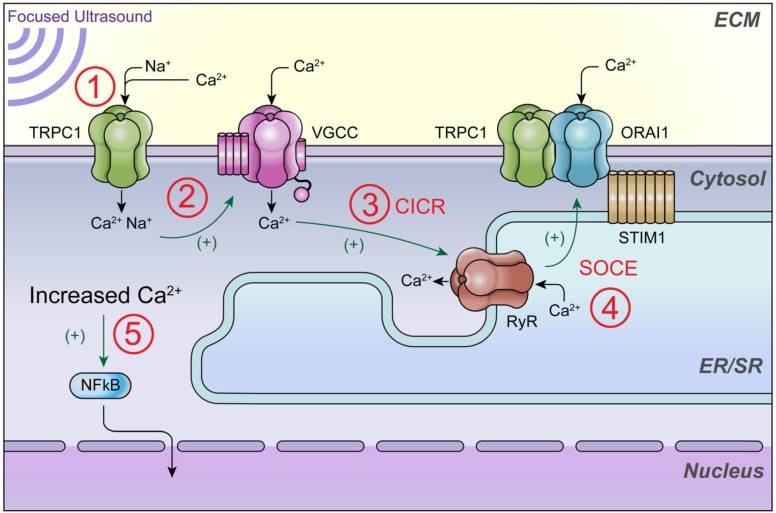
Pulsed focused ultrasound (pFUS) technology is being developed for clinical neuro/immune modulation and regenerative medicine. Biological signal transduction of pFUS forces can require mechanosensitive or voltage-gated plasma membrane ion channels. Previous studies suggested pFUS is capable of activating either channel type, but their mechanistic relationship remains ambiguous. We demonstrated pFUS bioeffects increased mesenchymal stem cell tropism (MSC) by altering molecular microenvironments through cyclooxygenase-2 (COX2)-dependent pathways. This study explored specific relationships between mechanosensitive and voltage-gated Ca2+ channels (VGCC) to initiate pFUS bioeffects that increase stem cell tropism. Methods: Murine kidneys and hamstring were given pFUS (1.15 or 1.125 MHz; 4MPa peak rarefactional pressure) under ultrasound or magnetic resonance imaging guidance. Cavitation and tissue displacement were measure by hydrophone and ultrasound radiofrequency data, respectively. Elastic modeling was performed from displacement measurements. COX2 expression and MSC tropism were evaluated in the presence of pharmacological ion channel inhibitors or in transient-receptor-potential-channel-1 (TRPC1)-deficient mice. Immunohistochemistry and co-immunoprecipitation examined physical channel relationships. Fluorescent ionophore imaging of cultured C2C12 muscle cells or TCMK1 kidney cells probed physiological interactions. Results: pFUS induced tissue deformations resulting in kPa-scale forces suggesting mechanical activation of pFUS-induced bioeffects. Inhibiting VGCC or TRPC1 in vivo blocked pFUS-induced COX2 upregulation and MSC tropism to kidneys and muscle. A TRPC1/VGCC complex was observed in plasma membranes. VGCC or TRPC1 suppression blocked pFUS-induced Ca2+ transients in TCMK1 and C2C12 cells. Additionally, Ca2+ transients were blocked by reducing transmembrane Na+ potentials and observed Na+ transients were diminished by genetic TRPC1 suppression. Conclusion: This study suggests that pFUS acoustic radiation forces mechanically activate a Na+-containing TRPC1 current upstream of VGCC rather than directly opening VGCC. The electrogenic function of TRPC1 provides potential mechanistic insight into other pFUS techniques for physiological modulation and optimization strategies for clinical implementation.

Keywords: Acoustic radiation force; Calcium signaling; Cavitation; Depolarization; Mechanotransduction; Transient Receptor Potential Channel 1; Voltage-Gated Calcium Channels; focused ultrasound.


Conflict of interest statement

Competing Interests: The authors have declared that no competing interest exists.

Figures

FIGURE 1
FIGURE 1
Thermal effects of pFUS in murine kidney and hamstring muscle. Average temperature changes during pFUS sonication of muscle (black line) and kidney (red line) during pFUS. Black dashed line indicates time during sonication (n=9 sonications per tissue type). The range of temperatures at the onset of each pFUS treatment was 36.106-37.224 ºC for kidney and 35.104-37.409 ºC for muscle.
Figure 2
Figure 2
Acoustic emissions during pFUS sonications of muscle and kidney. A) Representative hydrophone spectra showing emissions at 2f-5f of the fundamental frequency (1.125 MHz) during pFUS to kidney tissue at 4 (red) or 9 (black) MPa PNP. Inset example show detail of the emissions at 3.375 MHz and black dashed lines indicated the bounds of the 20 kHz window where FFT amplitudes were integrated. The total FFT amplitude measured within 20 kHz windows around 2f, 3f, 4f, and 5f represented the value for “Harmonic Emissions” displayed in B-D. B) Harmonic emissions from 20 kHz windows around 2f-5f as a function of PNP in muscle or kidney. Previously unsonicated muscle or kidneys received 100 10 ms-pulses at each PNP. Emissions at 4 MPa in both tissues were statistically similar to emissions at 2 MPa. Increases in emission amplitudes were detected at PNP ≥5 MPa in kidneys and ≥ 8.5 MPa in muscle. Harmonic emissions in C) kidney or D) muscle as a function of pulse number during 100 pulse treatments at 2, 4, or 9 MPa PNP. Values for 4 MPa are similar to those at 2 MPa.
FIGURE 3
FIGURE 3
Tissue strain and FEA modeling of tissue stresses during pFUS. Representative traces of A) compression and B) axial strain of kidneys and muscle during 10 ms sonication. C) Contour map of a kidney showing axial principle stress component (axis of pFUS propagation). Vector maps of stresses are shown for the (D) axial and (E, F) both lateral directions indicated by white arrows. G) Principle stresses at the center of the pFUS focus during a 10 ms sonication of the kidney. H) Contour map of hamstring muscle showing axial principle stress component. Vector maps of stresses are shown for the (I) axial and (J,K) both lateral directions indicated by white arrows. L) Principle stresses at the center of the pFUS focus during a 10 ms sonication of the hamstring.
FIGURE 4
FIGURE 4
COX2 expression in (A) kidney and (B) muscle homogenates at 6 hours post-pFUS. COX2 expression increased when pFUS is administered to muscle or kidney of mice that receive no drugs. COX2 expression following pFUS was suppressed in wild-type mice that received intravenous GdCl3 (300 μg/kg), Ruthenium Red (RR; 22 mg/kg), or intraperitoneal verapamil (5 mg/kg) prior to pFUS and untreated TRPC1-KO mice (n=6 mice per group; separate cohorts were used for muscle and kidney treatments) (* p<0.05 by ANOVA). For presentation, control samples represent values from unsonicated tissues in mice that received no drugs or TRPC1-ko. These values were not significantly different from unsonicated tissues in mice that received drugs or TRPC1-ko (See Supplemental Data).
FIGURE 5
FIGURE 5
MSC homing to (A) kidney and (B) muscle at 24 hours post-pFUS. Mice received IV-infusions of 106 human MSC 4 h post-pFUS and then were euthanized the following day. Kidney and muscle histology were stained for human mitochondria (red) to detect and quantify MSC (nuclei shown in blue). MSC were quantified in 10 fields-of-view in each of 3 histological slices per mouse from 3 mice. pFUS significantly increased MSC homing to wild-type kidneys and muscles, but homing was significantly suppressed in wild-type mice that received intravenous GdCl3 (300 μg/kg), Ruthenium Red (RR; 22 mg/kg), or intraperitoneal verapamil (5 mg/kg) prior to pFUS and untreated TRPC1-KO mice. Mice treated with GdCl3 had significantly more cells than control mice (no pFUS), but still had significantly fewer MSC than pFUS-treated mice that received no drug (*, + = p<0.05 by ANOVA) (scale bars represent 100 μm for kidney images and 50 μm for muscle images). For presentation, control samples represent values from unsonicated tissues in mice that received no drugs or TRPC1-ko. These values were not significantly different from unsonicated tissues in mice that received drugs or TRPC1-ko (See Supplemental Data).
FIGURE 6
FIGURE 6
COX2 upregulation by pFUS in TCMK1 and C2C12 cells is dependent on intracellular Ca2+. Cultured TCMK1 or C2C12 cells were treated with pFUS and then immunostained for COX2 (green) 24 hours post-treatment (nuclei shown in blue). pFUS upregulated COX2 in both cell types and upregulations were blocked when both cell types were loaded with BAPTA-AM prior to pFUS (scale bars represent 10 μm).
FIGURE 7
FIGURE 7
TRPC1 and LTCC form complexes without ORAI1 in kidneys and muscle. Confocal imaging for TRPC1, LTCC, and ORAI in (A) kidney and (B) muscle. Identical intensity thresholds were used for all groups within each tissue type to determine pixel colocalization (quadrant 3 in each image). Colocalized pixels for each comparison are shown in red and background pixels shown in grey. Comparing TRPC1 and LTCC reveals colocalizations on what appears to be the apical surfaces of tubular epithelium and the plasma membrane of skeletal muscle fibers. Substantial colocalization of TRPC1 and ORAI1 is observed, but in different cellular regions than the TRPC1/LTCC pixels. Lastly, there is essentially no colocalization between LTCC and ORAI1 (scale bars represent 20 μm). C) Immunoprecipitation of the LTCC from both tissue types precipitates associated TRPC1 molecules, but not ORAI1 molecules.
FIGURE 8
FIGURE 8
Fluorescent ionophore imaging of TCMK1 and C2C12 cells during pFUS. Representative Fluo-4 images of (A) TCMK1 and (E) C2C12 cells before and during pFUS. (B, F) Quantification of fluorescence intensities reveal that pFUS significantly increases Fluo-4 intensities in both cell types and Fluo-4 transients are effectively blocked loading with BAPTA-AM or incubating cells with 2 μM verapamil. (C, G) Partial replacement of Na+ in the extracellular solution with Cs+ also blocked Fluo-4 Ca2+ transients in both cell types, demonstrating dependence of Ca2+ transients on transmembrane Na+ potential. (H) Na+-dependent Fluo-4 Ca2+ transients were not affected by incubating C2C12 cells with 1 μM tetrodotoxin (TTX). (D, I) TRPC1 suppression by shRNA knockdown in each cell type resulted in diminished Fluo-4 Ca2+ transients compared to cells transfected with scramble control shRNA sequences. (J, L) Representative CoroNa transients during pFUS of TCMK1 and C2C12 cells. TRPC1 suppression in (K) TCMK1 cells or (L) C2C12 cells led to diminished CoroNa Green Na+ transients compared to cells transfected with scramble control shRNA sequences. (* = p<0.05 by t-test for pairwise comparisons or ANOVA for multiple comparisons).
Figure 9
Figure 9
Schematic of intracellular Ca2+ signaling that generates ultrasound bioeffects for enhanced MSC homing. This study demonstrates that 1) pFUS mechanically activates cationic TRPC1 channels that conduct depolarizing currents and 2) activate nearby VCGG to amplify cytosolic Ca2+ concentrations. Other potential but uninvestigated downstream mediators of cytosolic Ca2+ influx could be 3) Ca2+-induced Ca2+-release (CICR) through ryanodine receptors (RyR) following VGCC activation and 4) the TRPC1/ORAI1/STIM1 complex, which may be involved in downstream store operated Ca2+ entry (SOCE) following potential ER/SR depletion. 5) The ultimate effect of increased cytosolic Ca2+ is activation of nuclear factor κ B (NFκB) which generates molecular responses (including COX2) necessary to generate the variety of cytokines, chemokines, trophic factors, and cell adhesion molecules that are necessary to induce tropism of infused MSC .

References

    1. Kennedy JE. High-intensity focused ultrasound in the treatment of solid tumours. Nat Rev Cancer. 2005;5:321–7. - PubMed
    1. Hancock HA, Smith LH, Cuesta J, Durrani AK, Angstadt M, Palmeri ML. et al. Investigations into pulsed high-intensity focused ultrasound-enhanced delivery: preliminary evidence for a novel mechanism. Ultrasound Med Biol. 2009;35:1722–36. - PMC - PubMed
    1. O'Neill BE, Vo H, Angstadt M, Li KP, Quinn T, Frenkel V. Pulsed high intensity focused ultrasound mediated nanoparticle delivery: mechanisms and efficacy in murine muscle. Ultrasound Med Biol. 2009;35:416–24. - PMC - PubMed
    1. Xu Z, Raghavan M, Hall TL, Chang CW, Mycek MA, Fowlkes JB. et al. High speed imaging of bubble clouds generated in pulsed ultrasound cavitational therapy-histotripsy. IEEE Trans Ultrason Ferroelectr Freq Control. 2007;54:2091–101. - PMC - PubMed
    1. Wu J, Nyborg WL. Ultrasound, cavitation bubbles and their interaction with cells. Adv Drug Deliv Rev. 2008;60:1103–16. - PubMed