. 2019 Aug 14;9(20):5956-5975.
doi: 10.7150/thno.33872. eCollection 2019.

Mesenchymal stem cell-derived exosomes as a nanotherapeutic agent for amelioration of inflammation-induced astrocyte alterations in mice

Affiliations

Mesenchymal stem cell-derived exosomes as a nanotherapeutic agent for amelioration of inflammation-induced astrocyte alterations in mice

Panpan Xian et al. Theranostics. .

Abstract

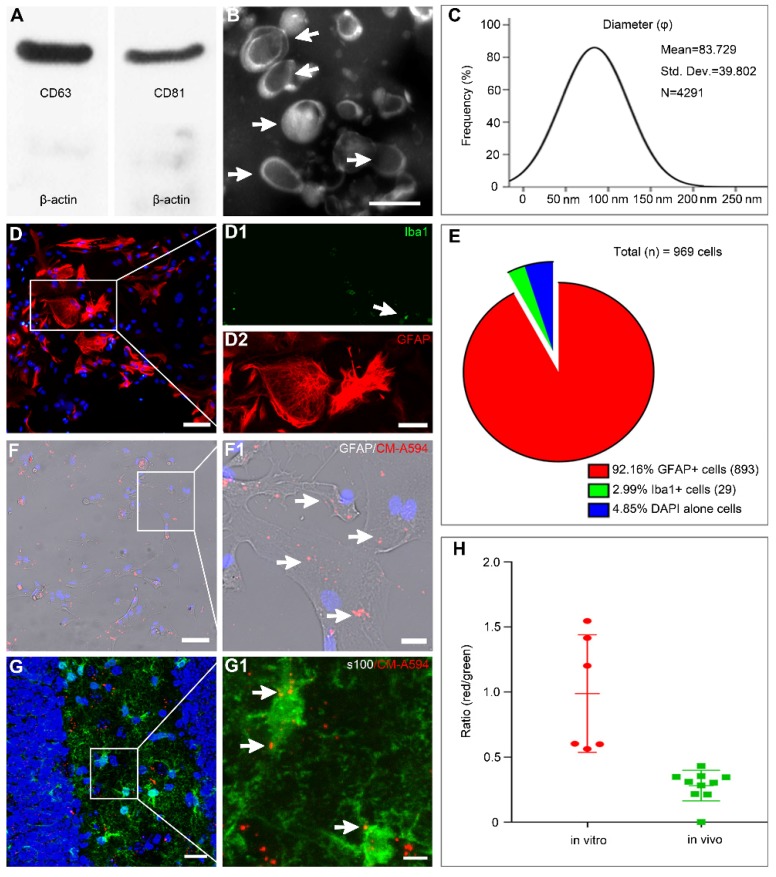
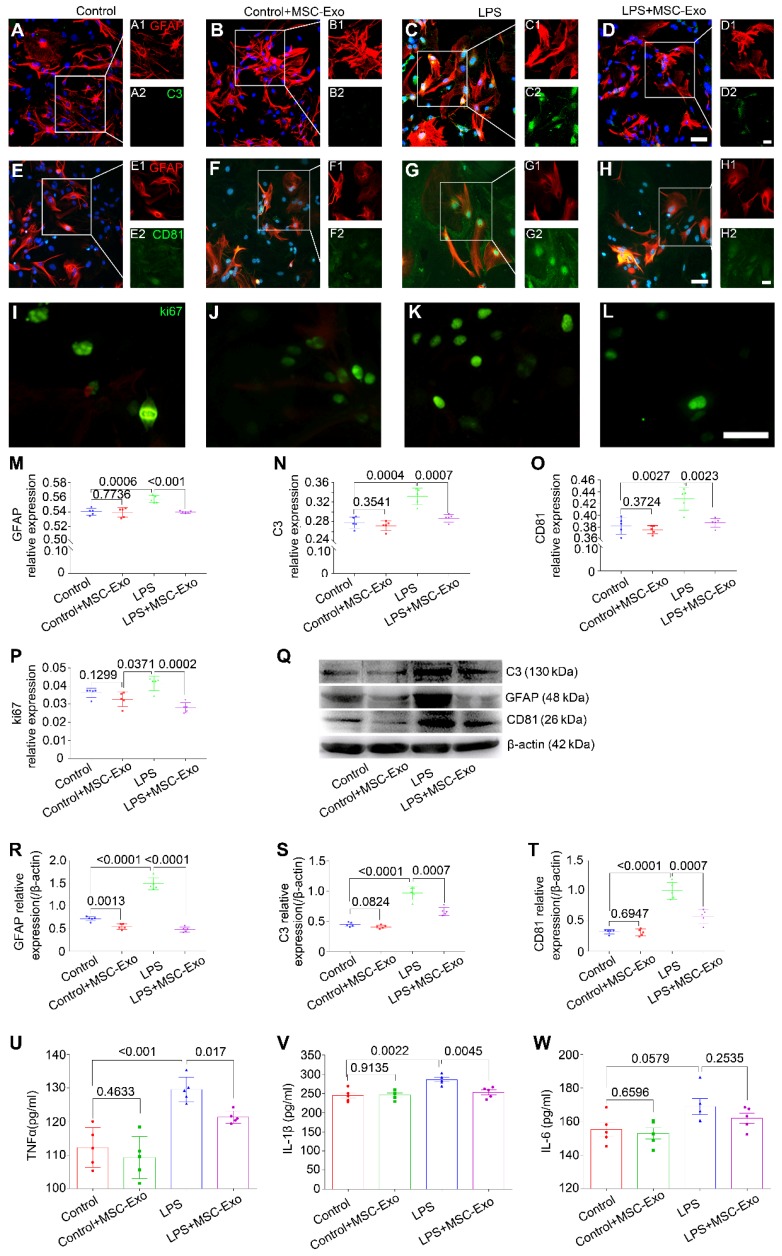
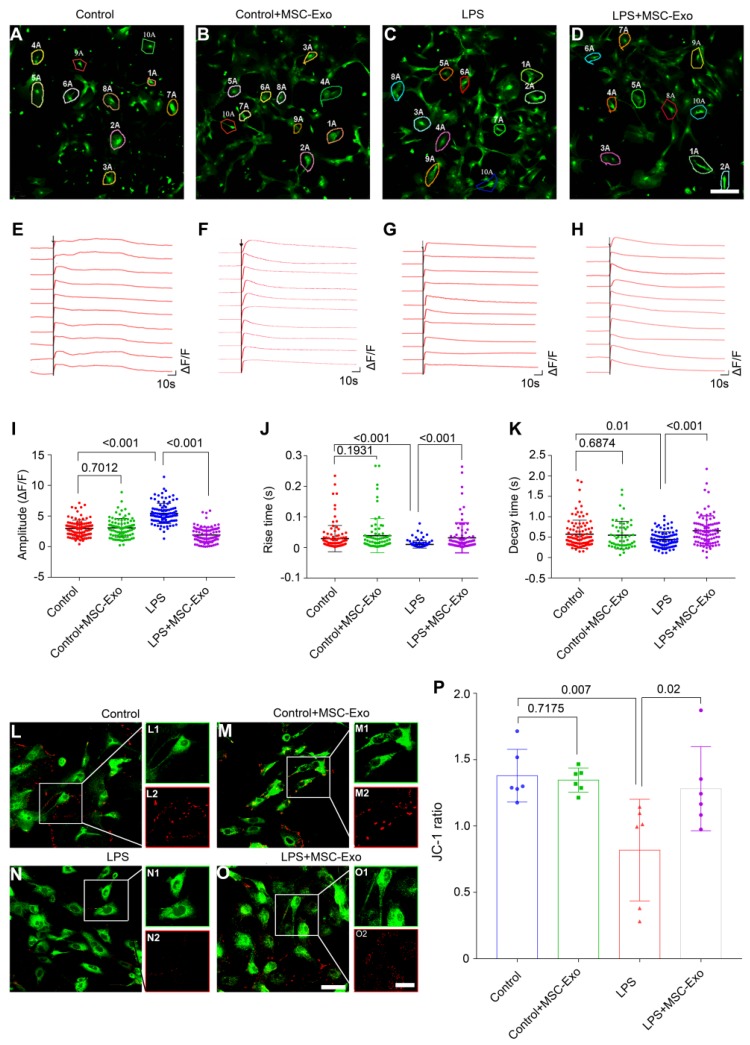
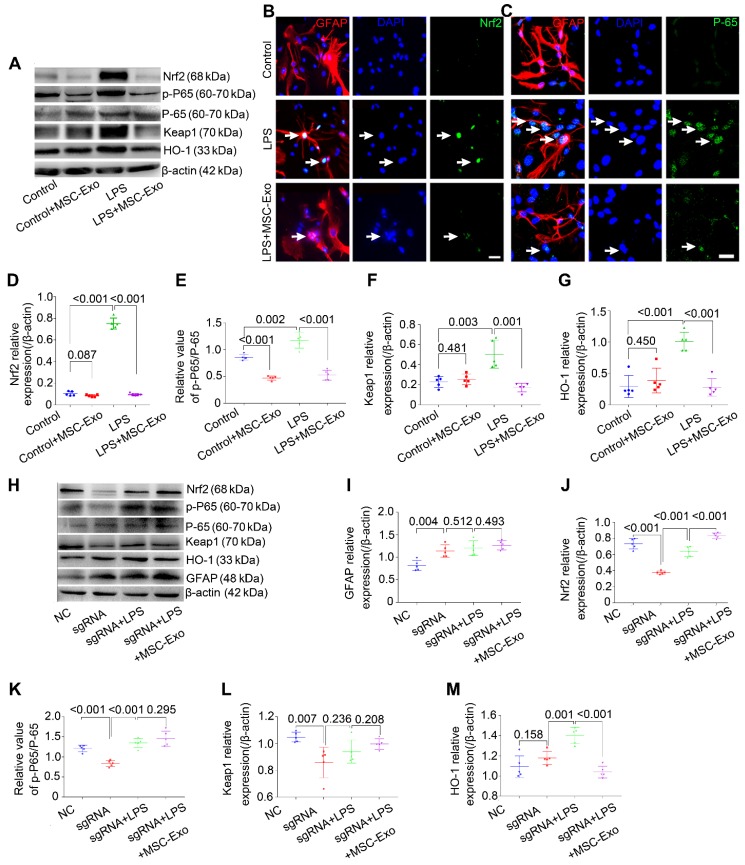
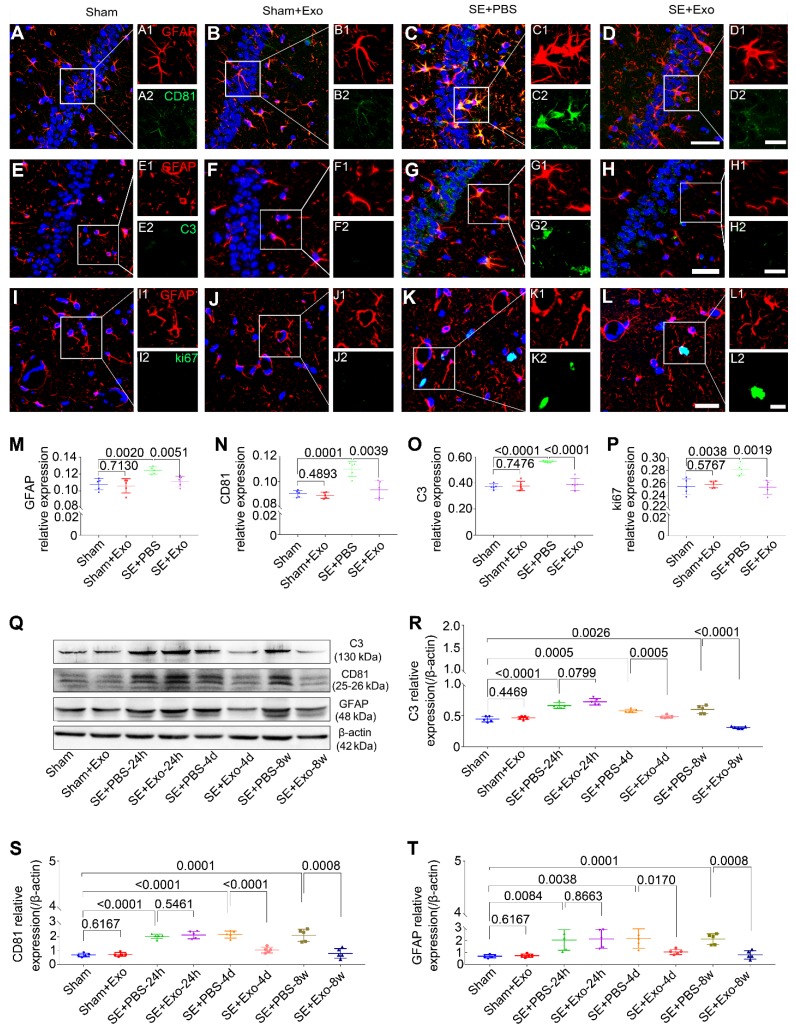
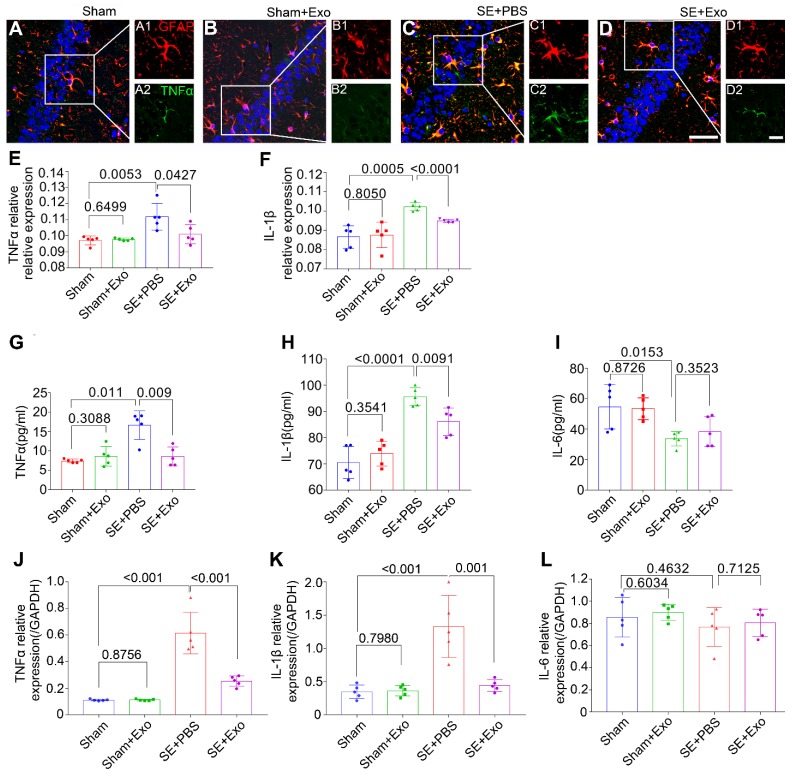
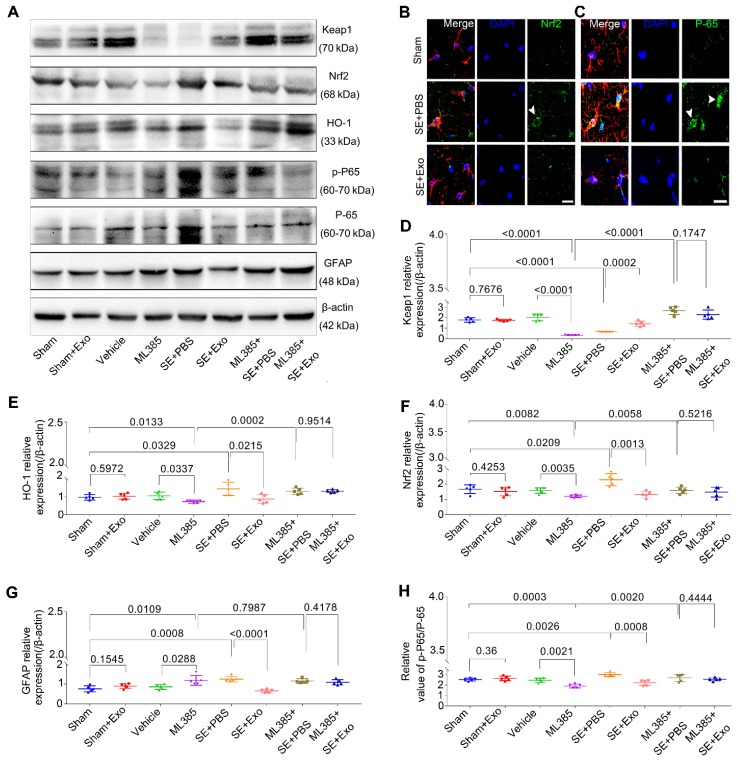
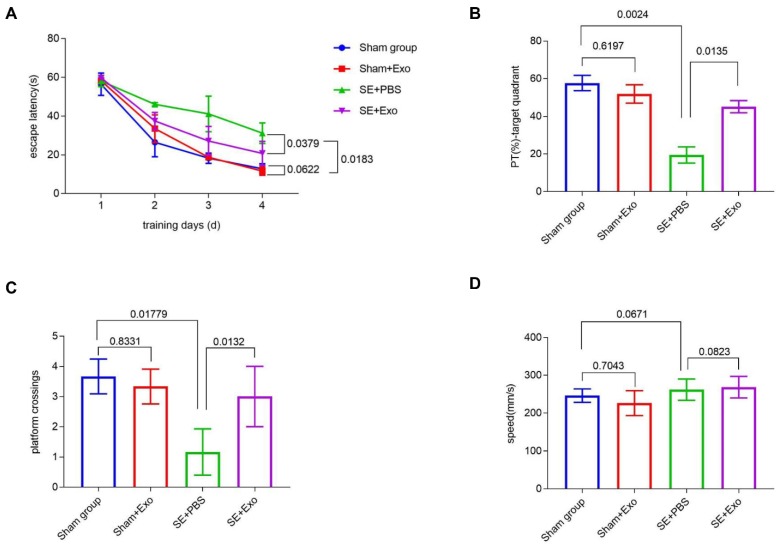
Mesenchymal stem cell-derived exosomes (MSC-Exo) have robust anti-inflammatory effects in the treatment of neurological diseases such as epilepsy, stroke, or traumatic brain injury. While astrocytes are thought to be mediators of these effects, their precise role remains poorly understood. To address this issue, we investigated the putative therapeutic effects and mechanism of MSC-Exo on inflammation-induced alterations in astrocytes. Methods: Lipopolysaccharide (LPS)-stimulated hippocampal astrocytes in primary culture were treated with MSC-Exo, which were also administered in pilocarpine-induced status epilepticus (SE) mice. Exosomal integration, reactive astrogliosis, inflammatory responses, calcium signaling, and mitochondrial membrane potentials (MMP) were monitored. To experimentally probe the molecular mechanism of MSC-Exo actions on the inflammation-induced astrocytic activation, we inhibited the nuclear factor erythroid-derived 2, like 2 (Nrf2, a key mediator in neuroinflammation and oxidative stress) by sgRNA (in vitro) or ML385 (Nrf2 inhibitor) in vivo. Results: MSC-Exo were incorporated into hippocampal astrocytes as well as attenuated reactive astrogliosis and inflammatory responses in vitro and in vivo. Also, MSC-Exo ameliorated LPS-induced aberrant calcium signaling and mitochondrial dysfunction in culture, and SE-induced learning and memory impairments in mice. Furthermore, the putative therapeutic effects of MSC-Exo on inflammation-induced astrocytic activation (e.g., reduced reactive astrogliosis, NF-κB deactivation) were weakened by Nrf2 inhibition. Conclusions: Our results show that MSC-Exo ameliorate inflammation-induced astrocyte alterations and that the Nrf2-NF-κB signaling pathway is involved in regulating astrocyte activation in mice. These data suggest the promising potential of MSC-Exo as a nanotherapeutic agent for the treatment of neurological diseases with hippocampal astrocyte alterations.

Keywords: MSC-Exo; Nanotherapy; Nrf2-NF-κB signaling; astrocyte alterations; calcium signaling.


Conflict of interest statement

Competing Interests: The authors have declared that no competing interest exists.

Figures

Figure 1
Figure 1
MSC-Exo and astrocytes characterization, nanoparticles tracking. (A) Western blots of protein expression in exosomes generated from the umbilical cord. (B) A representative TEM scanning image presents the morphology of MSC-Exo (arrowheads). (C) Size distribution of isolated MSC-Exo is shown in the graph on the right. (D) Cultured primary hippocampal astrocytes double-stained with the fluorescent antibody against Iba1 (D1, microglial marker, green) and GFAP (D2, astroglial marker, red). (E) Pie chart of cell samples composition. (F-G) Representative images showing the incorporation of MSC-Exo in vitro (F) and in vivo (G). Areas in squares are presented on the right at higher magnification (F1 and G1). MSC-Exo nanoparticles (red) in the soma and processes of GFAP+ (F1) or s100+ (G1)-stained astrocytes (arrowheads). (H) The histogram of the exosome uptake measured as the fluorescence intensity in primary cultured astrocytes (in vitro) and the hippocampus (in vivo). Scale bars: B, 200 nm; D = 50μm; D1 and D2, 25μm; F and G, 20μm; F1 and G1, 5μm.
Figure 2
Figure 2
MSCs-Exo protect against LPS-induced astrocytic activation and inflammatory responses in vitro. Astrocytic activation and inflammatory responses were examined using immunohistochemistry, Western blotting, or ELISA. (A-L) Immunostaining images of GFAP (A-H, red, a marker of reactive astrocytes), C3 (A-D, green, a marker A1 astrocytes), CD81 (E-H, green, a regulator of astrogliosis), and ki67 (I-L, green, a marker of cell proliferation). (M-P) Statistical analysis of the fluorescence intensity of GFAP (M), C3 (N), CD81 (O), and ki67 (P) in the Control, Control+MSC-Exo, LPS, and LPS+MSC-Exo group. (Q) Western blots of the relative expression of GFAP (R), C3 (S), and CD81 (T) in each group. (U-W) Concentration of inflammatory cytokines secreted by astrocytes including TNF-α (U), IL-1β (V), and IL-6 (W) determined by ELISA. Histograms of statistical difference between groups are shown. Scale bars: A-H, 50 μm; I-L, A1-H1 and A2-H2, 20 μm.
Figure 3
Figure 3
MSC-Exo treatment ameliorates LPS-induced aberrant calcium signaling and mitochondrial dysfunction in the primary culture of hippocampal astrocytes. A calcium indicator Fluo-8 AM was used to detect the intracellular Ca2+ oscillations in cultured primary astrocytes. (A-D) Examples of Ca2+ imaging in cultured primary astrocytes obtained with confocal microscopy using Fluo-8 AM in Control (A), Control+MSC-Exo (B), LPS+PBS (C), and LPS+MSC-Exo groups (D). (E-H) Igor software assay presents the first phase (30 s) and second phase (150 s) of the intracellular Ca2+ oscillations within 10 cells selected at random from each group. (J-K) Statistical analysis of the amplitude (ΔF/F) (I), rise time (J), and decay time (K) of the intracellular Ca2+ oscillations after adding ATP in each group. (L-O) Representative images of the mitochondrial membrane potential in the primary culture of hippocampal astrocytes using JC-1 staining. Green fluorescence of the monomeric form of JC-1 in the cytosol after mitochondrial membrane depolarization (L1-O1), red fluorescence of the potential-dependent aggregation in the mitochondria (L2-O2) in each group. (P) The histogram of the ratio of JC-1 fluorescence (Red / Green) in the primary culture of hippocampal astrocytes. Statistical difference between groups is shown in all histograms. Scale bars: A-D, 50 μm; L-O, L1-O1 and L2-O2, 100 μm.
Figure 4
Figure 4
sgRNA knockdown of Nfr2 decreases the inhibition of astrocytic activation by MSC-Exo in vitro. Nrf2-NF-κB signaling in primary culture of astrocytes. (A) Western blotting of protein expression of Nrf2-NF-κB signaling in primary cultured astrocytes. (B-C) Representative images of the nuclear translocation of the Nrf2 (B, white arrow) and P-65 (C, white arrow) in LPS-induced astrocytes. (D-G) Statistical analysis of the relative expression of Nrf2 (D), Keap1 (F), HO-1 (G), and the value of p-P65/P-65 (E, represents NF-κB signaling activation) in each group. (H) Western blots of the relative expression of GFAP (I), Nrf2 (J), p-P65/P-65 (K), Keap1 (L), and HO-1 (M) in NC (Negative control), sgRNA, sgRNA+LPS, and sgRNA+LPS+MSC-Exo groups. Statistical difference between groups is shown in all histograms. Scale bars: B and C, 30μm.
Figure 5
Figure 5
Intraventricular injection of MSC-Exo alleviates SE-induced hippocampal astrocytic activation in mice. The influence of MSC-Exo on hippocampal astrocytic activation was examined in the acute and chronic stages of SE. (A-L) Representative images display the immunofluorescence intensity of GFAP (A-L, red), CD81 (A-D, green), C3 (E-H, green), and ki67 (I-L, green) in the hippocampus at 4 d post-SE, cell nuclei stained with DAPI (blue). (M-P) Fluorescence intensity assay of the relative expression of GFAP (M), CD81 (N), C3 (O), and ki67 (P) in each group. (Q) Western blots of protein expression of C3, CD81, and GFAP at 24 h, 4 d, 7 d, and 8 w post-SE in the hippocampus. (R-T) Statistical analysis of changes in C3 (R), CD81 (S), and GFAP (T) expression in each group. Statistical difference between groups is displayed in histograms. Scale bars: A-L, 50 μm; A1-L1 and A2-L2, 20 μm.
Figure 6
Figure 6
MSC-Exo injection attenuates SE-induced hippocampal inflammatory responses. After the SE model received for 4 d, the inflammatory responses were investigated in SE models 4 d after MSC-Exo administration. (A-D) Hippocampal tissues double-stained with GFAP and TNFα in each group, magnified images on the right are of GFAP+ (red, A1-D1) and TNFα+ (green, A2-D2) cells, cell nuclei stained with DAPI (blue). (E-F) Fluorescence intensity of the relative expression of TNFα (E) and IL-1β (F) in the whole hippocampus including CA1, CA2, CA3, and DG subareas of each group. (G-I) Histograms of the concentration of inflammatory cytokines including TNFα (G), IL-1β (H), and IL-6 (I) in each group by ELISA. (J-L) qPCR of the RNA levels (relative expression to GAPDH) of TNFα (J), IL-1β (K), and IL-6 (L) in the hippocampal tissues of the experimental groups. Statistical difference between groups is shown in all histograms. Scale bars: A-D, 50μm; A1-D1, 20μm; A2-D2, 20μm.
Figure 7
Figure 7
ML385 (Nrf2 inhibitor) injection reverses inhibition of MSC-Exo on hippocampal astrocytic activation in vivo. ML385 (Nrf2 inhibitor) injection was used to explore the mechanism of MSC-Exo in anti-inflammation in vivo. (A) Western blots of antioxidant and anti-inflammatory markers in hippocampal tissues before and after ML385 injection. (B-C) Representative images of the nuclear translocation of Nrf2 (B, arrowhead) and P-65 (C, arrowheads) in Sham, SE+PBS, and SE+MSC-Exo groups. (D-H) Statistical analysis of the relative expression of Keap1 (D), HO-1 (E), Nrf2 (F), GFAP (G), and p-P-65 / P-65 (H) in the hippocampus. Statistical difference between groups is shown in all histograms. Scale bars: B and C, 30μm
Figure 8
Figure 8
MSC-Exo treatment improves SE-induced learning and memory impairments in mice. Learning and memory impairments of each group were tested using Morris water maze. (A) Escape latency of each group within the training days. (C-D) Histograms of the PT (%)-target quadrant (B), platform crossings (C), and speed (mm/s) (D) in different experimental groups. Statistical difference between groups is shown in the graph and histograms.

References

    1. Shang F, Liu S, Ming L, Tian R, Jin F, Ding Y. et al. Human Umbilical Cord MSCs as New Cell Sources for Promoting Periodontal Regeneration in Inflammatory Periodontal Defect. Theranostics. 2017;7:4370–82. - PMC - PubMed
    1. Xie X, Wang Y, Zhao C, Guo S, Liu S, Jia W. et al. Comparative evaluation of MSCs from bone marrow and adipose tissue seeded in PRP-derived scaffold for cartilage regeneration. Biomaterials. 2012;33:7008–18. - PubMed
    1. Si YL, Zhao YL, Hao HJ, Fu XB, Han WD MSCs. Biological characteristics, clinical applications and their outstanding concerns. Ageing Res Rev. 2011;10:93–103. - PubMed
    1. Wang Y, Chen X, Cao W, Shi Y. Plasticity of mesenchymal stem cells in immunomodulation: pathological and therapeutic implications. Nat Immunol. 2014;15:1009–16. - PubMed
    1. Shi Y, Wang Y, Li Q, Liu K, Hou J, Shao C. Immunoregulatory mechanisms of mesenchymal stem and stromal cells in inflammatory diseases. Nat Rev Nephrol. 2018;14:493–507. - PubMed

Publication types