. 2019 Sep 2:7:e7542.
doi: 10.7717/peerj.7542. eCollection 2019.

Type I-like behavior of the type II α7 nicotinic acetylcholine receptor positive allosteric modulator A-867744

Affiliations

Type I-like behavior of the type II α7 nicotinic acetylcholine receptor positive allosteric modulator A-867744

Krisztina Pesti et al. PeerJ. .

Abstract

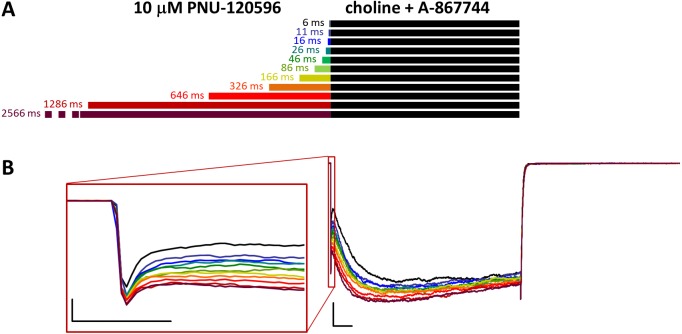
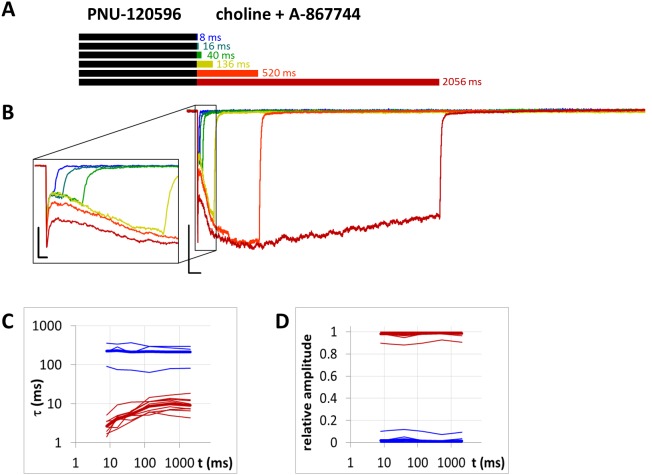
Cognitive impairment often involves the decreased expression or hypofunction of alpha 7-type nicotinic acetylcholine receptors (α7 nAChRs). Agonists or positive allosteric modulators (PAMs) of α7 nAChRs are known to be potential treatments for dementias, different neurodegenerative disorders, pain syndromes and conditions involving inflammation. In some of these conditions, it is desirable to maintain the temporal precision of fast cholinergic events, while in others, this temporal precision is unnecessary. For this reason, the optimal therapeutic effect for distinct indications may require PAMs with different mechanisms of action. The two major mechanisms are called "type I", which are compounds that augment α7 nAChR-mediated currents but maintain their characteristic fast kinetics; and "type II", which are compounds that produce augmented and prolonged currents. In this study, we performed a kinetic analysis of two type II PAMs of the α7 nAChR: PNU-120596 and A-867744, using a fast perfusion method that allowed high temporal resolution. We characterized the type of modulation produced by the two compounds, the state-dependence of the modulatory action, and the interaction between the two compounds. We found fundamental differences between the modulation mechanisms by PNU-120596 and A-867744. Most importantly, during brief agonist pulses, A-867744 caused a strikingly type I-like modulation, while PNU-120596 caused a type II-like prolonged activation. Our results demonstrate that specific compounds, even though all labeled as type II PAMs, can behave in completely different ways, including their onset and offset kinetics, state preference, and single channel open time. Our results emphasize that subtle details of the mechanism of action may be significant in assessing the therapeutic applicability of α7 nAChR PAM compounds.

Keywords: A-867744; Choline; Cognitive enhancement; PNU-120596; Patch clamp; Positive allosteric modulator; Type II PAM; α7 nAChR.


Conflict of interest statement

The authors declare there are no competing interests.

Figures

Figure 1
Figure 1. Effects of different lengths of A-867744 preincubation on choline-evoked currents.
(A) Perfusion protocol with preincubation durations indicated. Colors in (B) indicate corresponding lengths of preincubation as shown in (A). (B) A typical example for the effect of 1 µM A-867744 preincubation on currents evoked by a 1 s pulse of 10 mM choline, and on the deactivation after it. Scale bars: 100 ms, 1 nA. Inset shows the first 20 ms of the agonist-evoked current on an expanded time scale. Scale bars: 10 ms, 1 nA. (C) The change in maximal slope values of the initial phase of the current, depending on the length of modulator preincubation. Data from n = 7 cells. Only data from the shortest (6 ms) and longest (2,566 ms) preincubation are shown.
Figure 2
Figure 2. Effects of different lengths of A-867744 preincubation on currents evoked by coapplied choline and A-867744.
(A) Perfusion protocol. (B) A typical example for the effect. Scale bars: 100 ms, 1 nA. Inset shows the first 20 ms on an expanded time scale. Scale bars: 10 ms, 1 nA. (C) The change in maximal slope values of the initial phase of the current, depending on the length of modulator preincubation. Only data from the shortest (6 ms) and longest (2,566 ms) preincubation are shown.
Figure 3
Figure 3. Effects of different lengths of PNU-120596 preincubation on choline evoked currents.
(A) Perfusion protocol. (B) A typical example for the effect of 1 µM PNU-120596 preincubation on currents evoked by a 1 s pulse of 10 mM choline. Scale bars: 100 ms, 1 nA. Inset shows the first 20 ms of the agonist-evoked current at an expanded time scale. Scale bars: 10 ms, 1 nA.
Figure 4
Figure 4. Effects of different lengths of PNU-120596 preincubation on currents evoked by coapplied choline and PNU-120596.
(A) Perfusion protocol. (B) A typical example for the effect. Scale bars: 100 ms, 1 nA. Inset shows the first 20 ms on an expanded time scale. Scale bars: 10 ms, 1 nA.
Figure 5
Figure 5. Effects of different lengths of 1 µM A-867744 preincubation on currents evoked by coapplied choline and 1 µM PNU-120596.
(A) Perfusion protocol. (B) A typical example for the effect. Scale bars: 100 ms, 1 nA. Inset shows the first 20 ms on an expanded time scale. Scale bars: 10 ms, 1 nA. (C) The change in maximal slope values of the initial phase of the current, depending on the length of modulator preincubation. Only data from the shortest (6 ms) and longest (2,566 ms) preincubation are shown. (D) and (E) Fast (black) and slow (red) time constants of deactivation (D), and their respective contribution to the amplitude (E). Thin lines show data from 7 individual measurements, thick lines show geometric mean for time constants, and arithmetic mean for relative amplitudes.
Figure 6
Figure 6. Effects of different lengths of 1 µM A-867744 preincubation on currents evoked by coapplied choline and 10 µM PNU-120596.
(A) Perfusion protocol. (B) A typical example for the effect. Scale bars: 100 ms, 1 nA. Inset shows the first 20 ms of the agonist-evoked current at an expanded time scale. Scale bars: 10 ms, 1 nA. (C) The change in maximal slope values of the initial phase of the current, depending on the length of modulator preincubation. Only data from the shortest (6 ms) and longest (2,566 ms) preincubation are shown. (D) and (E) Fast (black) and slow (red) time constants of deactivation (D), and their respective contribution to the amplitude (E). Thin lines show data from six individual measurements, thick lines show geometric mean for time constants, and arithmetic mean for relative amplitudes.
Figure 7
Figure 7. Effects of different lengths of 10 µM PNU-120596 preincubation on currents evoked by coapplied choline and 1 µM A-867744.
(A) Perfusion protocol. (B) A typical example for the effect. Scale bars: 100 ms, 1 nA. Inset shows the first 20 ms of the agonist-evoked current at an expanded time scale. Scale bars: 10 ms, 1 nA.
Figure 8
Figure 8. Currents evoked by different lengths of agonist and PNU-120596 coapplication after 1 s preincubation by PNU-120596.
(A) Bars illustrate the perfusion protocol, 1 s of preincubation followed by different durations of agonist + modulator as indicated. Colors in (B) indicate corresponding lengths of coapplication as shown in (A). (B) An example for currents evoked by coapplied choline and PNU-120596 after 1 s of PNU-120596 preincubation. Scale bars: 100 ms, 1 nA. Inset shows the first 25 ms on an expanded time scale. Scale bars: 10 ms, 1 nA. Fast (red) and slow (blue) time constants of deactivation (C), and their respective contribution to the amplitude (D) after different lengths of choline and PNU-120596 coapplication. Thin lines show data from six individual measurements, thick lines show geometric mean for time constants, and arithmetic mean for relative amplitudes.
Figure 9
Figure 9. Currents evoked by different lengths of choline and A-867744 coapplication after 1 s preincubation by A-867744.
(A) Perfusion protocol. (B) An example for the currents. Scale bars: 100 ms, 1 nA. Inset shows the first 25 ms on an expanded time scale. Scale bars: 10 ms, 1 nA. (C) The time constant of deactivation after different lengths of choline and A-867744 coapplication. Thin lines show data from six individual measurements, thick line shows geometric mean.
Figure 10
Figure 10. Currents evoked by different lengths of choline and PNU-120596 coapplication after 1 s preincubation by A-867744.
(A) Perfusion protocol. (B) An example for the currents. Scale bars: 100 ms, 1 nA. Inset shows the first 25 ms on an expanded time scale. Scale bars: 10 ms, 1 nA. (C) and (D) Fast (red) and slow (blue) time constants of deactivation (C), and their respective contribution to the amplitude (D), after different lengths of choline and PNU-120596 coapplication. Thin lines show data from eight individual measurements, thick lines show geometric mean for time constants, and arithmetic mean for relative amplitudes.
Figure 11
Figure 11. Currents evoked by different lengths of choline and A-867744 coapplication after 1 s preincubation by 1 µM PNU-120596.
(A) Perfusion protocol. (B) An example for the currents. Scale bars: 100 ms, 1 nA. Inset shows the first 25 ms on an expanded time scale. Scale bars: 10 ms, 1 nA. (C) and (D) The time constant of deactivation (C), and their respective contribution to the amplitude (D), after different lengths of choline and A-867744 coapplication. Thin lines show data from six individual measurements, thick lines show geometric mean for time constants, and arithmetic mean for relative amplitudes.
Figure 12
Figure 12. Effect of different durations of modulator application between two identical coapplications of modulator + agonist.
(A) Schematic illustration of the perfusion protocol. (B) An example for currents evoked by coapplied choline and PNU-120596, intermitted by different durations of PNU-120596 application. Scale bars: 1 s, 1 nA. (C) An example for currents evoked by coapplied choline and PNU-120596, intermitted by different durations of A-867744 application. Scale bars: 1 s, 100 pA. (D) Time constants of deactivation after the second coapplication plotted against modulator pulse duration. Slow (blue) and fast (red) time constants are shown for n = 11 cells (thin lines), with their geometric mean (thick line). (E) Relative contribution of slow (blue) and fast (red) time constants as a function of modulator pulse duration. Thick lines show arithmetic mean. (F) An example for currents evoked by coapplied choline and A-867744, intermitted by different durations of PNU-120596 application. Scale bars: 1 s, 100 pA.
Figure 13
Figure 13. Kinetic simulations of modulator effects.
(A) The model used in our simulations. States are denoted by three-character codes. The first character indicates the conformation: O (open), R (resting), D (desensitized), and S (slow desensitized). The second character indicates occupancy of the modulator binding sites (vacant “0” or occupied “1”), and the last character indicates the number of bound agonist molecules (0 to 5). Transitions are denoted by a four-character code (except opening and closing transitions) as shown in the figure. The first character, a letter, indicates the nature of transition: “a” and “b” are association and dissociation of agonist molecules, respectively; “c” and “d” are association and dissociation of the modulator, e, f, op (opening) and clo (closing) are conformational transitions with no binding/unbinding involved. The numbers indicate the location of individual transitions within the scheme along the three axes. The first digit indicates presence or absence of the modulator (z axis), the second digit indicates the conformation(s) in which, or between which the transition occurs (y axis), and the third digit indicates the agonist occupancy level (x axis). (B) A visual illustration of the construction of this Monod-Wyman-Changeux-type model. Red arrows indicate the 13 free rate constants, colored planes and large letters indicate allosteric factors. The same allosteric factors are effective at all agonist binding steps (see Table S1). The allosteric factors K, L, V, and W express the interaction between agonist binding and conformational transitions, P, and Q, between modulator binding and conformational transitions, and M expresses cooperativity between agonist and modulator binding. Although the free parameters discussed thus far fully determine all rate constants, it was convenient to introduce some additional factors called “symmetrical barrier factors”, because both forward and backward transitions are to be multiplied by them; in effect they modify the energy barrier of specific transitions. We introduced two such symmetrical barrier factors: zD modifies the rate of modulator association/dissociation (i.e., transitions along the z axis) to desensitized (D) states, while xRDOS modifies the rate of choline association (i.e., transitions along the x axis) to all modulator-bound states (R, D, O, and S). (C) Visual illustration of allosteric factors needed to reproduce modulator-free receptor behavior: agonist binding increased the propensity of the receptor to open (“V”), to desensitize (“L”), and to enter slow desensitized state (“K”), while all these conformational transitions increased agonist affinity. We also supposed that agonist binding will increase the probability of being open in the presence of both modulators (“W”). (D) Visual illustration of the major parameters required to qualitatively reproduce properties of A-867744-modulated currents. It was necessary to suppose an absence of cooperativity between agonist and modulator (“M” absent), high modulator association and dissociation rates (blue arrow), as well as a preference of resting and slow desensitized states. (E) Visual illustration of the major parameters required to qualitatively reproduce major properties of PNU-120596-modulated current. It was necessary to suppose hindered modulator accessibility of resting receptors (red dashed lines along the z axis), a cooperativity between agonist and modulator (“M”), hindered agonist accessibility of modulator-bound receptors (red dashed lines along the x axis), and a preference of desensitized state. (F) and (G) Simulated currents (sum of all open states) evoked by a 1 s coapplication of 10 mM choline and 1 µM of either A-867744 (F) or PNU-120596 (G). The three colors show the cases when different lengths of modulator pre-application preceded coapplication of the same modulator with choline. Scale bars: 0.01 (open fraction of the receptor population), 100 ms. Insets show initial phase on an expanded time scale: Scale bars: 0.01 (open fraction), 1 ms. (H) to (K) Net probability fluxes at the onset of currents after 4 (H and I) and 400 (J and K) ms preincubation by either A-867744 (H and J), or PNU-120596 (I and K). Text between J and K shows scaling of the arrows (fraction of the receptor population moved along a specific transition path during the 1 s pulse).

Similar articles

Cited by

References

    1. Albuquerque EX, Pereira EFR, Alkondon M, Rogers SW. Mammalian nicotinic acetylcholine receptors: from structure to function. Physiological Reviews. 2009;89:73–120. doi: 10.1152/physrev.00015.2008. - DOI - PMC - PubMed
    1. Andersen ND, Nielsen BE, Corradi J, Tolosa MF, Feuerbach D, Arias HR, Bouzat C. Exploring the positive allosteric modulation of human α7 nicotinic receptors from a single-channel perspective. Neuropharmacology. 2016;107:189–200. doi: 10.1016/j.neuropharm.2016.02.032. - DOI - PubMed
    1. Arias HR, Gu R-X, Feuerbach D, Guo B-B, Ye Y, Wei D-Q. Novel positive allosteric modulators of the human α7 nicotinic acetylcholine receptor. Biochemistry. 2011;50:5263–5278. doi: 10.1021/bi102001m. - DOI - PubMed
    1. Benndorf K, Kusch J, Schulz E. Probability fluxes and transition paths in a Markovian model describing complex subunit cooperativity in HCN2 channels. PLOS Computational Biology. 2012;8(10):e1002721. doi: 10.1371/journal.pcbi.1002721. - DOI - PMC - PubMed
    1. Bouzat C, Lasala M, Nielsen BE, Corradi J, Esandi MDC. Molecular function of α7 nicotinic receptors as drug targets. Journal de Physiologie. 2018;596:1847–1861. doi: 10.1113/JP275101. - DOI - PMC - PubMed

LinkOut - more resources