. 2019 Mar;1(3):390-403.
doi: 10.1038/s42255-019-0039-6. Epub 2019 Mar 11.

Critical role of ASCT2-mediated amino acid metabolism in promoting leukaemia development and progression

Affiliations

Critical role of ASCT2-mediated amino acid metabolism in promoting leukaemia development and progression

Fang Ni et al. Nat Metab. 2019 Mar.

Abstract

Amino acid (AA) metabolism is involved in diverse cellular functions, including cell survival and growth, however it remains unclear how it regulates normal hematopoiesis versus leukemogenesis. Here, we report that knockout of Slc1a5 (ASCT2), a transporter of neutral AAs, especially glutamine, results in mild to moderate defects in bone marrow and mature blood cell development under steady state conditions. In contrast, constitutive or induced deletion of Slc1a5 decreases leukemia initiation and maintenance driven by the oncogene MLL-AF9 or Pten deficiency. Survival of leukemic mice is prolonged following Slc1a5 deletion, and pharmacological inhibition of ASCT2 also decreases leukemia development and progression in xenograft models of human acute myeloid leukemia. Mechanistically, loss of ASCT2 generates a global effect on cellular metabolism, disrupts leucine influx and mTOR signaling, and induces apoptosis in leukemic cells. Given the substantial difference in reliance on ASCT2-mediated AA metabolism between normal and malignant blood cells, this in vivo study suggests ASCT2 as a promising therapeutic target for the treatment of leukemia.


Figures

Figure 1.
Figure 1.. Deletion of ASCT2 moderately and severely decreases blood cell development under steady state and stress conditions, respectively.
(a-e) BM cells harvested from six to eight-week-old Slc1a5+/+ and Slc1a5−/− mice were assayed by FACS analyses for the frequencies and absolute numbers of HSCs, LSK and LK cells (n=5 mice/genotype) (a), and the frequencies and numbers of CLPs, CMPs, GMPs, and MEPs (n=7 mice/genotype) (b). BM cells were assessed by CFU assays for the indicated progenitors (n=5 mice/genotype) (c), and by FACS for the cell cycle status of LSK cells and HSCs (n=5 mice/genotype) (d) and apoptotic cells (Annexin V+) in LSK cells and HSCs (n=5 mice/genotype) (e). Data are presented as mean ± SD of biological replicates. *p < 0.05; **p < 0.01; ***p < 0.001 (Unpaired two-tailed Student’s t-test). (f) BM cells harvested from Slc1a5+/+ or Slc1a5−/− mice (CD45.2+) were mixed with the same number of BM cells isolated from BoyJ mice (CD45.1+) and transplanted into lethally irradiated BoyJ recipients (n=9 mice/genotype). Test cell reconstitution in the whole cell population of the PB was determined by FACS analyses at the indicated time points. Data are presented as mean ± SD of biological replicates. ***p < 0.001 (Unpaired two-tailed Student’s t-test). (g, h) BM cells harvested from recipient mice 16 weeks after primary transplantation were transplanted into lethally irradiated secondary BoyJ recipients (n=10 mice/genotype). Test cell reconstitution in the PB was determined as above (g). Test cell contributions to LSK cells in the BM were determined 16 weeks after primary and secondary transplantation by FACS analyses (n=9 mice/genotype) (h). Data are presented as mean ± SD of biological replicates. *p < 0.05; ***p < 0.001 (Unpaired two-tailed Student’s t-test). (i, j) Six to eight-week-old Slc1a5+/+ and Slc1a5−/− mice were administrated by intraperitoneal injection one dose of 5-FU (250 mg/kg body weight) (n=10 mice/genotype) (i) or two doses of 5-FU (150 mg/kg body weight) with one-week interval (n=12 mice/genotype) (j). WBC counts in the PB were monitored. Data are presented as mean ± SD of biological replicates. *p < 0.05; **p < 0.01; ***p < 0.001 (Unpaired two-tailed Student’s t-test) (i). Mouse survival rates were documented. **p < 0.01 [Log-rank (Mantel-Cox) test] (j).
Figure 2.
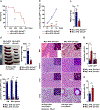
Figure 2.. Constitutive deletion of ASCT2 inhibits MLL-AF9-induced leukemogenesis.
Lin cells isolated from Slc1a5−/− and Slc1a5+/+ mice were infected with MSCV-MLL-AF9-IRES-GFP retrovirus. Infected cells were expanded, sorted, and inoculated into sublethally irradiated BoyJ mice as described in Methods. (a) Kaplan-Meier survival curves of the mice receiving MLL-AF9; Slc1a5+/+ cells (n=15 mice) or MLL-AF9; Slc1a5−/− cells (n=12 mice). ***p < 0.001 [Log-rank (Mantel-Cox) test]. (b) GFP+ leukemic cells in the PB (n=9 mice/genotype) were determined at the indicated time points after leukemic cell inoculation. Data are presented as mean ± SD of biological replicates. ***p < 0.001 (Unpaired two-tailed Student’s t-test). (c-e) WBC counts in the PB (c), spleen weights (d), and GFP+ leukemic cells in the PB, BM and spleen (e) were determined 35 days after leukemic cell inoculation (n=9 mice/genotype). Data are presented as mean ± SD of biological replicates. ***p < 0.001 (Unpaired two-tailed Student’s t-test). (f) Tissues dissected from the mice inoculated with MLL-AF9-tranduced Slc1a5+/+ and MLL-AF9-tranduced Slc1a5−/− cells 35 days and 140 days after the inoculation, respectively, were processed for histopathological examination. Representative images from 5 mice/genotype are shown. (g) Percentages of apoptotic cells (Annexin V+) in GFP+ leukemic cells and GFP normal host BM cells of the same recipient mice (n=6 mice/genotype) were determined by FACS 35 days after the inoculation. Data are presented as mean ± SD of biological replicates. ***p < 0.001; N.S., not significant (Unpaired two-tailed Student’s t-test). (h) BM cells isolated from MLL-AF9; Slc1a5+/+ and MLL-AF9; Slc1a5−/− leukemic cell recipients (n=4 mice/genotype) were cultured in vitro for 48 hours, Apoptotic cells in the GFP+ leukemic cell population were determined by FACS. Data are presented as mean ± SD of biological replicates. *p < 0.05 (Unpaired two-tailed Student’s t-test).
Figure 3.
Figure 3.. Induced deletion of ASCT2 suppresses established leukemia induced by MLL-AF9.
Lin cells isolated from Slc1a5fl/flMx1-Cre and Slc1a5+/+Mx1-Cre mice (without pI-pC treatment) were infected with MSCV-MLL-AF9-IRES-GFP retrovirus. Infected cells were expanded, sorted, and inoculated into sublethally irradiated BoyJ mice as described in Methods. Two weeks later, recipient mice were administrated with pI-pC to delete Slc1a5 (Slc1a5Δ/Δ). (a) Kaplan-Meier survival curves of the mice inoculated with MLL-AF9; Slc1a5+/+ cells (n=15 mice) and MLL-AF9; Slc1a5Δ/Δ cells (n=11 mice). ***p < 0.001 [Log-rank (Mantel-Cox) test]. (b) GFP+ leukemic cells in the PB (n=9 mice/genotype) were determined at the indicated time points after the inoculation. Data are presented as mean ± SD of biological replicates. ***p < 0.001 (Unpaired two-tailed Student’s t-test). (c-e) WBC counts in the PB (c), spleen weights (d), and GFP+ leukemic cells in the PB, BM, and spleen (e) were determined 35 days after the inoculation (n=9 mice/genotype). Data are presented as mean ± SD of biological replicates. ***p < 0.001 (Unpaired two-tailed Student’s t-test). (f) Tissues dissected from the recipients inoculated with MLL-AF9; Slc1a5+/+ or MLL-AF9; Slc1a5Δ/Δ cells 35 days and 140 days after the inoculation, respectively, were processed for histopathological examination. Representative images from 5 mice/genotype are shown. (g) Percentages of apoptotic cells (Annexin V+) in GFP+ leukemic cells and GFP normal host BM cells of the same recipient mice (n=6 mice/genotype) were determined by FACS 35 days after the inoculation. Data are presented as mean ± SD of biological replicates. **p < 0.01; N.S., not significant (Unpaired two-tailed Student’s t-test).
Figure 4.
Figure 4.. Constitutive deletion of ASCT2 inhibits Pten-loss-evoked leukemogenesis.
Six to eight-week-old Ptenfl/flMx1-Cre; Slc1a5+/+ mice (PtenΔ/Δ; Slc1a5+/+) and Ptenfl/flMx1-Cre; Slc1a5−/− mice (PtenΔ/Δ; Slc1a5−/−) were generated and administered pI-pC to induce Pten deletion. (a) Kaplan–Meier survival curves of Pten+/+; Slc1a5+/+ (n=10), Pten+/+; Slc1a5−/− (n=10), PtenΔ/Δ; Slc1a5+/+ (n=9), and PtenΔ/Δ; Slc1a5−/− (n=12) mice. ***p < 0.001 [Log-rank (Mantel-Cox) test]. (b-d) WBC counts in the PB (n=6 mice/genotype) (b), total numbers of splenocytes (n=6 mice/genotype) (c), and Mac-1+ myeloid cells in the PB, spleen, and BM (n=9 mice/genotype) (d) were determined at 45 days after pI-pC administration. Data are presented as mean ± SD of biological replicates. **p < 0.01 (Unpaired two-tailed Student’s t-test). (e) Tissues dissected from the mice were processed for histopathological examination 45 days after pI-pC treatment. Representative images from 5 mice/genotype are shown.
Figure 5.
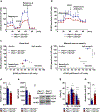
Figure 5.. Deletion of ASCT2 decreases mitochondrial metabolism, induces cell cycle arrest and apoptosis in Pten deficient leukemic cells.
Lin cells were isolated from 6–8 week-old Ptenfl/flMx1-Cre; Slc1a5−/− (PtenΔ/Δ; Slc1a5−/−) and Ptenfl/flMx1-Cre (PtenΔ/Δ; Slc1a5+/+) mice (n=6 mice/genotype) 10 days following pI-pC administration. Oxygen consumption rates (OCRs) (a) and extracellular acidification rates (ECARs) (b) of these live cells were measured in the presence of the mitochondrial inhibitor oligomycin, the uncoupling agent FCCP, and the respiratory chain inhibitor rotenone. Summarized OCR and ECAR data at basal levels and maximal reserve capacities are shown in (c). Data are presented as mean ± SD of biological replicates. *p < 0.05; ***p < 0.001 (Unpaired two-tailed Student’s t-test). Cells were also analyzed for total cellular ATP levels (d, n=5 mice/genotype), ROS levels (e, n=3 mice/genotype), LC3-I/II levels in whole cell lysates (f, n=2 mice/genotype. Representative images ae shown), cell cycle distribution (g, n=6 mice/genotype), and apoptotic cells (Annexin V+) (h, n=7 mice/genotype). Data are presented as mean ± SD of biological replicates. *p < 0.05; **p < 0.01; ***p < 0.001 (Unpaired two-tailed Student’s t-test).
Figure 6.
Figure 6.. Loss of ASCT2 generates a global effect on cellular metabolism in Pten-deficient leukemic cells.
(a-f) Lin cells were isolated from 6–8 week-old Ptenfl/flMx1-Cre; Slc1a5−/− (PtenΔ/Δ; Slc1a5−/−) and Ptenfl/flMx1-Cre (PtenΔ/Δ; Slc1a5+/+) mice 10 days after pI-pC administration. Cells were processed for Gln uptake assays as described in Methods (a, n=3 mice/genotype). Data are presented as mean ± SD of biological replicates. ***p < 0.001 (Unpaired two-tailed Student’s t-test). Intracellular α-KG (b, n=5 mice/genotype), acetyl-CoA (c, n=5 mice/genotype), GSH/GSSG ratio (d, n=3 mice/genotype), and pyruvate (f, n=5 mice/genotype) were determined as described in Methods. These cells were also incubated with 2-NBDG and analyzed for glucose uptake by FACS (e, n=3 mice/genotype). Data are presented as mean ± SD of biological replicates. *p < 0.05; **p < 0.01; ***p < 0.001 (Unpaired two-tailed Student’s t-test). (g, h) Lin cells freshly isolated from the indicated mice (n=3 mice/genotype) were processed for metabolomics profiling using Capillary Electrophoresis Time-of-Flight Mass Spectrometry (CE-TOFMS). Hierarchical cluster analyses (HCA) of the metabolite levels are shown (g). Whole-cell lysates prepared from Lin cells were examined by immunoblotting with anti-p-mTOR, anti-p-S6K1, p-S6, p-Akt, p-Erk, Pten, and ASCT2 antibodies. Densitometric data of phosphoproteins (normalized to pan proteins) from three independent experiments are shown on the right (h). Data are presented as mean ± SD of biological replicates. **p < 0.01; ***p < 0.001 (Unpaired two-tailed Student’s t-test). (i) BM sections prepared from PtenΔ/Δ; Slc1a5−/− and PtenΔ/Δ; Slc1a5+/+ mice (n=4 mice/genotype) were examined by immunohistochemical staining for p-S6K1. Representative images from four independent experiments are shown.
Figure 7.
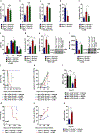
Figure 7.. Cell permeable Leu analog largely reverses the effect of ASCT2 deletion on mTOR signaling and cell survival in leukemic cells.
(a-i) Lin cells isolated from 6–8 week-old Ptenfl/flMx1-Cre; Slc1a5+/+ (PtenΔ/Δ; Slc1a5+/+) and Ptenfl/flMx1-Cre; Slc1a5−/− (PtenΔ/Δ; Slc1a5−/−) mice 10 days following pI-pC administration were cultured in the presence or absence of four nucleosides (5 μM) (a, n=3 mice/genotype), NAC (2 mM) (b, n=3 mice/genotype), dimethyl-α-KG (7 mM) (c, n=3 mice/genotype), LLME (100 μM) (e, n=4 mice/genotype), or MHY1485 (5 μM) (h, n=3 mice/genotype) for 24 hours. Cells were then assayed for apoptotic cells (Annexin V+). (d) Lin cells isolated from PtenΔ/Δ; Slc1a5+/+ and PtenΔ/Δ; Slc1a5−/− mice were processed for Leu uptake assays (n=3 mice/genotype). (f, g) Lin cells cultured in the presence or absence of LLME were assayed for the cell cycle status (f, n=3 mice/genotype) and senescent cells (g, n=3 mice/genotype). Lin cells cultured in the presence or absence of LLME for 24 hours were assayed by FACS for p-S6 levels (i, n=3 mice/genotype). Cells cultured in (h) and (i) were also assayed for p-S6 by immunoblotting. Representative results from three independent experiments are shown. Data are presented as mean ± SD of biological replicates. *p < 0.05; **p < 0.01; N.S., not significant (Unpaired two-tailed Student’s t-test). (j-l) MLL-AF9; Slc1a5+/+ and MLL-AF9; Slc1a5−/− leukemic cells were transplanted into lethally irradiated isogenic mice. Seven days after transplantation, mice were treated with LLME (50 mg/kg) or vehicle only by gavage (n= 5, 3, 5, and 10 mice for MLL-AF9; Slc1a5+/++Vehicle, MLL-AF9; Slc1a5+/++LLME, MLL-AF9-Slc1a5−/−+Vehicle, and MLL-AF9-Slc1a5−/−+LLME groups, respectively) following the 5 days-on and 2 days-off schedule for 2 weeks. Kaplan-Meier survival curves of the mice were documented. ***p < 0.001 [Log-rank (Mantel-Cox) test] (j). GFP+ leukemic cells in the PB were monitored at the indicated time points. Data are presented as mean ± SD of biological replicates. ***p < 0.001 (Unpaired two-tailed Student’s t-test) (k). WBC counts in the PB were determined 21 days after the transplantation. Data are presented as mean ± SD of biological replicates. ***p < 0.001 (Unpaired two-tailed Student’s t-test) (l). (m-o) BM cells isolated from PtenΔ/Δ; Slc1a5−/− mice 10 days following pI-pC administration were transplanted into lethally irradiated isogenic mice. Three weeks after transplantation, mice were treated with LLME (50 mg/kg) or vehicle only by gavage (n= 5 and 8 for PtenΔ/Δ; Slc1a5−/−+Vehicle and PtenΔ/Δ; Slc1a5−/− +LLME groups, respectively) following the 5 days-on and 2 days-off schedule for 3 weeks. Kaplan-Meier survival curves of the mice were documented. *p < 0.01 [Log-rank (Mantel-Cox) test] (m). Mac-1+ cells in the PB were monitored at the indicated time points. Data are presented as mean ± SD of biological replicates. ***p < 0.001 (Unpaired two-tailed Student’s t-test) (n). WBC counts in the PB were determined 60 days after the transplantation. Data are presented as mean ± SD of biological replicates. ***p < 0.001 (Unpaired two-tailed Student’s t-test) (o).
Figure 8.
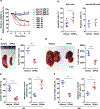
Figure 8.. Pharmacological inhibition of ASCT2 suppresses leukemia development in xenograft models of human AML.
Human primary AML cells from 6 patients and healthy BM cells from 4 individuals were treated with GPNA (1 mM) or vehicle control (DMSO) in triplicates. (a, b) Cell viability was determined at the indicated time points. Data are presented as mean ± SD of triplicates for each individual patient sample (a). Apoptotic cells (Annexin V+) were assayed by FACS analyses 24 hours later. Data are presented as mean ± SD of all patient samples. *p < 0.05 (Unpaired two-tailed Student’s t-test) (b). (c, d) Human primary AML cells were inoculated into six to eight-week-old NSG mice (1×10⁶ cells/ mouse). Once AML was established (hCD45+ cells became detectable), mice were treated with intraperitoneal injections of GPNA (20 mg/day/kg body weight) (n=6 mice) or vehicle (n=5 mice) for 4 weeks. Mice were then sacrificed. Spleen (c) and liver (d) weights were determined. Data are presented as mean ± SD of biological replicates. ***p < 0.001 (Unpaired two-tailed Student’s t-test). (e, f) Percentages of human CD34+ leukemic cells (n=8 mice/group) and frequencies of apoptotic cells in human CD34+ leukemic cells (n=5 mice/group) in the PB (e) and BM (f) were determined. Data are presented as mean ± SD of biological replicates. **p < 0.01; ***p < 0.001 (Unpaired two-tailed Student’s t-test).

References

    1. Hay N Reprogramming glucose metabolism in cancer: can it be exploited for cancer therapy? Nat Rev Cancer 16, 635–649 (2016). - PMC - PubMed
    1. Vander Heiden MG & DeBerardinis RJ Understanding the Intersections between Metabolism and Cancer Biology. Cell 168, 657–669 (2017). - PMC - PubMed
    1. Pavlova NN & Thompson CB The Emerging Hallmarks of Cancer Metabolism. Cell Metab 23, 27–47 (2016). - PMC - PubMed
    1. DeNicola GM & Cantley LC Cancer’s Fuel Choice: New Flavors for a Picky Eater. Mol Cell 60, 514–523 (2015). - PMC - PubMed
    1. Carracedo A, Cantley LC & Pandolfi PP Cancer metabolism: fatty acid oxidation in the limelight. Nat Rev Cancer 13, 227–232 (2013). - PMC - PubMed

Publication types

MeSH terms

Substances