. 2019 Sep;1(9):899-911.
doi: 10.1038/s42255-019-0109-9. Epub 2019 Sep 16.

Spatial sorting enables comprehensive characterization of liver zonation

Affiliations

Spatial sorting enables comprehensive characterization of liver zonation

Shani Ben-Moshe et al. Nat Metab. 2019 Sep.

Abstract

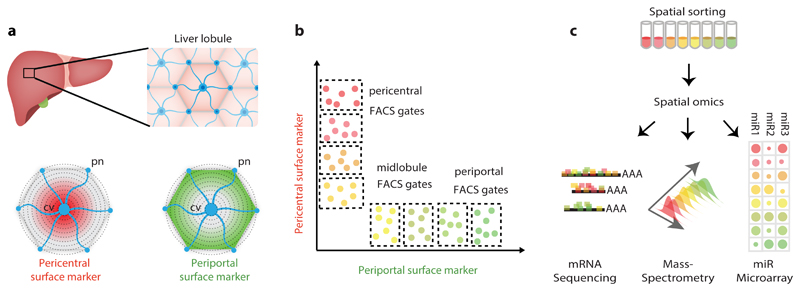
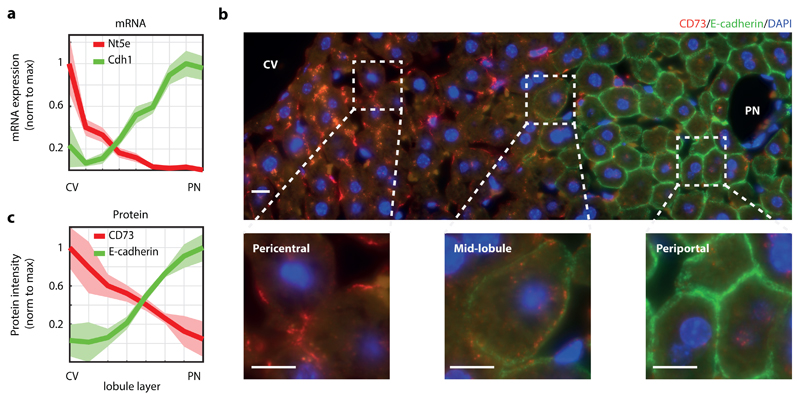
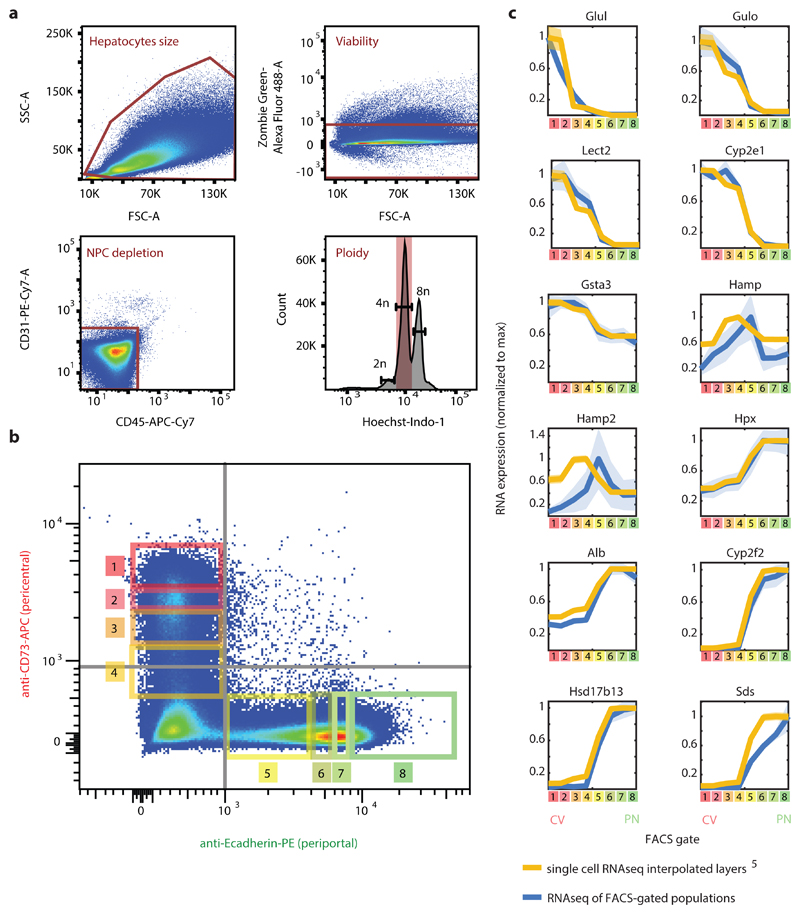
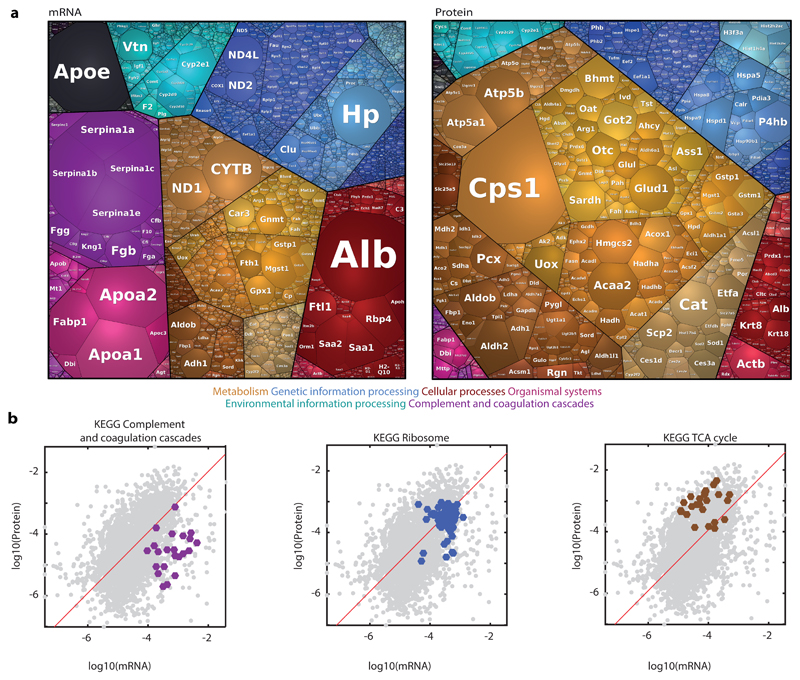
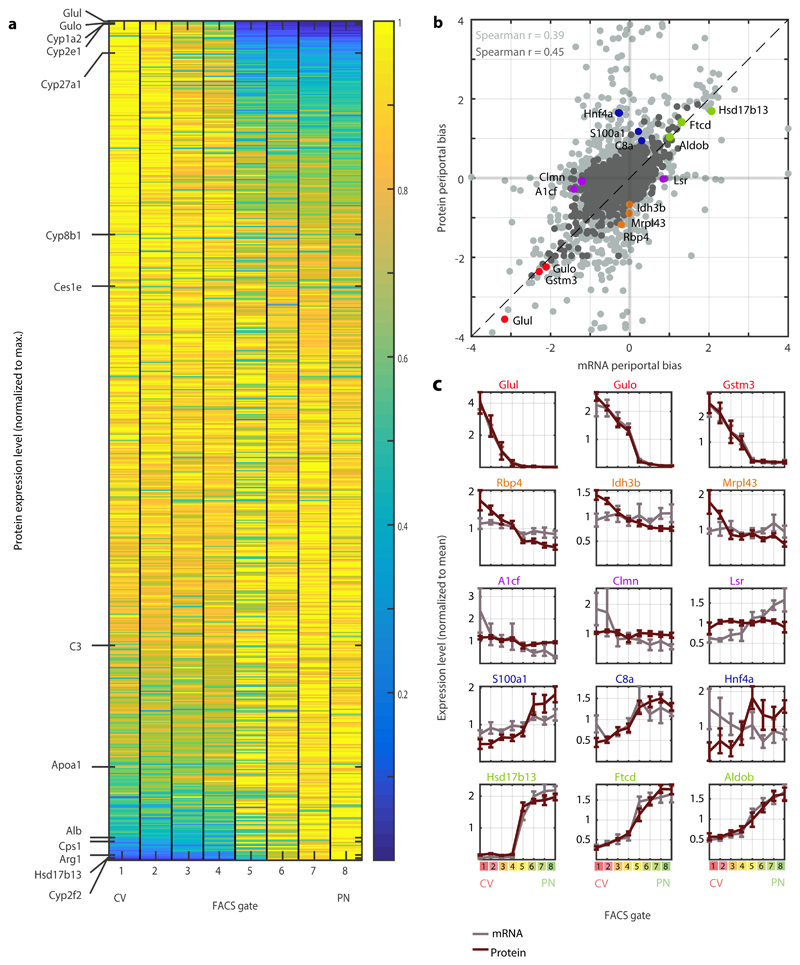
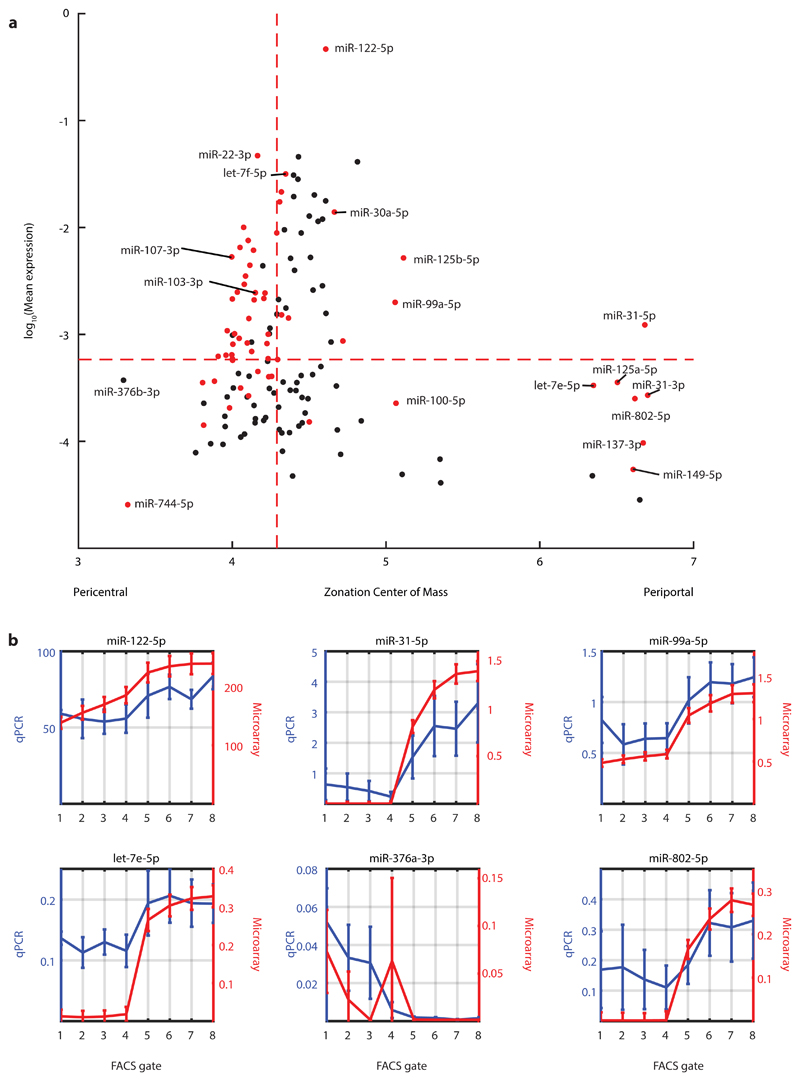
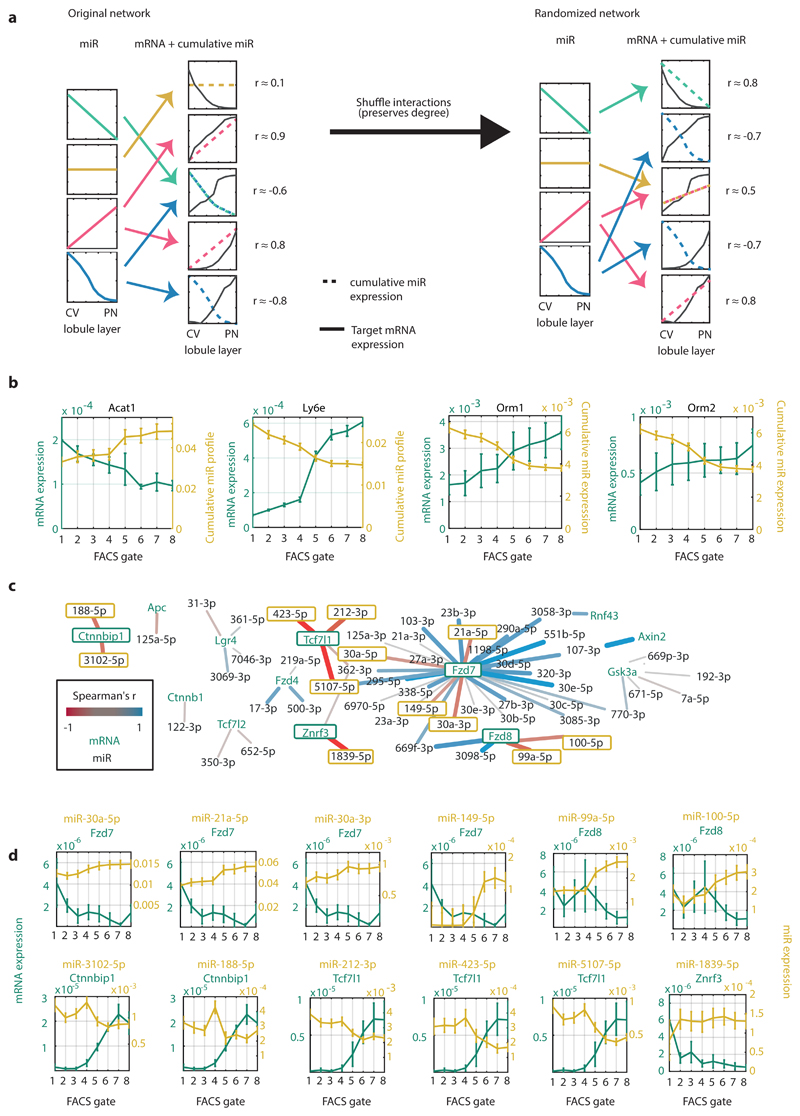
The mammalian liver is composed of repeating hexagonal units termed lobules. Spatially resolved single-cell transcriptomics revealed that about half of hepatocyte genes are differentially expressed across the lobule, yet technical limitations impeded reconstructing similar global spatial maps of other hepatocyte features. Here, we show how zonated surface markers can be used to sort hepatocytes from defined lobule zones with high spatial resolution. We apply transcriptomics, miRNA array measurements and mass spectrometry proteomics to reconstruct spatial atlases of multiple zonated features. We demonstrate that protein zonation largely overlaps with mRNA zonation, with the periportal HNF4α as an exception. We identify zonation of miRNAs such as miR-122, and inverse zonation of miRNAs and their hepatocyte target genes, highlighting potential regulation of protein levels through zonated mRNA degradation. Among the targets we find the pericentral Wnt receptors Fzd7 and Fzd8 and the periportal Wnt inhibitors Tcf7l1 and Ctnnbip1. Our approach facilitates reconstructing spatial atlases of multiple cellular features in the liver and other structured tissues.


Conflict of interest statement

Competing Financial Interest The authors declare no competing interest.

Figures

Fig. 1
Fig. 1. Spatial sorting approach for isolating large amounts of hepatocytes from distinct layers with high resolution.
a, Identification of zonated surface markers. cv – central vein. pn – portal node. b, Fluorescence-activated cell sorting (FACS) enables defining gates that enrich for zonated hepatocytes according to their surface marker expression. c, Spatially-sorted hepatocytes can be measured using multiple assays that require large input material, such as RNA-seq, Mass spectrometry and miRNA microarray applied in the current study.
Fig. 2
Fig. 2. CD73 and E-cadherin are inversely zonated surface markers.
a, CD73, encoded by Nt5e, and E-cadherin, encoded by Cdh1, are surface markers that are zonated at the mRNA level. Data taken from , n=1415 cells from 3 mice. Lines show sum-normalized mean of all cells, shaded regions are ±SEM. b, CD73 and E-cadherin proteins are zonated. Shown is an example of a lobule stained by immunofluorescence with antibodies against CD73 (red) and E-cadherin (green). Blue – DAPI nuclear stain. Scale bar – 10μm. Experiment was prformed independently on 3 different mice. c, Quantification of immunofluorescence images (n=8 lobules from three mice). Lines represent the mean of intensity measured in the lobule layer, shaded regions are ±SEM across the eight lobules. CV – central vein, PN – portal node.
Fig. 3
Fig. 3. Spatial sorting reliably captures the different lobule layers.
a, FACS gating strategy. FSC-A and SSC-A were used for hepatocytes size selection. Non-viable cells were filtered out by Zombie Green Viability kit. Staining with CD31 and CD45 antibodies enabled gating-out non-parenchymal cells. Tetraploid hepatocytes were selected based on Hoechst stain. b, Distribution of the included cells (40-60% from all events) according to intensities of CD73 and E-cadherin. Grey lines mark the unstained control limits, rectangles and numbers mark the gates used for spatially-sorted populations. Distributions from five independent mice were similar. c, Max-normalized expression patterns of selected genes along the different FACS gates in blue (N=5 mice), compared with interpolated max-normalized zonation profiles based on in yellow. Lines are the mean of each FACS gate for the 5 mice (blue) and mean of each interpolated layer for the 1415 cell from 3 mice (yellow). Line patches represent SEM.
Fig. 4
Fig. 4. Correlations between mRNA and protein levels.
a, Proteomaps for visualizing the distributions of the mean mRNA and mean proteins over all FACS gates. Each tile in the map represents a gene, size is proportional to its fraction in the total dataset. Tile colors represent different gene annotations, color-code legend is below the maps. Genes/protein closer on the maps and sharing the same color are closer in function. Visualization was done using https://bionic-vis.biologie.uni-greifswald.de/ . Color classification key for selected categories is shown at the bottom. b, Gate-averaged mRNA and protein levels are mildly correlated (Spearman’s r=0.5). Shown are three KEGG functional classifications with distinct ratios of mRNAS and proteins. Red is a linear regression line. n = 3,051 genes averaged over 5 mice.
Fig. 5
Fig. 5. A spatial atlas of the hepatocyte proteome.
a, Zonation of hepatocyte proteins. Genes are sorted by the zonation profile center of mass. Representative liver proteins are shown on the left, to demonstrate the zonation profiles visualization. Protein levels were normalized to the maximal level across all FACS gates. b, Periportal bias in expression of mRNA and proteins, calculated as the difference between the two periportal gates and the two pericentral gates, normalized by the mean expression across all gates. Light grey – all matched mRNA and proteins (n=3,051). Dark grey – mRNA and proteins with minimal expression fraction higher than 10-5 in any of the gates for both mRNA and protein (n=1,565). Spearman’s r is indicated for each dataset. Dashed line marks a slope of 1. N=5 mice c, Expression profiles of mRNA (grey) and their respective proteins (red). Mean of five mice is plotted. Error bars represent SEM.
Fig. 6
Fig. 6. Zonated expression of hepatocyte miRNAs.
a, Mean expression vs. zonation profile center of mass for all detected high-confidence miRNAs. Selected miRNAs are labelled. Dashed red lines denote the median of each quantity. Red dots are miRNAs that are significantly zonated (two sided Kruskal-Wallis test with following Benjamini-Hochberg FDR ≤ 0.2). N=3 mice. b, Validations of hepatocyte miRNA zonation profiles using qRT-PCR. Profiles for both qRT-PCR and microarrays are normalized by expression levels of miR-103-3p (Spearman’s r = 0.70±0.24). Lines indicate layer mean over 3 microarry mouse-repeats (red) and layer mean over 3 qPCR mouse-repeats (blur). Error bars indicate SEM. Discrepancies between qRT-PCR and microarray profiles for let-7e-5p, miR-376a and miR-802-5p may be due to limited sensitivity of the microarray at low expression levels. N=3 mice for microarray and for qPCR.
Fig. 7
Fig. 7. Network analysis of miRNA-target interactions.
a, Schematic illustration of the algorithm for inferring significant interactions between miRNAs and target genes. b, Zonation profiles of selected genes and their significantly anti-correlated cumulative miRNA profiles. Lines represent mean of 5 mice for mRNA (green) and 3 mice for miRNA (yellow). Error bars are SEM. c, Regulatory network of hepatocyte-expressed Wnt pathway components and their expressed regulating miRNAs. Edges colored by the correlation between the miRNA and target. Edge weight is proportional to the absolute correlation value. N=3 mice for miRNA dataset, 5 mice for mRNA set. d, Selected pairs of miRNAs and regulated Wnt signaling components (outlined in green in Fig. 7c). The transcripts of Ctnnbip1, Fzd8, Tcf7l1 and Znrf3 are anti-correlated with most of their regulating miRs, suggesting that miRNAs have a relatively more important role in regulating these genes’ expression in comparison to other genes. Lines represent mean of 5 mice for mRNA (green) and 3 mice for miRNA (yellow). Error bars are SEM.

References

    1. Hoehme S, et al. Prediction and validation of cell alignment along microvessels as order principle to restore tissue architecture in liver regeneration. Proc Natl Acad Sci U S A. 2010;107:10371. - PMC - PubMed
    1. Wang B, Zhao L, Fish M, Logan CY, Nusse R. Self-renewing diploid Axin2+ cells fuel homeostatic renewal of the liver. Nature. 2015;524:180–185. - PMC - PubMed
    1. Colnot S, Perret C. Molecular Pathology of Liver Diseases. Springer; Boston, MA: 2011. Liver Zonation; pp. 7–16. - DOI
    1. Odom DT, et al. Control of Pancreas and Liver Gene Expression by HNF Transcription Factors. Science. 2004;303:1378–1381. - PMC - PubMed
    1. Halpern KB, et al. Single-cell spatial reconstruction reveals global division of labour in the mammalian liver. Nature. 2017;542:352. - PMC - PubMed

Publication types