Weight gain is associated with changes in neural response to palatable food tastes varying in sugar and fat and palatable food images: a repeated-measures fMRI study
- PMID: 31535135
- PMCID: PMC6885480
- DOI: 10.1093/ajcn/nqz204
Weight gain is associated with changes in neural response to palatable food tastes varying in sugar and fat and palatable food images: a repeated-measures fMRI study
Abstract
Background: Emerging data suggest that weight gain is associated with changes in neural response to palatable food tastes and palatable food cues, which may serve to maintain overeating.
Objective: We investigated whether weight gain is associated with neural changes in response to tastes of milkshakes varying in fat and sugar content and palatable food images.
Methods: We compared changes in neural activity between initially healthy-weight adolescents who gained weight (n = 36) and those showing weight stability (n = 31) over 2-3 y.
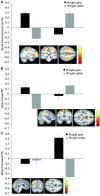
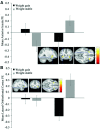
Results: Adolescents who gained weight compared with those who remained weight stable showed decreases in activation in the postcentral gyrus, prefrontal cortex, insula, and anterior cingulate cortex, and increases in activation in the parietal lobe, posterior cingulate cortex, and inferior frontal gyrus in response to a high-fat/low-sugar compared with low-fat/low-sugar milkshake. Weight gainers also showed greater decreases in activation in the anterior insula and lateral orbitofrontal cortex in response to a high-fat/high-sugar compared with low-fat/low-sugar milkshake than those who remained weight stable. No group differences emerged in response to a low-fat/high-sugar compared with a low-fat/low-sugar milkshake. Weight gainers compared with those who remained weight stable showed greater decreases in activation in the middle temporal gyrus and increases in cuneus activation in response to appetizing compared with unappetizing food pictures. The significant interactions were partially driven by group differences in baseline responsivity and by opposite changes in neural activation in adolescents who remained weight stable.
Conclusions: Data suggest that weight gain is associated with a decrease in responsivity of regions associated with taste and reward processing to palatable high-fat- and high-fat/high-sugar food tastes. Data also suggest that avoiding weight gain increases taste sensitivity, which may prevent future excessive weight gain.This trial was registered at clinicaltrials.gov as NCT01949636.
Keywords: food image; food taste; repeated-measures fMRI; reward; taste processing; weight gain.
Copyright © American Society for Nutrition 2019.
Figures


Similar articles
-
Relation of neural response to palatable food tastes and images to future weight gain: Using bootstrap sampling to examine replicability of neuroimaging findings.Neuroimage. 2018 Dec;183:522-531. doi: 10.1016/j.neuroimage.2018.08.035. Epub 2018 Aug 23. Neuroimage. 2018. PMID: 30144570 Free PMC article.
-
Gain in Body Fat Is Associated with Increased Striatal Response to Palatable Food Cues, whereas Body Fat Stability Is Associated with Decreased Striatal Response.J Neurosci. 2016 Jun 29;36(26):6949-56. doi: 10.1523/JNEUROSCI.4365-15.2016. J Neurosci. 2016. PMID: 27358453 Free PMC article.
-
Relative ability of fat and sugar tastes to activate reward, gustatory, and somatosensory regions.Am J Clin Nutr. 2013 Dec;98(6):1377-84. doi: 10.3945/ajcn.113.069443. Epub 2013 Oct 16. Am J Clin Nutr. 2013. PMID: 24132980 Free PMC article. Clinical Trial.
-
Neural vulnerability factors for obesity.Clin Psychol Rev. 2019 Mar;68:38-53. doi: 10.1016/j.cpr.2018.12.002. Epub 2018 Dec 19. Clin Psychol Rev. 2019. PMID: 30587407 Free PMC article. Review.
-
Sugars and Sweet Taste: Addictive or Rewarding?Int J Environ Res Public Health. 2021 Sep 17;18(18):9791. doi: 10.3390/ijerph18189791. Int J Environ Res Public Health. 2021. PMID: 34574716 Free PMC article. Review.
Cited by
-
Associations Between Exposure to Gestational Diabetes Mellitus In Utero and Daily Energy Intake, Brain Responses to Food Cues, and Adiposity in Children.Diabetes Care. 2021 May;44(5):1185-1193. doi: 10.2337/dc20-3006. Epub 2021 Apr 7. Diabetes Care. 2021. PMID: 33827804 Free PMC article.
-
The development and testing of the TTU food cue reactivity image bank.Int J Obes (Lond). 2025 Jul 26. doi: 10.1038/s41366-025-01856-9. Online ahead of print. Int J Obes (Lond). 2025. PMID: 40715763
-
Much Ado About Missingness: A Demonstration of Full Information Maximum Likelihood Estimation to Address Missingness in Functional Magnetic Resonance Imaging Data.Front Neurosci. 2021 Sep 30;15:746424. doi: 10.3389/fnins.2021.746424. eCollection 2021. Front Neurosci. 2021. PMID: 34658780 Free PMC article.
-
The Effect of a 14-Day gymnema sylvestre Intervention to Reduce Sugar Cravings in Adults.Nutrients. 2022 Dec 12;14(24):5287. doi: 10.3390/nu14245287. Nutrients. 2022. PMID: 36558446 Free PMC article. Clinical Trial.
-
Enhancing Efficacy of a Brief Obesity and Eating Disorder Prevention Program: Long-Term Results from an Experimental Therapeutics Trial.Nutrients. 2023 Feb 17;15(4):1008. doi: 10.3390/nu15041008. Nutrients. 2023. PMID: 36839366 Free PMC article. Clinical Trial.
References
Publication types
MeSH terms
Substances
Associated data
LinkOut - more resources
Full Text Sources
Medical

