. 2020 Jan;15(1):169-177.
doi: 10.4103/1673-5374.264463.

Claudin-15 overexpression inhibits proliferation and promotes apoptosis of Schwann cells in vitro

Affiliations

Claudin-15 overexpression inhibits proliferation and promotes apoptosis of Schwann cells in vitro

Jian-Nan Li et al. Neural Regen Res. 2020 Jan.

Abstract

Our previous experiments have discovered that Claudin-15 was up-regulated in Schwann cells of the distal nerve stumps of rat models of sciatic nerve injury. However, how Claudin-15 affects Schwann cell function is still unknown. This study aimed to identify the effects of Claudin-15 on proliferation and apoptosis of Schwann cells cultured in vitro and explore the underlying mechanisms. Primary Schwann cells were obtained from rats. Claudin-15 in Schwann cells was knocked down using siRNA (siRNA-1 group) compared with the negative control siRNA transfection group (negative control group). Claudin-15 in Schwann cells was overexpressed using pGV230-Claudin-15 plasmid (pGV230-Claudin-15 group). The pGV230 transfection group (pGV230 group) acted as the control of the pGV230-Claudin-15 group. Cell proliferation was analyzed with EdU assay. Cell apoptosis was analyzed with flow cytometric analysis. Cell migration was analyzed with Transwell inserts. The mRNA and protein expressions were analyzed with quantitative polymerase chain reaction assay and western blot assay. The results showed that compared with the negative control group, cell proliferation rate was up-regulated; p-AKT/AKT ratio, apoptotic rate, p-c-Jun/c-Jun ratio, mRNA expression of protein kinase C alpha, Bcl-2 and Bax were down-regulated; and mRNA expression of neurotrophins basic fibroblast growth factor and neurotrophin-3 were increased in the siRNA-1 group. No significant difference was found in cell migration between the negative control and siRNA-1 groups. Compared with the pGV230 group, the cell proliferation rate was down-regulated; apoptotic rate, p-c-Jun/c-Jun ratio and c-Fos protein expression increased; mRNA expression of protein kinase C alpha and Bax decreased; and mRNA expressions of neurotrophins basic fibroblast growth factor and neurotrophin-3 were up-regulated in the pGV230-Claudin-15 group. The above results demonstrated that overexpression of Claudin-15 inhibited Schwann cell proliferation and promoted Schwann cell apoptosis in vitro. Silencing of Claudin-15 had the reverse effect and provided neuroprotective effect. This study was approved by the Experimental Animal Ethics Committee of Jilin University of China (approval No. 2016-nsfc001) on March 5, 2016.

Keywords: Bax; Claudin-15; Schwann cells; Wallerian degeneration; apoptosis; c-Jun; cell proliferation; nerve regeneration; peripheral nerve injury; protein kinase C alpha.


Conflict of interest statement

None

Figures

Figure 1
Figure 1
Claudin-15 mRNA expression changes after siRNA knockdown and overexpression in cultured Schwann cells. (A) Relative levels of Claudin-15 mRNA expression after siRNA transfection compared to the negative control. (B) Western blot assay of Claudin-15 after siRNA transfection. The upper panel shows target bands of Claudin-15; the lower panel shows the loading control GAPDH. (C) Relative levels of Claudin-15 protein expression after siRNA transfection. (D) Relative levels of Claudin-15 mRNA expression after pGV230-Claudin-15 transfection. (E) Western blot assay of Claudin-15 after pGV230-Claudin-15 transfection. The upper panel shows target bands of Claudin-15; the lower panel shows the loading control GAPDH. (F) Relative levels of Claudin-15 protein expression after pGV230-Claudin-15 transfection. *P < 0.05, vs. NC group; #P < 0.05, vs. pGV230 group. Average blot density of control group blot was set as 100%. The relative optical density value of p-GV230-Claudin-15 group was obtained by dividing its optical density with the optical density values of the NC or pGV230 group. Assays were performed in triplicate. Data are shown as the mean ± SEM (A: Unpaired Student’s t-test; C, D, F: one-way analysis of variance followed by Tukey’s post hoc test). GAPDH: Gyceraldehyde-3-phosphate dehydrogenase; NC: negative control.
Figure 2
Figure 2
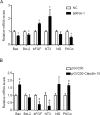
Gene expression changes in Claudin-15 siRNA-1 knockdown and pGV230-Claudin-15 overexpresed Schwann cells in vitro. (A) Relative levels of Bax, Bcl-2, bFGF, NT3, Nf2 and PKCα mRNA expression of siRNA-1 transfected Schwann cells. GAPDH was used as normalizer. (B) Relative levels of Bax, Bcl-2, bFGF, NT3, Nf2 and PKCα mRNA expression of pGV230-Claudin-15 transfected Schwann cells. GAPDH was used as normalizer. *P < 0.05, vs. NC group; #P < 0.05, vs. pGV230 group. All experiments were performed in triplicate. Data are shown as the mean ± SEM (unpaired Student’s t-test). Bax: Bcl-2-associated X protein; Bcl-2: B-cell lymphoma 2; bFGF: basic fibroblast growth factor; GAPDH: glyceraldehyde-3-phosphate dehydrogenase; NC: negative control; Nf2: neurofibromin-2; NT3: neurotrophin-3; PKCα: protein kinase C alpha.
Figure 3
Figure 3
Claudin-15 knockdown and overexpression affect Schwann cells proliferation in vitro. (A–D) Proliferation of Schwann cells in the NC (A), siRNA-1 (B), pGV230 (C), and pGV230-Claudin-15 (D) groups was determined by EdU staining. Images are taken by a fluorescence microscope. Merged image of EdU-positive Schwann cells (Red) and cell nuclei labeled by Hoechst 33342 (blue). Scale bar: 100 μm. (E) Cell proliferation rate of siRNA-1 group compared with NC group. (F) Cell proliferation rate of pGV230-Claudin-15 group compared with pGV230 group. **P < 0.01, vs. NC group; #P < 0.05, vs. pGV230 group. All experiments were performed in triplicate. Data are shown as the mean ± SEM (unpaired Student’s t-test). EdU: 5-Ethynyl-20-deoxyuridine; NC: negative control.
Figure 4
Figure 4
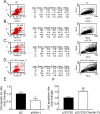
Claudin-15 knockdown and overexpression affect Schwann cells apoptosis (Annexin V-FITC/PI Assay) in vitro. (A–D) Apoptosis of Schwann cells in the NC group (A), siRNA-1 group (B), pGV230 group (C) and p-GV230-Claudin-15 group (D) was measured by Annexin V-FITC/PI assay. (E) The rate of apoptosis of Schwann cells in the siRNA-1 group compared with NC group. (F) The rate of apoptosis of Schwann cells in pGV230-Claudin-15 group compared with pGV230 group. *P < 0.05, vs. NC group; ##P < 0.01, vs. pGV230 group. Average number of proliferating cells in NC or pGV230 group was set as 100%. The cell proliferation rate of p-GV230-Claudin-15 group was obtained by dividing its number of proliferating cells with the average number of proliferating cells in the NC or pGV230 group. The results were exhibited as fold change. All experiments were performed in triplicate. Data are shown as the mean ± SEM (unpaired Student's t-test). FITC: Fluorescein isothiocyanate; NC: negative control; PI: propidium iodide.
Figure 5
Figure 5
Claudin-15 knockdown and overexpression affect Schwann cells migration in vitro. (A–D) Migrated Schwann cells in NC group (A), siRNA-1 group (B), pGV230 group (C) and pGV230-Claudin-15 group (D). Migrated Schwann cells were stained with crystal violet solution. Images are taken by an inverted light microscope. Scale bar: 50 μm. (E) Cell migration rate of Schwann cells in siRNA-1 group compared with NC group. (F) Cell migration rate of Schwann cells in pGV230-Claudin-15 group compared with pGV230 group. Assays were performed in triplicate. Data are shown as the mean ± SEM (unpaired Student’s t-test). NC: Negative control.
Figure 6
Figure 6
Silencing of Claudin-15 down-regulates AKT and c-Jun signaling pathways in vitro. (A) Western blot assay of Claudin-15, p-AKT, AKT, p-ERK, ERK, c-Jun, p-c-Jun, β-catenin and c-Fos expression after siRNA-1 transfection. The top panels show target bands of Claudin-15, p-AKT, AKT, p-ERK, ERK, c-Jun, p-c-Jun, β-catenin and c-Fos. The bottom panel shows the loading control GAPDH. (B–D) Relative levels of p-AKT/AKT (B), p-ERK/ERK (C) and p-c-Jun/c-Jun (D) protein activation ratio after siRNA-1 transfected Schwann cells. (E, F) Relative levels of β-catenin (E) and c-Fos (F) protein expression of siRNA-1 transfected Schwann cells. *P < 0.05, vs. NC group. Average blot density of control group was set as 100%. The relative optical density value of p-GV230-Claudin-15 group was obtained by dividing its optical density with the optical density values of NC or pGV230 group. Assays were performed in triplicate. Data are shown as the mean ± SEM (unpaired Student’s t-test). ERK: Extracellular signal-regulated kinase; GAPDH: glyceraldehyde-3-phosphate dehydrogenase; NC: negative control.
Figure 7
Figure 7
Overexpression of Claudin-15 activates c-Jun and c-Fos signaling pathways in vitro. (A) Western blot assay of Claudin-15, p-AKT, AKT, p-ERK, ERK, c-Jun, p-c-Jun, β-catenin and c-Fos expression after pGV230-Claudin-15 transfection. The top panels show target bands of Claudin-15, p-AKT, AKT, p-ERK, ERK, c-Jun, p-c-Jun, β-catenin and c-Fos. The bottom panel shows the loading control GAPDH. (B–D) Relative levels of p-AKT/AKT (B), p-ERK/ERK (C) and p-c-Jun/c-Jun (D) protein activation ratio after pGV230-Claudin-15 transfected Schwann cells. (E, F) Relative levels of β-catenin (E) and c-Fos (F) protein expression of pGV230-Claudin-15 transfected Schwann cells. #P < 0.05, vs. pGV230 group. Average blot density of control group blot was set as 100%. The relative optical density value of p-GV230-Claudin-15 group was obtained by dividing its optical density with the optical density values of NC or pGV230 group. Assays were performed in triplicate. Data are shown as the mean ± SEM (unpaired Student’s t-test). ERK: Extracellular signal-regulated kinase; GAPDH: glyceraldehyde-3-phosphate dehydrogenase; NC: negative control.

References

    1. Abou-Kandil A, Chamias R, Huleihel M, Godbey WT, Aboud M. Differential role of PKC-induced c-Jun in HTLV-1 LTR activation by 12-O-tetradecanoylphorbol-13-acetate in different human T-cell lines. PLoS One. 2012;7:e29934. - PMC - PubMed
    1. Alberini G, Benfenati F, Maragliano L. Molecular dynamics simulations of ion selectivity in a claudin-15 paracellular channel. J Phys Chem B. 2018 doi: 10.1021/acs.jpcb.8b06484. - PubMed
    1. Bi C, Cai Q, Shan Y, Yang F, Sun S, Wu X, Liu H. Sevoflurane induces neurotoxicity in the developing rat hippocampus by upregulating connexin 43 via the JNK/c-Jun/AP-1 pathway. Biomed Pharmacother. 2018;108:1469–1476. - PubMed
    1. Cao P, Wang HN, Tian WF, Sun NC, Bai JB, Yu KL, Tian DH. Human amniotic membrane repairs acute sciatic nerve injury in rat models. Zhongguo Zuzhi Gongcheng Yanjiu. 2019;23:1046–1051.
    1. Campbell KJ, Tait SWG. Targeting BCL-2 regulated apoptosis in cancer. Open Biol. 2018 doi: 10.1098/rsob.180002. - PMC - PubMed