. 2020 Mar;83(3):988-1002.
doi: 10.1002/mrm.27989. Epub 2019 Sep 19.

Accelerated free-breathing whole-heart 3D T2 mapping with high isotropic resolution

Affiliations

Accelerated free-breathing whole-heart 3D T2 mapping with high isotropic resolution

Aurélien Bustin et al. Magn Reson Med. 2020 Mar.

Abstract

Purpose: To enable free-breathing whole-heart 3D T2 mapping with high isotropic resolution in a clinically feasible and predictable scan time. This 3D motion-corrected undersampled signal matched (MUST) T2 map is achieved by combining an undersampled motion-compensated T2 -prepared Cartesian acquisition with a high-order patch-based reconstruction.

Methods: The 3D MUST-T2 mapping acquisition consists of an electrocardiogram-triggered, T2 -prepared, balanced SSFP sequence with nonselective saturation pulses. Three undersampled T2 -weighted volumes are acquired using a 3D Cartesian variable-density sampling with increasing T2 preparation times. A 2D image-based navigator is used to correct for respiratory motion of the heart and allow 100% scan efficiency. Multicontrast high-dimensionality undersampled patch-based reconstruction is used in concert with dictionary matching to generate 3D T2 maps. The proposed framework was evaluated in simulations, phantom experiments, and in vivo (10 healthy subjects, 2 patients) with 1.5-mm3 isotropic resolution. Three-dimensional MUST-T2 was compared against standard multi-echo spin-echo sequence (phantom) and conventional breath-held single-shot 2D SSFP T2 mapping (in vivo).

Results: Three-dimensional MUST-T2 showed high accuracy in phantom experiments (R2 > 0.99). The precision of T2 values was similar for 3D MUST-T2 and 2D balanced SSFP T2 mapping in vivo (5 ± 1 ms versus 4 ± 2 ms, P = .52). Slightly longer T2 values were observed with 3D MUST-T2 in comparison to 2D balanced SSFP T2 mapping (50.7 ± 2 ms versus 48.2 ± 1 ms, P < .05). Preliminary results in patients demonstrated T2 values in agreement with literature values.

Conclusion: The proposed approach enables free-breathing whole-heart 3D T2 mapping with high isotropic resolution in about 8 minutes, achieving accurate and precise T2 quantification of myocardial tissue in a clinically feasible scan time.

Keywords: T2 quantification; fast imaging; isotropic resolution; motion correction; myocardial T2 mapping.


Conflict of interest statement

Dr. Radhouene Neji is employed by Siemens Healthcare, Frimley, United Kingdom.

Figures

Figure 1
Figure 1
Schematic overview of the proposed free‐breathing 3D motion‐corrected undersampled signal matched (MUST) T2 technique for whole‐heart myocardial T2 mapping. Three T2‐prepared volumes are acquired sequentially with increasing TET2prep ([0,28,55] ms). A nonselective saturation pulse is applied immediately after the electrocardiogram (ECG) R‐wave to avoid recovery heartbeats. A 2D image navigator is acquired to enable translational respiratory motion correction of the heart and shorter and predictable scan times. A golden‐angle shifted variable‐density Cartesian undersampling is used to achieve clinically feasible scan times. All T2 prepared volumes are reconstructed simultaneously with high‐dimensionality undersampled patch‐based reconstruction (HD‐PROST).18 A dictionary is then simulated and matched to the measured signal to generate the whole‐heart T2 maps. Abbreviations: AW, acquisition window; bSSFP, balanced SSFP; iNAV, image‐based navigator; TD, trigger delay; TSAT, saturation time
Figure 2
Figure 2
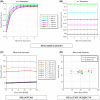
Results from extended phase graph (EPG) simulations show the effect of the saturation pulse on the MR signal evolution. A, Simulated magnetization obtained with the EPG formalism for different recovery times (ranging from 0 to 9 seconds) when the saturation pulse is not used. The signals were generated for tissues with a T2 of 50 ms, varying T1s (ranging from 700 ms to 1200 ms), TET2prep = 50 ms, and a simulated heart rate of 60 bpm. For long T1s, a minimum of about 6 idle heartbeats are needed to allow for full recovery of the longitudinal magnetization. B, When the saturation pulse is applied at every heartbeat, idle heartbeats are not required for signal recovery, at the cost of lower signal intensity. C, Evolution of the matched T2 values obtained with the proposed 3D MUST‐T2 mapping sequence over different simulated heart rates (ranging from 50 bpm to 100 bpm) for each phantom vial. The proposed approach is mostly insensitive to heart‐rate variations, even for long T1s. D, Effect of different heart rates across all healthy subjects (N = 10) on mean T2 values. Abbreviations: BPM, beats per minute
Figure 3
Figure 3
Phantom accuracy for the proposed 3D MUST‐T2 sequence. Plots compare the mean T2 values derived from the 9 vials for 5 different acceleration factors with the ground‐truth T2 values (measured by spin echo [SE] with 8 TEs from 10‐640 ms29), conventional 2D T2p‐SSFP mapping (green), and the proposed 3D MUST‐T2 sequence. The T2 accuracy is preserved with the proposed approach with excellent agreement with the reference T2 values, even for high acceleration (×5). The T2 values for the last tube (T2 = 250ms) were out of range (> 300 ms) for the 2D T2p‐SSFP sequence and therefore are not shown
Figure 4
Figure 4
The T2 maps obtained using the proposed free‐breathing 3D MUST‐T2 sequence and the conventional breath‐held 2D T2p‐SSFP sequence are shown for 3 healthy subjects. The 3D MUST‐T2 slices were reformatted to short axis to match the 2D T2 map acquisitions. Good visualization of the myocardium and surrounding structures can be observed on the 3D MUST‐T2 maps. Acquisition times are expressed as minutes:seconds. Abbreviations: AT, acquisition time
Figure 5
Figure 5
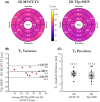
Accuracy and precision of the proposed 3D MUST‐T2 mapping sequence. A, The T2 accuracy of the proposed 3D MUST‐T2 sequence versus conventional 2D T2p‐SSFP, as measured by the mean T2 value, are shown in the left ventricular segmentation. The T2 values are in good agreement with the literature (T2 = 50 ± 4 ms33). The averaged T2 relaxation times over the whole myocardium are shown in the bull's eye plots' center. Accuracy (B) and precision (C) of T2 relaxation times (ms) obtained in the myocardial septum with the proposed 3D MUST‐T2 and the conventional 2D T2p‐SSFP are shown for the 10 healthy subjects
Figure 6
Figure 6
Three‐dimensional visualization of the acquired T2‐weighted images and the corresponding T2 volume. Representative T2‐weighted images for subject 2 (acquisition time: 10 minutes, heart rate = 38 bpm), and the corresponding T2 maps obtained by the proposed 3D MUST‐ T2. Eight reformatted short‐axis slices that cover the heart from apex to base are shown. Uniform distribution of T2 values through the slices over the whole left ventricle can be observed. The color scale indicates T2 values between 0 ms and 120 ms
Figure 7
Figure 7
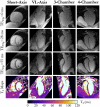
Representative T2‐prepared images for subject 2 and the corresponding T2 maps obtained with the proposed 3D MUST‐T2 sequence. Reformats in short‐axis, vertical long‐axis (VL), 3‐chamber, and 4‐chamber views are shown
Figure 8
Figure 8
Short‐axis T2 maps at apical, midventricular, and basal level for 2 patients acquired with the proposed free‐breathing 3D MUST‐T2 framework and the conventional breath‐hold 2D T2p‐SSFP sequence. The septal T2 relaxation times for each slice are reported as mean ± SD

References

    1. Guo H, Au W‐Y, Cheung JS, et al. Myocardial T2 quantitation in patients with iron overload at 3 Tesla. J Magn Reson Imaging. 2009;30:394–400. - PMC - PubMed
    1. He T, Gatehouse PD, Anderson LJ, et al. Development of a novel optimized breathhold technique for myocardial T2 measurement in thalassemia. J Magn Reson Imaging. 2006;24:580–585. - PubMed
    1. Giri S, Chung Y‐C, Merchant A, et al. T2 quantification for improved detection of myocardial edema. J Cardiovasc Magn Reson. 2009;11:1–13. - PMC - PubMed
    1. Haberkorn SM, Spieker M, Jacoby C, Flögel U, Kelm M, Bönner F. State of the art in cardiovascular T2 mapping: on the way to a cardiac biomarker? Curr Cardiovasc Imaging Rep. 2018;11.
    1. Van Heeswijk RB, Piccini D, Feliciano H, Hullin R, Schwitter J, Stuber M. Self‐navigated isotropic three‐dimensional cardiac T2 mapping. Magn Reson Med. 2015;73:1549–1554. - PubMed

Publication types