A distinct transition from cell growth to physiological homeostasis in the tendon
- PMID: 31535975
- PMCID: PMC6791717
- DOI: 10.7554/eLife.48689
A distinct transition from cell growth to physiological homeostasis in the tendon
Abstract
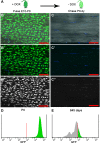
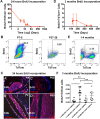
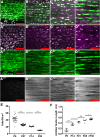
Changes in cell proliferation define transitions from tissue growth to physiological homeostasis. In tendons, a highly organized extracellular matrix undergoes significant postnatal expansion to drive growth, but once formed, it appears to undergo little turnover. However, tendon cell activity during growth and homeostatic maintenance is less well defined. Using complementary methods of genetic H2B-GFP pulse-chase labeling and BrdU incorporation in mice, we show significant postnatal tendon cell proliferation, correlating with longitudinal Achilles tendon growth. Around day 21, there is a transition in cell turnover with a significant decline in proliferation. After this time, we find low amounts of homeostatic tendon cell proliferation from 3 to 20 months. These results demonstrate that tendons harbor significant postnatal mitotic activity, and limited, but detectable activity in adult and aged stages. It also points towards the possibility that the adult tendon harbors resident tendon progenitor populations, which would have important therapeutic implications.
Keywords: developmental biology; homeostasis; mouse; musculoskeletal; regenerative medicine; stem cells; tendon; tissue growth.
© 2019, Grinstein et al.
Conflict of interest statement
MG, HD, LO, KZ, TC, JG No competing interests declared
Figures


Similar articles
-
Single-cell transcriptomic analysis identifies extensive heterogeneity in the cellular composition of mouse Achilles tendons.Am J Physiol Cell Physiol. 2020 Nov 1;319(5):C885-C894. doi: 10.1152/ajpcell.00372.2020. Epub 2020 Sep 2. Am J Physiol Cell Physiol. 2020. PMID: 32877217 Free PMC article.
-
Characterization and comparison of post-natal rat Achilles tendon-derived stem cells at different development stages.Sci Rep. 2016 Mar 14;6:22946. doi: 10.1038/srep22946. Sci Rep. 2016. PMID: 26972579 Free PMC article.
-
Transcription factor scleraxis vitally contributes to progenitor lineage direction in wound healing of adult tendon in mice.J Biol Chem. 2018 Apr 20;293(16):5766-5780. doi: 10.1074/jbc.RA118.001987. Epub 2018 Mar 5. J Biol Chem. 2018. PMID: 29507095 Free PMC article.
-
The role of vasculature and angiogenesis for the pathogenesis of degenerative tendons disease.Scand J Med Sci Sports. 2005 Aug;15(4):211-22. doi: 10.1111/j.1600-0838.2005.00465.x. Scand J Med Sci Sports. 2005. PMID: 15998338 Review.
-
Rescue plan for Achilles: Therapeutics steering the fate and functions of stem cells in tendon wound healing.Adv Drug Deliv Rev. 2018 Apr;129:352-375. doi: 10.1016/j.addr.2017.12.016. Epub 2017 Dec 24. Adv Drug Deliv Rev. 2018. PMID: 29278683 Review.
Cited by
-
Tendon Stem/Progenitor Cell Subpopulations and Their Implications in Tendon Biology.Front Cell Dev Biol. 2021 Feb 18;9:631272. doi: 10.3389/fcell.2021.631272. eCollection 2021. Front Cell Dev Biol. 2021. PMID: 33681210 Free PMC article.
-
A latent Axin2+/Scx+ progenitor pool is the central organizer of tendon healing.NPJ Regen Med. 2024 Oct 17;9(1):30. doi: 10.1038/s41536-024-00370-2. NPJ Regen Med. 2024. PMID: 39420021 Free PMC article.
-
Tenogenic Induction From Induced Pluripotent Stem Cells Unveils the Trajectory Towards Tenocyte Differentiation.Front Cell Dev Biol. 2022 Mar 9;10:780038. doi: 10.3389/fcell.2022.780038. eCollection 2022. Front Cell Dev Biol. 2022. PMID: 35372337 Free PMC article.
-
Interfacial Tissue Regeneration with Bone.Curr Osteoporos Rep. 2024 Apr;22(2):290-298. doi: 10.1007/s11914-024-00859-1. Epub 2024 Feb 15. Curr Osteoporos Rep. 2024. PMID: 38358401 Free PMC article. Review.
-
Single-cell transcriptomic analysis identifies extensive heterogeneity in the cellular composition of mouse Achilles tendons.Am J Physiol Cell Physiol. 2020 Nov 1;319(5):C885-C894. doi: 10.1152/ajpcell.00372.2020. Epub 2020 Sep 2. Am J Physiol Cell Physiol. 2020. PMID: 32877217 Free PMC article.
References
-
- Banes AJ, Donlon K, Link GW, Gillespie Y, Bevin AG, Peterson HD, Bynum D, Watts S, Dahners L. Cell populations of tendon: a simplified method for isolation of synovial cells and internal fibroblasts: confirmation of origin and biologic properties. Journal of Orthopaedic Research. 1988;6:83–94. doi: 10.1002/jor.1100060111. - DOI - PubMed
-
- Bassat E, Mutlak YE, Genzelinakh A, Shadrin IY, Baruch Umansky K, Yifa O, Kain D, Rajchman D, Leach J, Riabov Bassat D, Udi Y, Sarig R, Sagi I, Martin JF, Bursac N, Cohen S, Tzahor E. The extracellular matrix protein agrin promotes heart regeneration in mice. Nature. 2017;547:179–184. doi: 10.1038/nature22978. - DOI - PMC - PubMed
Publication types
MeSH terms
Grants and funding
LinkOut - more resources
Full Text Sources
Molecular Biology Databases

