

Interrogation of CYP2D6 Structural Variant Alleles Improves the Correlation Between CYP2D6 Genotype and CYP2D6-Mediated Metabolic Activity
- PMID: 31536170
- PMCID: PMC6951848
- DOI: 10.1111/cts.12695
Interrogation of CYP2D6 Structural Variant Alleles Improves the Correlation Between CYP2D6 Genotype and CYP2D6-Mediated Metabolic Activity
Abstract
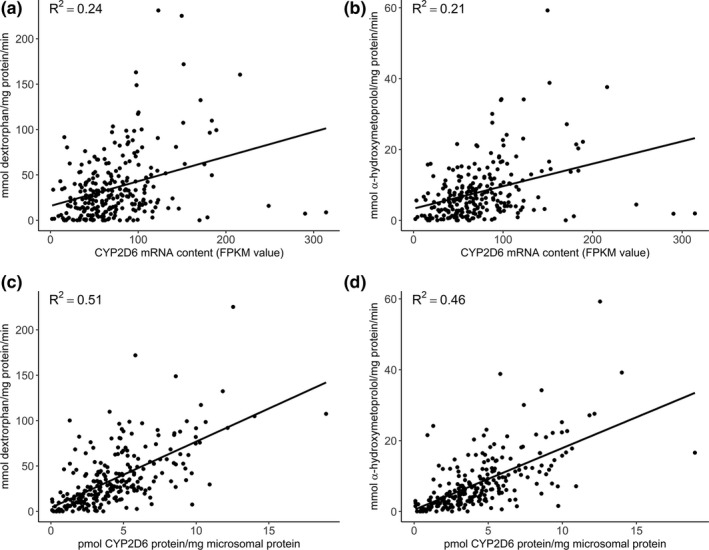
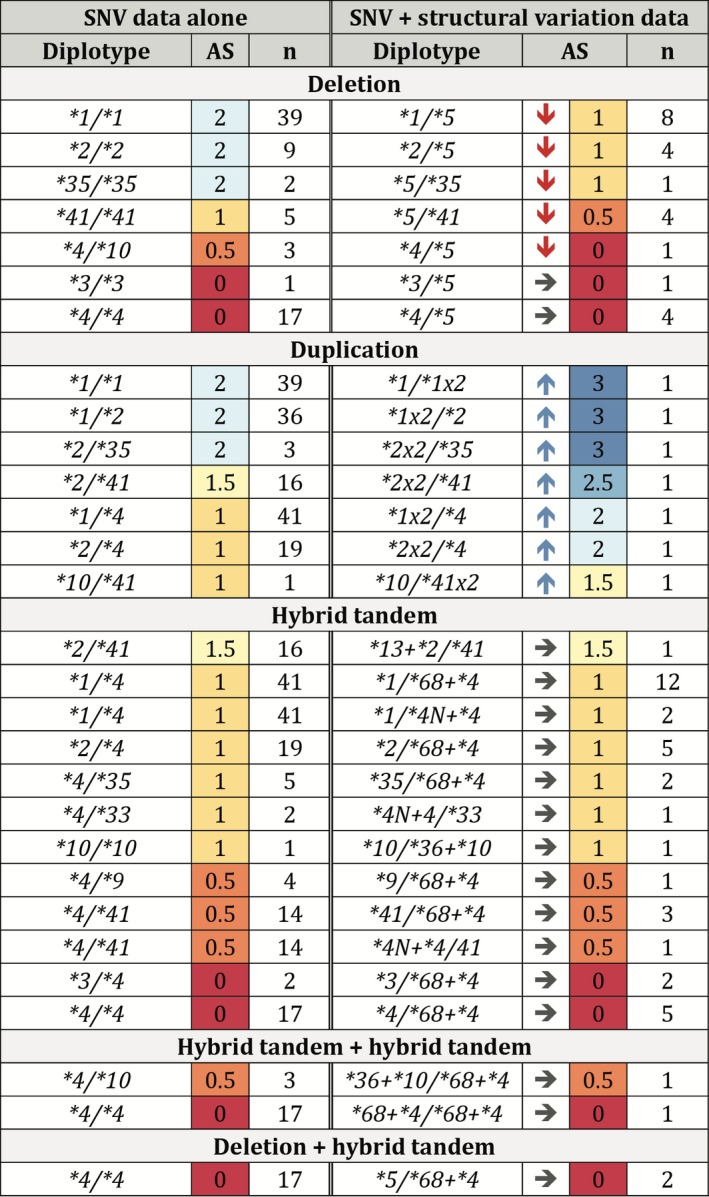
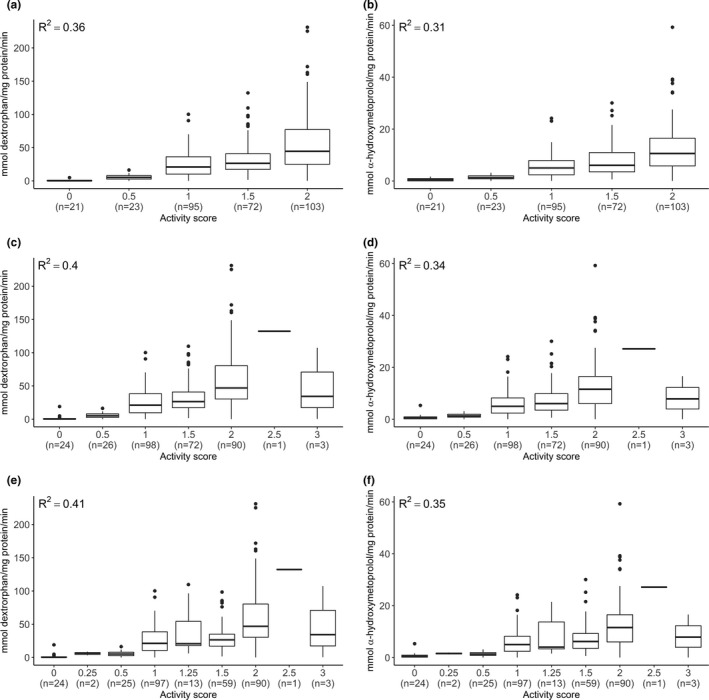
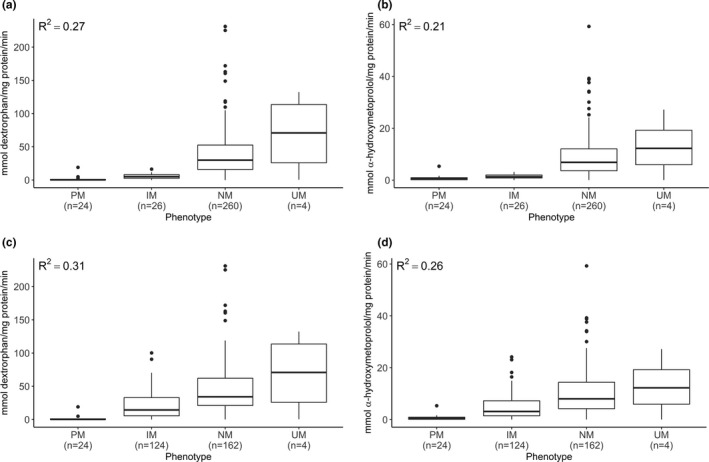
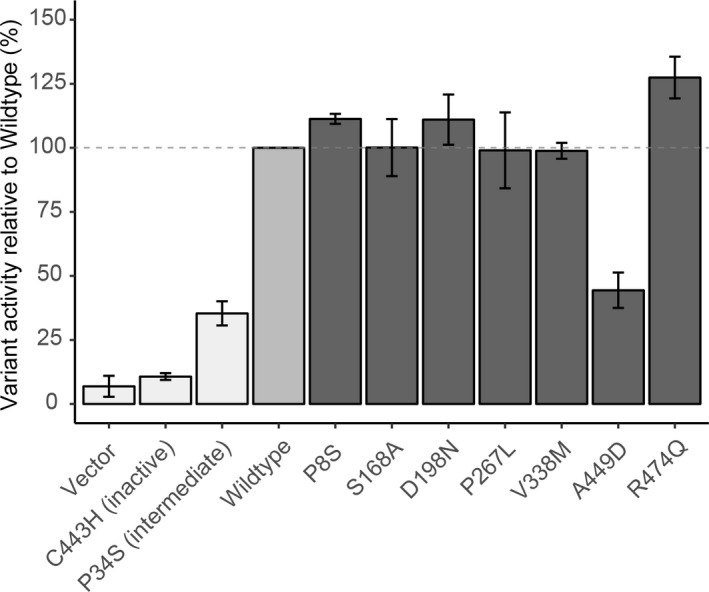
The cytochrome P450 2D6 (CYP2D6) gene locus is challenging to accurately genotype due to numerous single nucleotide variants and complex structural variation. Our goal was to determine whether the CYP2D6 genotype-phenotype correlation is improved when diplotype assignments incorporate structural variation, identified by the bioinformatics tool Stargazer, with next-generation sequencing data. Using CYP2D6 activity measured with substrates dextromethorphan and metoprolol, activity score explained 40% and 34% of variability in metabolite formation rates, respectively, when diplotype calls incorporated structural variation, increasing from 36% and 31%, respectively, when diplotypes did not incorporate structural variation. We also investigated whether the revised Clinical Pharmacogenetics Implementation Consortium (CPIC) recommendations for translating genotype to phenotype improve CYP2D6 activity predictions over the current system. Although the revised recommendations do not improve the correlation between activity score and CYP2D6 activity, perhaps because of low frequency of the CYP2D6*10 allele, the correlation with metabolizer phenotype group was significantly improved for both substrates. We also measured the function of seven rare coding variants: one (A449D) exhibited decreased (44%) and another (R474Q) increased (127%) activity compared with reference CYP2D6.1 protein. Allele-specific analysis found that A449D is part of a novel CYP2D6*4 suballele, CYP2D6*4.028. The novel haplotype containing R474Q was designated CYP2D6*138 by PharmVar; another novel haplotype containing R365H was designated CYP2D6*139. Accuracy of CYP2D6 phenotype prediction is improved when the CYP2D6 gene locus is interrogated using next-generation sequencing coupled with structural variation analysis. Additionally, revised CPIC genotype to phenotype translation recommendations provides an improvement in assigning CYP2D6 activity.
© 2019 The Authors. Clinical and Translational Science published by Wiley Periodicals, Inc. on behalf of the American Society for Clinical Pharmacology and Therapeutics.
Conflict of interest statement
The authors declare no competing interests for this work.
Figures
Similar articles
-
Standardizing CYP2D6 Genotype to Phenotype Translation: Consensus Recommendations from the Clinical Pharmacogenetics Implementation Consortium and Dutch Pharmacogenetics Working Group.Clin Transl Sci. 2020 Jan;13(1):116-124. doi: 10.1111/cts.12692. Epub 2019 Oct 24. Clin Transl Sci. 2020. PMID: 31647186 Free PMC article.
-
Polymorphism of human cytochrome P450 2D6 and its clinical significance: Part I.Clin Pharmacokinet. 2009;48(11):689-723. doi: 10.2165/11318030-000000000-00000. Clin Pharmacokinet. 2009. PMID: 19817501 Review.
-
Pharmacogenetic comparison of CYP2D6 predictive and measured phenotypes in a South African cohort.Pharmacogenomics J. 2016 Nov;16(6):566-572. doi: 10.1038/tpj.2015.76. Epub 2015 Oct 27. Pharmacogenomics J. 2016. PMID: 26503815
-
Sequencing the CYP2D6 gene: from variant allele discovery to clinical pharmacogenetic testing.Pharmacogenomics. 2017 May;18(7):673-685. doi: 10.2217/pgs-2017-0033. Epub 2017 May 4. Pharmacogenomics. 2017. PMID: 28470112 Free PMC article. Review.
-
Determination of novel CYP2D6 haplotype using the targeted sequencing followed by the long-read sequencing and the functional characterization in the Japanese population.J Hum Genet. 2021 Feb;66(2):139-149. doi: 10.1038/s10038-020-0815-x. Epub 2020 Aug 5. J Hum Genet. 2021. PMID: 32759992
Cited by
-
Whole-Exome Sequencing in Patients Affected by Stevens-Johnson Syndrome and Toxic Epidermal Necrolysis Reveals New Variants Potentially Contributing to the Phenotype.Pharmgenomics Pers Med. 2021 Mar 1;14:287-299. doi: 10.2147/PGPM.S289869. eCollection 2021. Pharmgenomics Pers Med. 2021. PMID: 33688237 Free PMC article.
-
Applications of advanced technologies for detecting genomic structural variation.Mutat Res Rev Mutat Res. 2023 Jul-Dec;792:108475. doi: 10.1016/j.mrrev.2023.108475. Epub 2023 Nov 4. Mutat Res Rev Mutat Res. 2023. PMID: 37931775 Free PMC article. Review.
-
The Impact of the CYP2D6 "Enhancer" Single Nucleotide Polymorphism on CYP2D6 Activity.Clin Pharmacol Ther. 2022 Mar;111(3):646-654. doi: 10.1002/cpt.2469. Epub 2021 Nov 30. Clin Pharmacol Ther. 2022. PMID: 34716917 Free PMC article.
-
The genetic landscape of major drug metabolizing cytochrome P450 genes-an updated analysis of population-scale sequencing data.Pharmacogenomics J. 2022 Dec;22(5-6):284-293. doi: 10.1038/s41397-022-00288-2. Epub 2022 Sep 6. Pharmacogenomics J. 2022. PMID: 36068297 Free PMC article.
-
Genomic resources for dissecting the role of non-protein coding variation in gene-environment interactions.Toxicology. 2020 Aug;441:152505. doi: 10.1016/j.tox.2020.152505. Epub 2020 May 22. Toxicology. 2020. PMID: 32450112 Free PMC article. Review.
References
-
- Gardiner, S.J. & Begg, E.J. Pharmacogenetics, drug‐metabolizing enzymes, and clinical practice. Pharmacol. Rev. 58, 521–590 (2006). - PubMed
-
- Lauschke, V.M. & Ingelman‐Sundberg, M. Prediction of drug response and adverse drug reactions: from twin studies to next generation sequencing. Eur. J. Pharm. Sci. 130, 65–77 (2019). - PubMed
-
- Gaedigk, A. Complexities of CYP2D6 gene analysis and interpretation. Int. Rev. Psychiatry 25, 534–553 (2013). - PubMed
-
- Nofziger, C. & Paulmichl, M. Accurately genotyping CYP2D6: not for the faint of heart. Pharmacogenomics 19, 999–1002 (2018). - PubMed
Publication types
MeSH terms
Substances
Grants and funding
LinkOut - more resources
Full Text Sources
