

Multimodal Imaging of Amyloid Plaques: Fusion of the Single-Probe Mass Spectrometry Image and Fluorescence Microscopy Image
- PMID: 31536324
- PMCID: PMC6885010
- DOI: 10.1021/acs.analchem.9b02792
Multimodal Imaging of Amyloid Plaques: Fusion of the Single-Probe Mass Spectrometry Image and Fluorescence Microscopy Image
Abstract
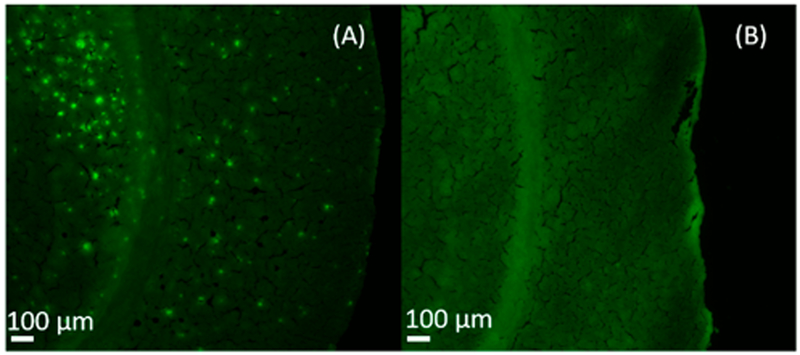
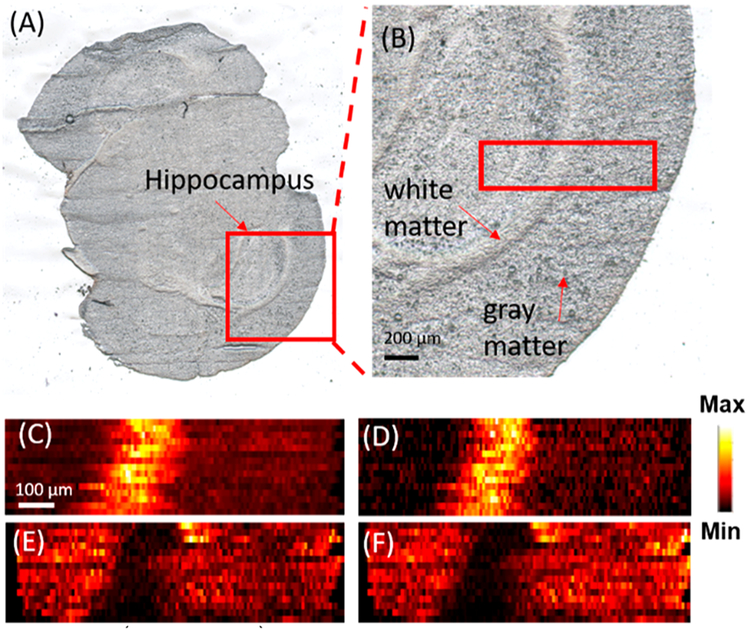
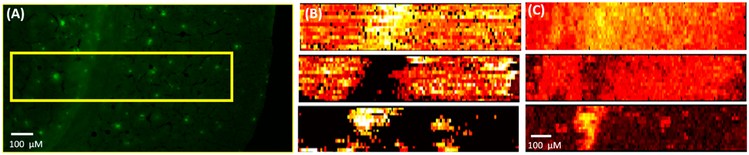
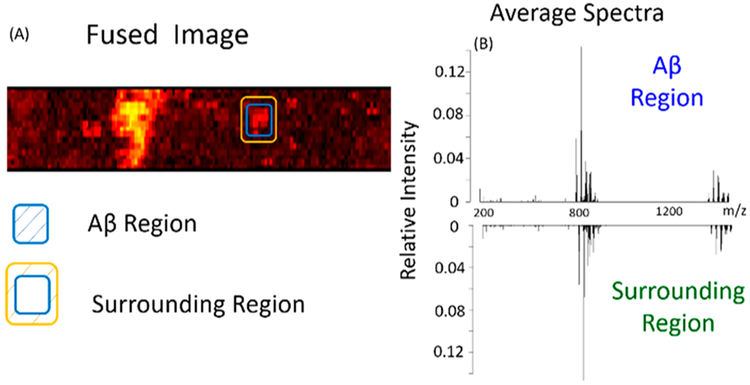
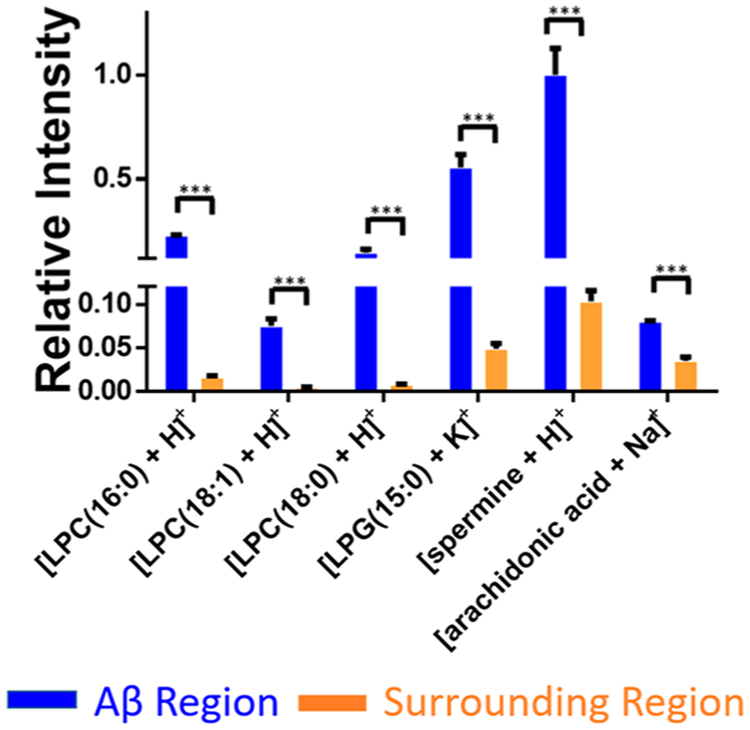
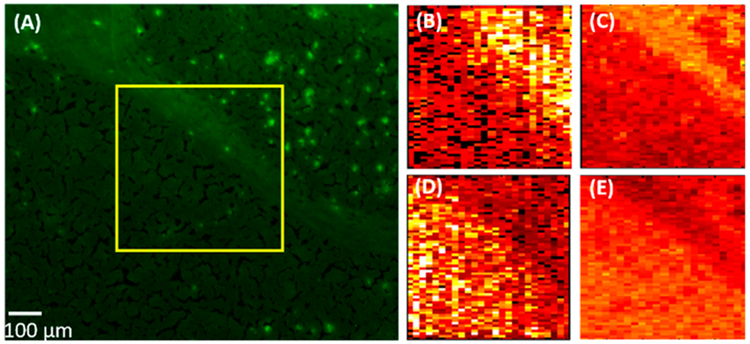
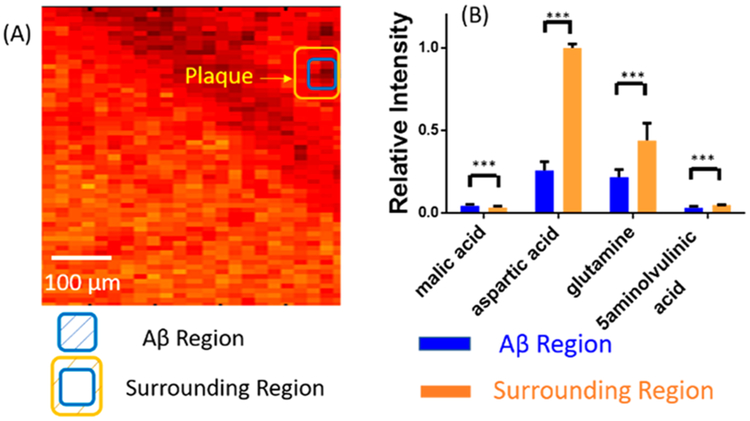
Alzheimer's disease (AD) is one of the most common neurodegenerative diseases. The formation of amyloid plaques by aggregated amyloid beta (Aβ) peptides is a primary event in AD pathology. Understanding the metabolomic features and related pathways is critical for studying plaque-related pathological events (e.g., cell death and neuron dysfunction). Mass spectrometry imaging (MSI), due to its high sensitivity and ability to obtain the spatial distribution of metabolites, has been applied to AD studies. However, limited studies of metabolites in amyloid plaques have been performed due to the drawbacks of the commonly used techniques such as matrix-assisted laser desorption/ionization MSI. In the current study, we obtained high spatial resolution (∼17 μm) MS images of the AD mouse brain using the Single-probe, a microscale sampling and ionization device, coupled to a mass spectrometer under ambient conditions. The adjacent slices were used to obtain fluorescence microscopy images to locate amyloid plaques. The MS image and the fluorescence microscopy image were fused to spatially correlate histological protein hallmarks with metabolomic features. The fused images produced significantly improved spatial resolution (∼5 μm), allowing for the determination of fine structures in MS images and metabolomic biomarkers representing amyloid plaques.
Figures
Similar articles
-
Shedding Light on the Molecular Pathology of Amyloid Plaques in Transgenic Alzheimer's Disease Mice Using Multimodal MALDI Imaging Mass Spectrometry.ACS Chem Neurosci. 2018 Jul 18;9(7):1802-1817. doi: 10.1021/acschemneuro.8b00121. Epub 2018 May 4. ACS Chem Neurosci. 2018. PMID: 29648443
-
Novel Trimodal MALDI Imaging Mass Spectrometry (IMS3) at 10 μm Reveals Spatial Lipid and Peptide Correlates Implicated in Aβ Plaque Pathology in Alzheimer's Disease.ACS Chem Neurosci. 2017 Dec 20;8(12):2778-2790. doi: 10.1021/acschemneuro.7b00314. Epub 2017 Oct 4. ACS Chem Neurosci. 2017. PMID: 28925253
-
Probing amyloid-β pathology in transgenic Alzheimer's disease (tgArcSwe) mice using MALDI imaging mass spectrometry.J Neurochem. 2016 Aug;138(3):469-78. doi: 10.1111/jnc.13645. Epub 2016 May 26. J Neurochem. 2016. PMID: 27115712
-
Aggregation and structure of amyloid β-protein.Neurochem Int. 2021 Dec;151:105208. doi: 10.1016/j.neuint.2021.105208. Epub 2021 Oct 13. Neurochem Int. 2021. PMID: 34655726 Review.
-
Advances in multimodal mass spectrometry for single-cell analysis and imaging enhancement.FEBS Lett. 2024 Mar;598(6):591-601. doi: 10.1002/1873-3468.14798. Epub 2024 Jan 19. FEBS Lett. 2024. PMID: 38243373 Free PMC article. Review.
Cited by
-
Extract Metabolomic Information from Mass Spectrometry Images Using Advanced Data Analysis.Methods Mol Biol. 2022;2437:253-272. doi: 10.1007/978-1-0716-2030-4_18. Methods Mol Biol. 2022. PMID: 34902154
-
MassLite: An integrated python platform for single cell mass spectrometry metabolomics data pretreatment with graphical user interface and advanced peak alignment method.Anal Chim Acta. 2024 Oct 9;1325:343124. doi: 10.1016/j.aca.2024.343124. Epub 2024 Aug 20. Anal Chim Acta. 2024. PMID: 39244309
-
Single cell mass spectrometry studies reveal metabolomic features and potential mechanisms of drug-resistant cancer cell lines.Anal Chim Acta. 2022 May 8;1206:339761. doi: 10.1016/j.aca.2022.339761. Epub 2022 Apr 1. Anal Chim Acta. 2022. PMID: 35473873 Free PMC article.
-
Mass Spectrometry Imaging for Spatial Chemical Profiling of Vegetative Parts of Plants.Plants (Basel). 2022 May 2;11(9):1234. doi: 10.3390/plants11091234. Plants (Basel). 2022. PMID: 35567235 Free PMC article. Review.
-
Correlative Chemical Imaging and Spatial Chemometrics Delineate Alzheimer Plaque Heterogeneity at High Spatial Resolution.JACS Au. 2023 Mar 7;3(3):762-774. doi: 10.1021/jacsau.2c00492. eCollection 2023 Mar 27. JACS Au. 2023. PMID: 37006756 Free PMC article.
References
-
- Kumar A; Singh A; Ekavali. Pharmacol. Rep 2015, 67 (2), 195–203. - PubMed
-
- Takahashi RH; Nagao T; Gouras GK Pathol. Int 2017, 67 (4), 185–193. - PubMed
-
- Pike CJ; Walencewicz AJ; Glabe CG; Cotman CW Brain Res. 1991, 563 (1), 311–314. - PubMed
-
- Takeda A; Aliev G; Atwood CS; Perry G; Smith MA; Petersen RB; Nunomura A; Balraj EK; Hirai K; Jones PK; Chiba S; Ghanbari H; Wataya T; Shimohama S J. Neuropathol. Exp. Neurol 2001, 60 (8), 759–767. - PubMed
Publication types
MeSH terms
Substances
Grants and funding
LinkOut - more resources
Full Text Sources
