

Precipitation and Salmonellosis Incidence in Georgia, USA: Interactions between Extreme Rainfall Events and Antecedent Rainfall Conditions
- PMID: 31536392
- PMCID: PMC6792369
- DOI: 10.1289/EHP4621
Precipitation and Salmonellosis Incidence in Georgia, USA: Interactions between Extreme Rainfall Events and Antecedent Rainfall Conditions
Abstract
Background: The southeastern United States consistently has high salmonellosis incidence, but disease drivers remain unknown. Salmonella is regularly detected in this region's natural environment, leading to numerous exposure opportunities. Rainfall patterns may impact the survival/transport of environmental Salmonella in ways that can affect disease transmission.
Objectives: This study investigated associations between short-term precipitation (extreme rainfall events) and longer-term precipitation (rainfall conditions antecedent to these extreme events) on salmonellosis counts in the state of Georgia in the United States.
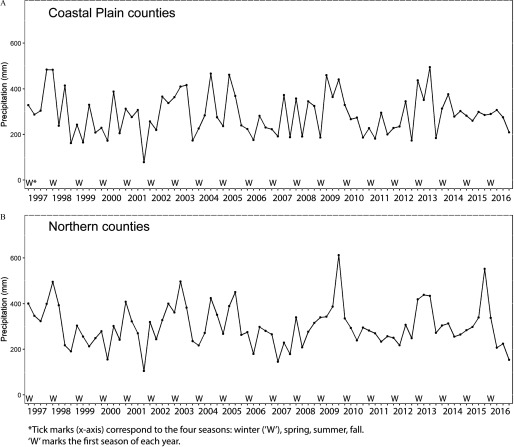
Methods: For the period 1997-2016, negative binomial models estimated associations between weekly county-level extreme rainfall events ( percentile of daily rainfall) and antecedent conditions (8-week precipitation sums, categorized into tertiles) and weekly county-level salmonellosis counts.
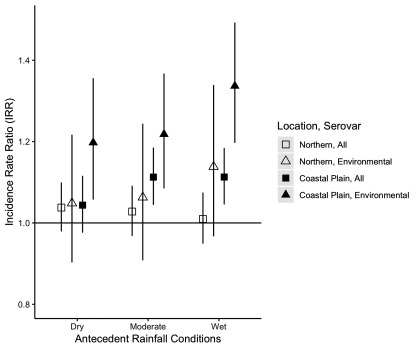
Results: In Georgia's Coastal Plain counties, extreme and antecedent rainfall were associated with significant differences in salmonellosis counts. In these counties, extreme rainfall was associated with a 5% increase in salmonellosis risk (95% CI: 1%, 10%) compared with weeks with no extreme rainfall. Antecedent dry periods were associated with a 9% risk decrease (95% CI: 5%, 12%), whereas wet periods were associated with a 5% increase (95% CI: 1%, 9%), compared with periods of moderate rainfall. In models considering the interaction between extreme and antecedent rainfall conditions, wet periods were associated with a 13% risk increase (95% CI: 6%, 19%), whereas wet periods followed by extreme events were associated with an 11% increase (95% CI: 5%, 18%). Associations were substantially magnified when analyses were restricted to cases attributed to serovars commonly isolated from wildlife/environment (e.g., Javiana). For example, wet periods followed by extreme rainfall were associated with a 34% risk increase (95% CI: 20%, 49%) in environmental serovar infection.
Conclusions: Given the associations of short-term extreme rainfall events and longer-term rainfall conditions on salmonellosis incidence, our findings suggest that avoiding contact with environmental reservoirs of Salmonella following heavy rainfall events, especially during the rainy season, may reduce the risk of salmonellosis. https://doi.org/10.1289/EHP4621.
Figures

References
-
- Antaki EM, Vellidis G, Harris C, Aminabadi P, Levy K, Jay-Russell MT. 2016. Low concentration of Salmonella enterica and generic Escherichia coli in farm ponds and irrigation distribution systems used for mixed produce production in southern Georgia. Foodborne Pathog Dis 13(10):551–558, PMID: 27400147, 10.1089/fpd.2016.2117. - DOI - PMC - PubMed
-
- Berghaus RD, Thayer SG, Law BF, Mild RM, Hofacre CL, Singer RS. 2013. Enumeration of Salmonella and Campylobacter spp. in environmental farm samples and processing plant carcass rinses from commercial broiler chicken flocks. Appl Environ Microbiol 79(13):4106–4114, PMID: 23624481, 10.1128/AEM.00836-13. - DOI - PMC - PubMed
-
- Blaschke AP, Derx J, Zessner M, Kirnbauer R, Kavka G, Strelec H, et al. . 2016. Setback distances between small biological wastewater treatment systems and drinking water wells against virus contamination in alluvial aquifers. Sci Total Environ 573:278–289, PMID: 27570196, 10.1016/j.scitotenv.2016.08.075. - DOI - PubMed
Publication types
MeSH terms
Grants and funding
LinkOut - more resources
Full Text Sources
Medical
