An official website of the United States government
The .gov means it’s official.
Federal government websites often end in .gov or .mil. Before
sharing sensitive information, make sure you’re on a federal
government site.
The site is secure.
The https:// ensures that you are connecting to the
official website and that any information you provide is encrypted
and transmitted securely.
1 Division of Rheumatology, Immunology, and Allergy.
2 Department of Surgery.
3 Center for Data Sciences, and.
4 Division of Rheumatology and Genetics, Department of Medicine, Brigham and Women's Hospital, Boston, Massachusetts, USA.
5 Department of Biomedical Informatics, Harvard Medical School, Boston, Massachusetts, USA.
6 Broad Institute of Massachusetts Institute and Technology and Harvard University, Cambridge, Massachusetts, USA.
7 Oncology & Immunology Discovery, and.
8 Genetics and Pharmacogenomics, Merck & Co. Inc., Boston, Massachusetts, USA.
9 Division of Rheumatology, Johns Hopkins University, Baltimore, Maryland, USA.
10 Division of Rheumatology, New York University School of Medicine, New York, New York, USA.
11 Department of Microbiology & Immunology and Division of Rheumatology, Albert Einstein College of Medicine, Bronx, New York, USA.
12 Rheumatology Division and Russell/Engleman Research Center, UCSF, San Francisco, California, USA.
13 Department of Arthritis and Clinical Immunology, Oklahoma Medical Research Foundation, Oklahoma City, Oklahoma, USA.
14 Center for Autoimmune, Musculoskeletal and Hematopoietic Diseases, The Feinstein Institute for Medical Research, Northwell Health, Manhasset, New York, USA.
15 Department of Medicine, Division of Allergy, Immunology, and Rheumatology, University of Rochester Medical Center, Rochester, New York, USA.
16 Division of Immunology, Boston Children's Hospital, Boston, Massachusetts, USA.
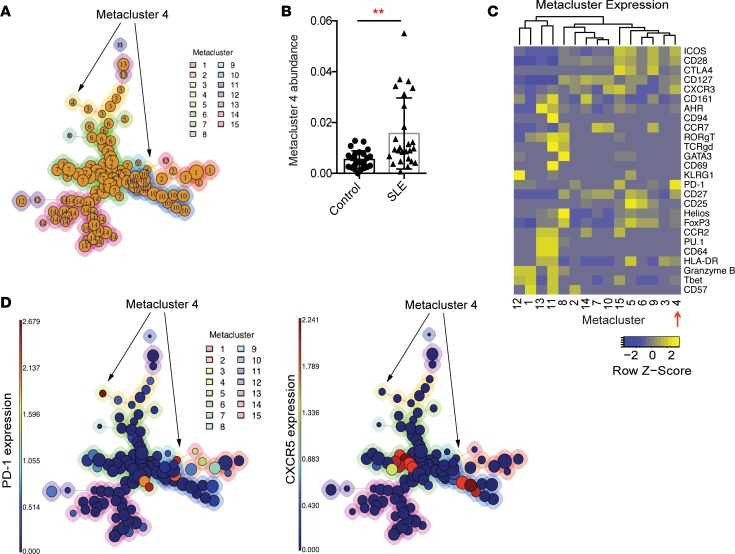
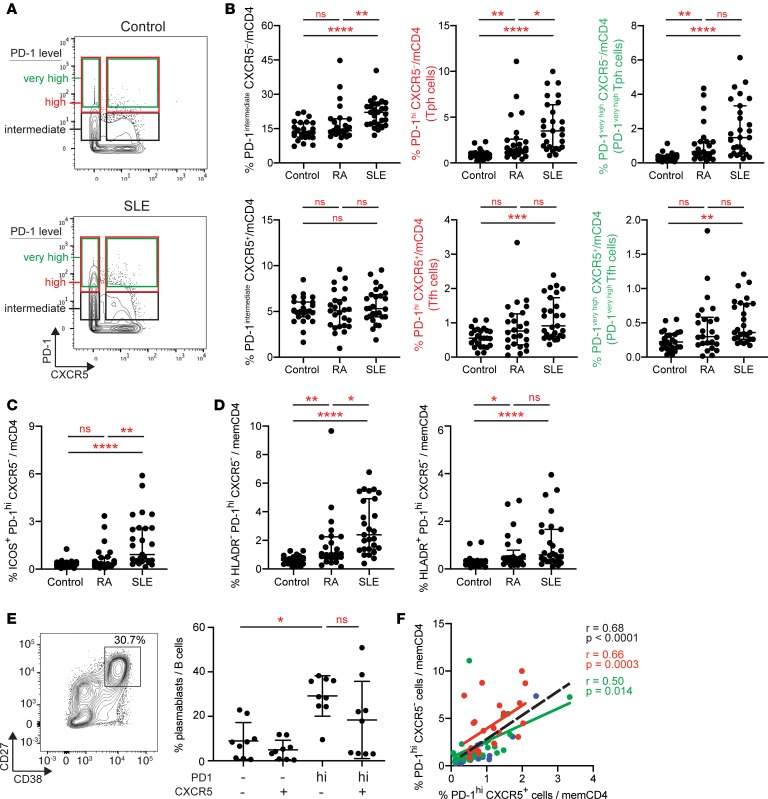
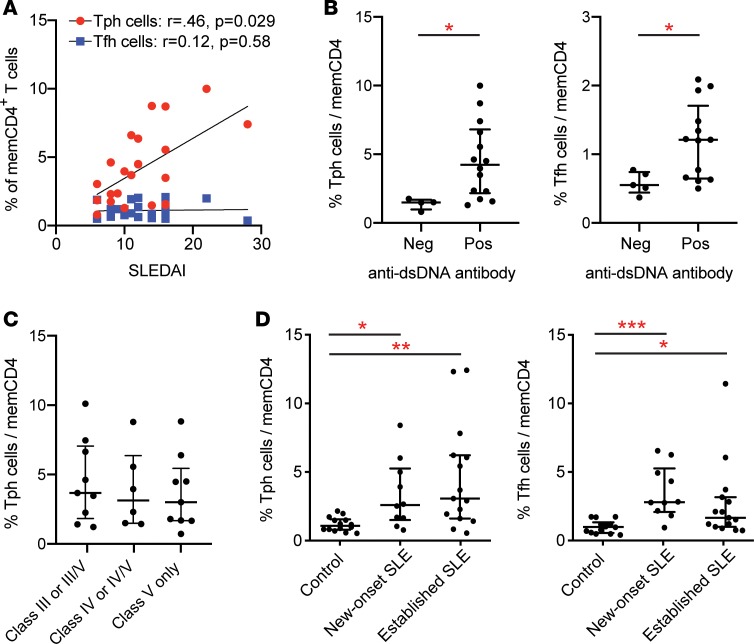
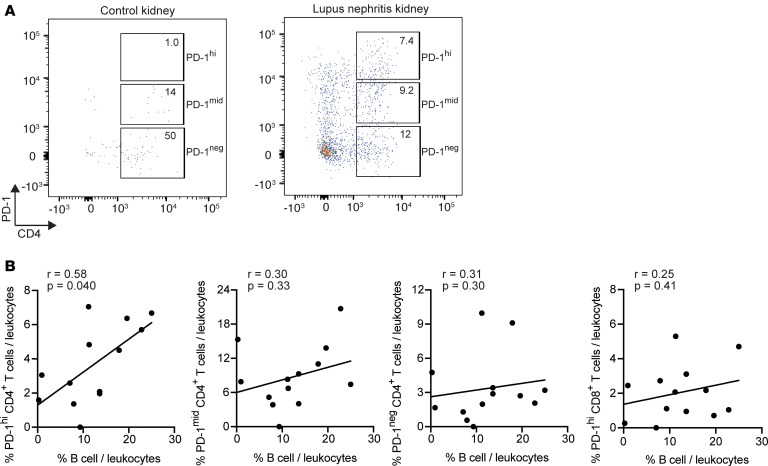
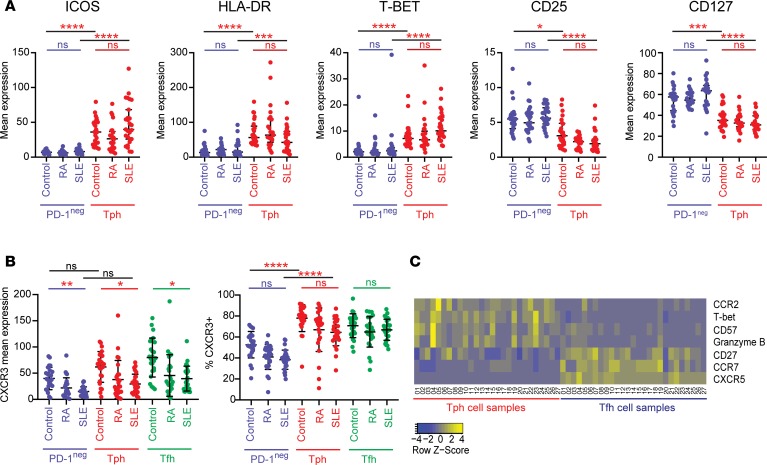
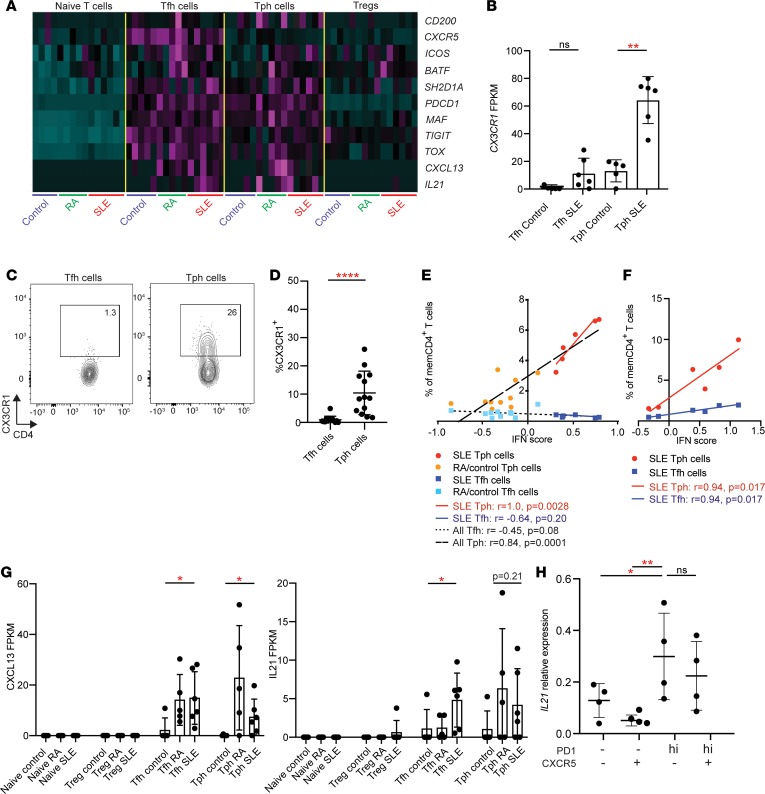
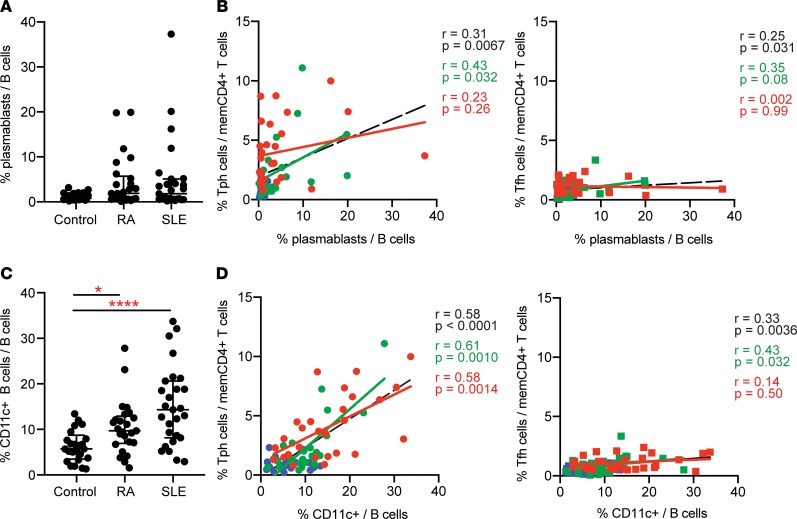
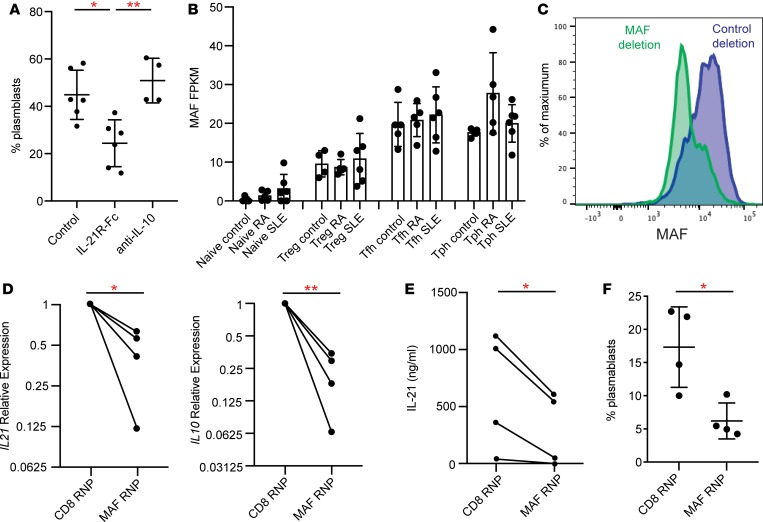
Systemic lupus erythematosus (SLE) is an autoimmune disease characterized by pathologic T cell-B cell interactions and autoantibody production. Defining the T cell populations that drive B cell responses in SLE may enable design of therapies that specifically target pathologic cell subsets. Here, we evaluated the phenotypes of CD4+ T cells in the circulation of 52 SLE patients drawn from multiple cohorts and identified a highly expanded PD-1hiCXCR5-CD4+ T cell population. Cytometric, transcriptomic, and functional assays demonstrated that PD-1hiCXCR5-CD4+ T cells from SLE patients are T peripheral helper (Tph) cells, a CXCR5- T cell population that stimulates B cell responses via IL-21. The frequency of Tph cells, but not T follicular helper (Tfh) cells, correlated with both clinical disease activity and the frequency of CD11c+ B cells in SLE patients. PD-1hiCD4+ T cells were found within lupus nephritis kidneys and correlated with B cell numbers in the kidney. Both IL-21 neutralization and CRISPR-mediated deletion of MAF abrogated the ability of Tph cells to induce memory B cell differentiation into plasmablasts in vitro. These findings identify Tph cells as a highly expanded T cell population in SLE and suggest a key role for Tph cells in stimulating pathologic B cell responses.
Keywords:
Adaptive immunity; Autoimmunity; Immunology; Lupus; T cells.
Conflict of interest: DAR and MBB are coinventors on patent WO2017213695A1 submitted on Tph cells. SA, EM, YQ, and GW are employees of Merck & Co. Inc. KZ was an employee of Merck & Co. Inc., and MM was an employee of Merck Sharp & Dohme Corp., a subsidiary of Merck & Co. Inc., during participation in this manuscript.
Figures
Figure 1. Identification of an expanded CD4 …
Figure 1. Identification of an expanded CD4 + T cell population in the blood of…
Figure 1. Identification of an expanded CD4+ T cell population in the blood of SLE patients.
(A) FlowSOM analysis of AMP mass cytometry data gated on CD45RO+CD4+ T cells. Each circle represents an individual cluster. The aggregated metaclusters are indicated by the numbers within the circles and by the color around the circles. Circle size indicates the abundance of cells within the cluster. (B) Abundance of metacluster 4 in individual SLE patients (n = 26) and controls (n = 25). Error bars show mean ± SD. **P < 0.01 by Mann-Whitney U test. (C) Heatmap of row-normalized expression of mass cytometry markers in each metacluster. Markers with nonzero median expression in at least 1 metacluster are shown, excluding markers used for gating memory CD4+ T cells. (D) FlowSOM maps demonstrating level of expression of PD-1 and CXCR5 in the individual clusters. For A and D, arrows indicate location of metacluster 4.
Figure 2. Expanded PD-1 hi CXCR5 – …
Figure 2. Expanded PD-1 hi CXCR5 – Tph cells in the blood of SLE patients.
( A )…
Figure 2. Expanded PD-1hiCXCR5– Tph cells in the blood of SLE patients.
(A) Example of gating of memory CD4+ T cells with different levels of PD-1 expression in AMP mass cytometry data. (B) Quantification of CXCR5– and CXCR5+ memory CD4+ T cell populations with intermediate, high, or very high PD-1 expression as depicted in A in controls (n = 25), RA (n = 25), and SLE (n = 27) patients using AMP mass cytometry data. (C) Quantification of PD-1hiCXCR5–ICOS+ memory CD4+ T cells in AMP mass cytometry data as in B. (D) Quantification of PD-1hiCXCR5– cells that express or do not express HLA-DR as in B. (E) Example flow cytometry detection of plasmablasts in T cell–B cell cocultures and quantification of plasmablasts among B cells in cocultures of memory B cells with indicated CD4+ T cell subsets from SLE patients. Pooled data from 9 donors. Error bars show median ± interquartile range (B, C, D) or mean ± SD (E). *P < 0.05, **P < 0.01, ***P < 0.001, ****P < 0.0001 by Kruskal–Wallis with Dunn’s multiple comparisons test (B–E). (F) Correlation between PD-1hiCXCR5– and PD-1hiCXCR5+ cell frequencies in AMP mass cytometry data (red, SLE patients; green, RA patients; blue, controls; black line, all patients). Spearman correlation statistics shown.
Figure 3. Clinical features of Tph cell…
Figure 3. Clinical features of Tph cell expansion in SLE patients.
( A ) Correlation…
Figure 3. Clinical features of Tph cell expansion in SLE patients.
(A) Correlation between Tph cell (red) or Tfh cell (blue) frequency and disease activity by SELENA-SLEDAI in AMP lupus nephritis patients (n = 21). Spearman correlation statistics shown. (B) Frequency of Tph cells or Tfh cells in AMP lupus nephritis patients dichotomized based on anti-dsDNA antibody status. (C) Frequency of Tph cells in AMP lupus nephritis patients grouped according to histologic glomerulonephritis class. (D) Tph cell and Tfh cell frequencies in control (n = 10), new-onset SLE (n = 10), and established SLE (n = 15) patients in the BWH validation cohort. Error bars show median ± interquartile range (B–D). *P < 0.05, **P < 0.01, ***P < 0.001 by Mann-Whitney U test (B) and Kruskal–Wallis with Dunn’s multiple comparisons test (C and D).
Figure 4. Potential Tph cells in lupus…
Figure 4. Potential Tph cells in lupus nephritis kidneys.
( A ) Example of flow…
Figure 4. Potential Tph cells in lupus nephritis kidneys.
(A) Example of flow cytometry analysis of gated CD45+ leukocytes from control kidney tissue (left) or lupus nephritis kidney biopsy (right). (B) Correlation between the frequency of B cells and PD-1hi, PD-1intermediate, PD-1–CD4+ T cells or PD-1hiCD8+ T cells in lupus nephritis kidney biopsies (n = 13). Spearman correlation statistics shown.
Figure 5. Cytometric features of Tph cells…
Figure 5. Cytometric features of Tph cells in SLE.
( A ) Expression of characteristic…
Figure 5. Cytometric features of Tph cells in SLE.
(A) Expression of characteristic proteins on Tph cells (red) and PD-1– memory CD4+ T cells (blue) in controls (n = 25), RA (n = 25), and lupus nephritis (SLE; n = 27) patients in the AMP cohort. (B) Mean expression of CXCR3 and frequency of CXCR3+ cells in PD-1– memory CD4+ T cells, Tph cells, and Tfh cells. *P < 0.05, **P < 0.01, ***P < 0.001, ****P < 0.0001 by Kruskal–Wallis with Dunn’s multiple comparisons test (A and B). Black bars indicate comparison of PD-1– and Tph cells either from controls or from SLE patients as indicated. Colored bars indicate comparison of control and SLE samples within the cell type. Error bars show mean ± SD. (C) Heatmap of row-normalized expression of 6 markers that are significantly differentially expressed comparing Tph cells and Tfh cells from lupus nephritis patients in the AMP cohort. CXCR5 is included for reference.
Figure 6. RNA-seq features of Tph cells…
Figure 6. RNA-seq features of Tph cells in SLE.
( A ) Heatmap of row-normalized…
Figure 6. RNA-seq features of Tph cells in SLE.
(A) Heatmap of row-normalized expression of Tfh-associated genes in T cell populations sorted from control, RA, and SLE patients. (B) Expression of CX3CR1 in RNA-seq data in Tfh and Tph cells from control and SLE patients. (C) Example flow cytometric detection of CX3CR1 in Tph cells and Tfh cells. (D) Quantification of CX3CR1 expression on Tph cells and Tfh cells in SLE patients in the AMP cohort. (E) Correlation between Tph or Tfh cell frequency and IFN score in the RNA-seq patient cohort (SLE, n = 6; RA, n = 5, control, n = 5). Black lines indicate overall Tph or Tfh correlations. Red line indicates correlation for SLE Tph cells. Blue line indicates correlation for SLE Tfh cells. (F) Correlation between Tph or Tfh cell frequency and IFN score in a subset of SLE patients from AMP cohort (n = 6). (G) Expression of CXCL13 and IL21 in T cell subsets in RNA-seq data. (H) IL21 expression by qPCR in PMA plus ionomycin–stimulated memory CD4+ T cell subsets from SLE patients (n = 4). Error bars show mean ± SD (B, G, and H) or median ± interquartile range (D). *P < 0.05, **P < 0.01, ****P < 0.0001 by Kruskal–Wallis with Dunn’s multiple comparisons test (B, D, and G), Mann-Whitney U test of Tph and Tfh control vs. SLE (G), and Spearman correlation statistics (E and F).
Figure 7. Tph cells correlate with CD11c …
Figure 7. Tph cells correlate with CD11c + B cells and plasmablasts in SLE.
( A …
Figure 7. Tph cells correlate with CD11c+ B cells and plasmablasts in SLE.
(A) Frequency of plasmablasts among B cells of controls (n = 25), RA (n = 25), and lupus nephritis (SLE; n = 27) patients in AMP mass cytometry dataset. (B) Correlation between the frequency of Tph cells or Tfh cells and plasmablasts in the AMP cohort (red, SLE patients; green, RA patients; blue, controls; black line, all patients). (C) Frequency of CD11c+ B cells as in A. (D) Correlation between Tph cells or Tfh cells and CD11c+ B cells as in B. Error bars show median ± interquartile range, with *P < 0.05, ****P < 0.0001 by Kruskal–Wallis with Dunn’s multiple comparisons test (A and C). Spearman correlation statistics shown in B and D.
Figure 8. Tph cells induce B cell…
Figure 8. Tph cells induce B cell responses in an IL-21– and MAF-dependent manner.
( …
Figure 8. Tph cells induce B cell responses in an IL-21– and MAF-dependent manner.
(A) Quantification of plasmablasts among B cells in cocultures of memory B cells from controls cocultured with Tph cells from SLE patients with neutralization of either IL-21 or IL-10 (n = 3 donors for IL-21R-Fc, n = 2 donors for anti–IL-10, 2 replicates per donor). (B) Expression of MAF in RNA-seq data in indicated T cell populations. (C) Flow cytometric detection of loss of MAF expression in CRISPR/Cas9-treated CD4+ cells. (D) Expression of IL21 and IL10 by qPCR in CD4+ T cells after treatment with MAF- or CD8-targeting Cas9 complexes. Values plotted were normalized to CD8 targeting control. (E) Expression of IL-21 by ELISA in CD4+ T cells after treatment with MAF- or CD8-targeting Cas9 complexes. (F) Plasmablast generation in cocultures of Tph cells treated with MAF- or CD8-targeting complexes cocultured with allogeneic memory B cells. Data pooled from 2 experiments with 2 different donors. Error bars show mean ± SD (A, B, and F). *P < 0.05, **P < 0.01. Paired t test statistics of normalized data in D and E. Unpaired t test statistics shown in F.
Kavanaugh AF, Solomon DH, American College of Rheumatology Ad Hoc Committee on Immunologic Testing Guidelines Guidelines for immunologic laboratory testing in the rheumatic diseases: anti-DNA antibody tests. Arthritis Rheum. 2002;47(5):546–555. doi: 10.1002/art.10558.
-
DOI
-
PubMed
Arce E, Jackson DG, Gill MA, Bennett LB, Banchereau J, Pascual V. Increased frequency of pre-germinal center B cells and plasma cell precursors in the blood of children with systemic lupus erythematosus. J Immunol. 2001;167(4):2361–2369. doi: 10.4049/jimmunol.167.4.2361.
-
DOI
-
PubMed
Jacobi AM, et al. Correlation between circulating CD27high plasma cells and disease activity in patients with systemic lupus erythematosus. Arthritis Rheum. 2003;48(5):1332–1342. doi: 10.1002/art.10949.
-
DOI
-
PubMed
Wang S, et al. IL-21 drives expansion and plasma cell differentiation of autoreactive CD11chiT-bet+ B cells in SLE. Nat Commun. 2018;9(1):1758. doi: 10.1038/s41467-018-03750-7.
-
DOI
-
PMC
-
PubMed
Naradikian MS, Hao Y, Cancro MP. Age-associated B cells: key mediators of both protective and autoreactive humoral responses. Immunol Rev. 2016;269(1):118–129. doi: 10.1111/imr.12380.
-
DOI
-
PubMed