. 2019 Sep 19;15(9):e1008009.
doi: 10.1371/journal.ppat.1008009. eCollection 2019 Sep.

A robust human norovirus replication model in zebrafish larvae

Affiliations

A robust human norovirus replication model in zebrafish larvae

Jana Van Dycke et al. PLoS Pathog. .

Abstract

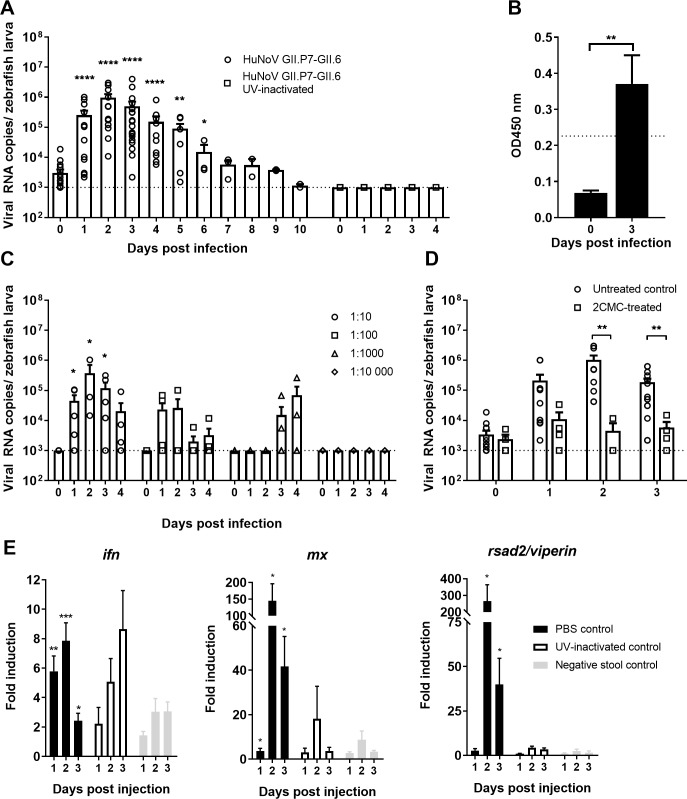
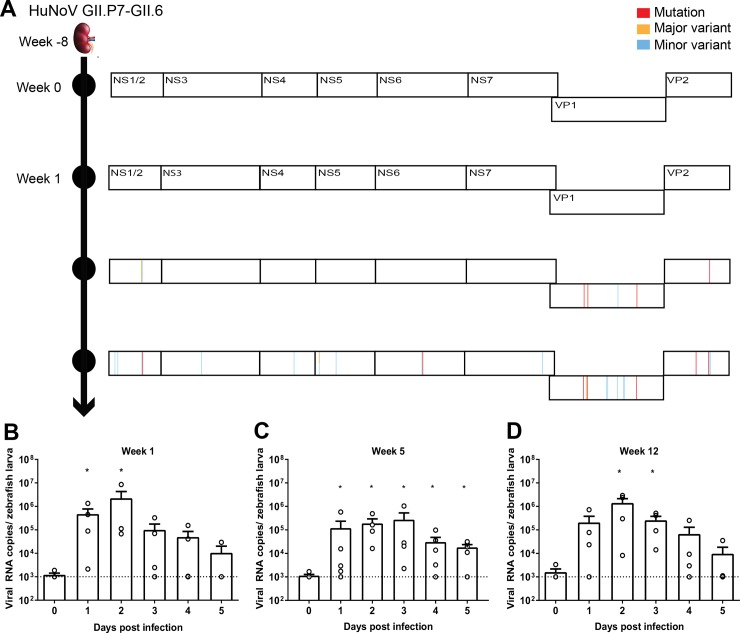
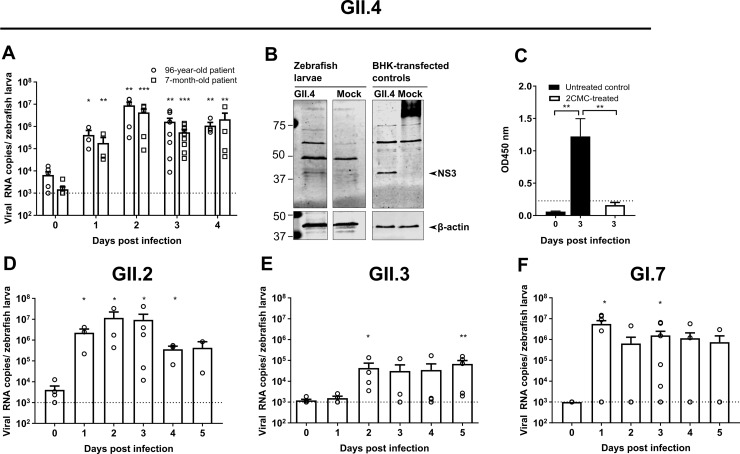
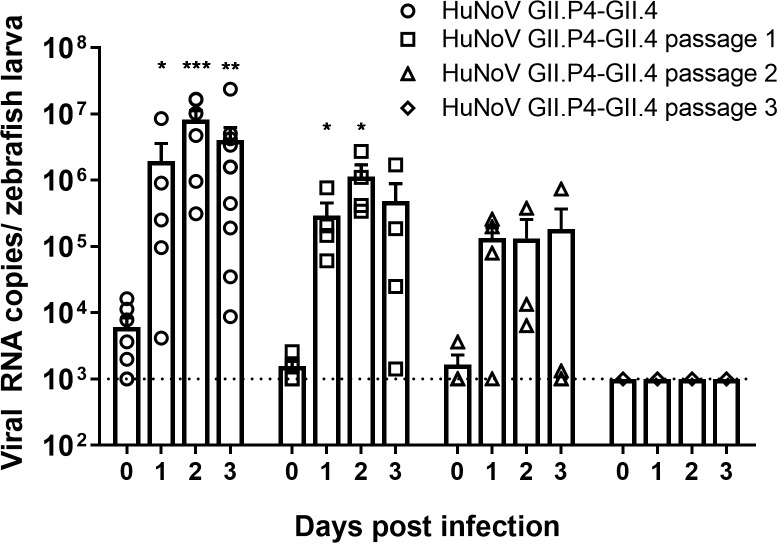
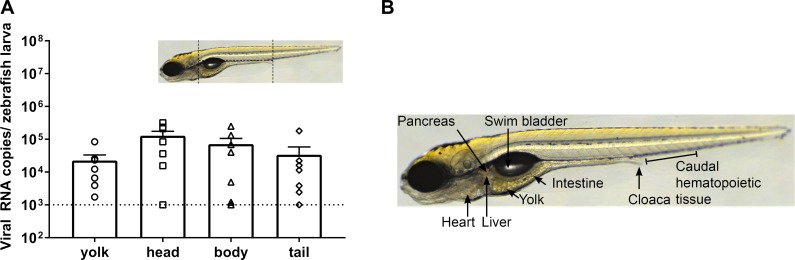
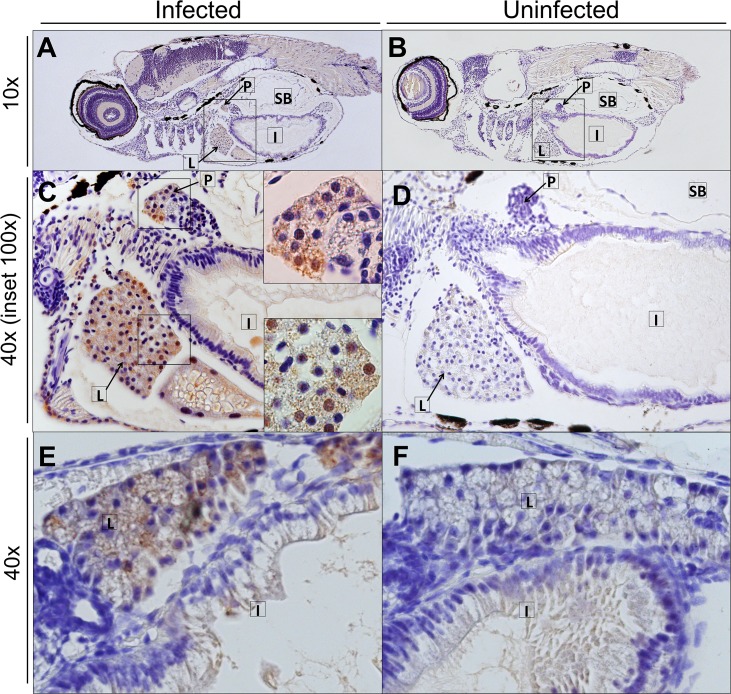
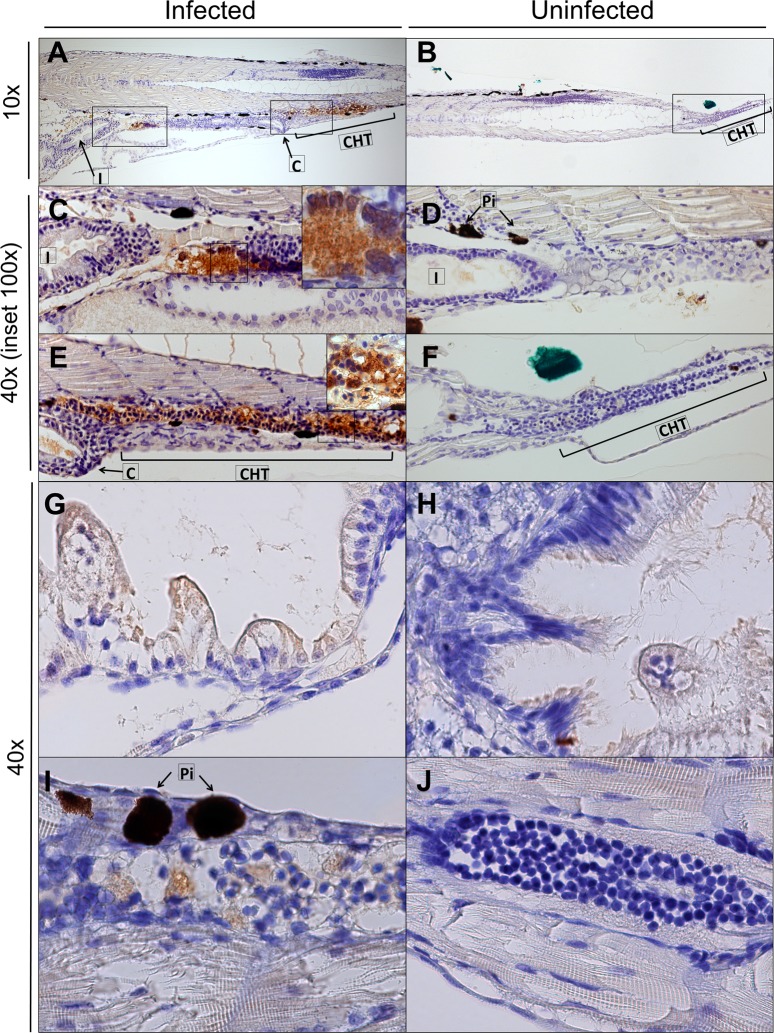
Human noroviruses (HuNoVs) are the most common cause of foodborne illness, with a societal cost of $60 billion and 219,000 deaths/year. The lack of robust small animal models has significantly hindered the understanding of norovirus biology and the development of effective therapeutics. Here we report that HuNoV GI and GII replicate to high titers in zebrafish (Danio rerio) larvae; replication peaks at day 2 post infection and is detectable for at least 6 days. The virus (HuNoV GII.4) could be passaged from larva to larva two consecutive times. HuNoV is detected in cells of the hematopoietic lineage and the intestine, supporting the notion of a dual tropism. Antiviral treatment reduces HuNoV replication by >2 log10, showing that this model is suited for antiviral studies. Zebrafish larvae constitute a simple and robust replication model that will largely facilitate studies of HuNoV biology and the development of antiviral strategies.


Conflict of interest statement

The authors have declared that no competing interests exist.

Figures

Fig 1
Fig 1. HuNoV GII.P7-GII.6 replicates in zebrafish larvae.
(A) Injection of zebrafish larvae with HuNoV GII.P7-GII.6 (22 independent experiments) or UV-inactivated virus (2 independent experiments). Bars represent viral RNA levels/zebrafish larva, quantified by RT-qPCR. The dotted line represents the limit of detection (LOD). Viral RNA levels in larvae injected with the UV-inactivated sample was set at the LOD (undetected by RT-qPCR). (B) Viral antigens quantified by ELISA in HuNoV GII.P7-GII.6-injected larvae. Bars represent OD values/10 larvae. The dotted line is the calculated cutoff+10%, above which samples are considered positive. (C) Zebrafish larvae injected with serial dilutions of HuNoV GII.P7-GII.6 (5 independent experiments). Bars represent viral RNA levels/zebrafish larva, quantified by RT-qPCR. The dotted line represents the LOD. (D) HuNoV GII.P7-GII.6-injected larvae treated with 4 mM of 2’-C-methylcytidine via immersion in Danieau’s solution (4 independent experiments). Bars represent the viral RNA levels/zebrafish larva, quantified by RT-qPCR. (E) The effect of HuNoV GII.P7-GII.6 replication on the expression of ifn, mx, and rsad2/viperin, determined by RT-qPCR. Bars represent the fold-induction in HuNoV-injected larvae, compared to zebrafish larvae injected with PBS (black bars), UV-inactivated HuNoV GII.P7-GII.6 (empty bars) or a stool sample negative for the presence of HuNoV (grey bars) and normalized to the housekeeping genes (4–9 independent experiments). For all graphs: in every independent experiment 10 zebrafish larvae were harvested at each time point, mean values ± SEM are presented, Mann-Whitney test, where ****p<0.0001, ***p<0.001, **p<0.01, *p<0.05.
Fig 2
Fig 2. Characterization of the HuNoV GII.P7-GII.6 sample and clinical history of the patient.
(A) A 2.5-year-old patient that had received a kidney transplant and presented 8 weeks later with acute viral diarrhea caused by HuNoV GII.P7-GII.6. The infection lasted for ~7 months along which multiple stool samples were collected; four of these samples were characterized (week 0, week 1, week 5 and week 12). The immunosuppressive therapy consisted of tacrolimus and mycophenolate. The complete HuNoV genomes were determined by deep sequencing using the NextSeq500 platform (Illumina) and whole genome sequence analysis was performed in comparison to week 0. Mutations, major and minor variants (respectively, ≥80%, 50–80% and 10–49% of the reads had a different nucleotide) are depicted for the HuNoV strains present in samples from week 1, 5 and 12 pi. (B-D) Zebrafish larvae injected with HuNoV GII.P7-GII.6 of week 1, 5 or 12 (4–5 independent experiments). The calculated inocula (3 nL per zebrafish larvae) were (B) 2.2 x 10⁴ (C) 2.5 x 10³ and (D) 4.4 x 10⁴ viral RNA copies. Bars represent viral RNA levels/zebrafish larva, quantified by RT-qPCR. The dotted line represents the LOD. For all graphs: in every independent experiment 10 zebrafish larvae were harvested at each time point, mean values ± SEM are presented, Mann-Whitney test, where *p<0.05.
Fig 3
Fig 3. Injection of zebrafish larvae with HuNoV GI and GII of other genotypes.
(A) Zebrafish larvae injected with GII.P4 New Orleans-GII.4 Sydney, from a 96-year-old patient and a 7-month-old patient [6 independent experiments]. Bars represent viral RNA levels/zebrafish larva, quantified by RT-qPCR. The dotted line represents the limit of detection (LOD). (B) The viral NS3 protein detected in HuNoV GII.4-injected larvae by western blot analysis, BHK cells transfected with a GII.4 construct were used as positive control. (C) Structural antigens were detected by EIA [here 2CMC-treated HuNoV GII.4-injected zebrafish were also included]. Bars represent OD values/10 larvae. The dotted line is the calculated cutoff +10%, above which samples are considered positive. (D) Zebrafish larvae injected with HuNoV GII.P16-GII.2 (from an 87-year-old patient) [5 independent experiments]. Bars represent the viral RNA levels/zebrafish larva, quantified by RT-qPCR. (E) Zebrafish larvae injected with GII.P16-GII.3 (from a 3.5-year-old patient) [5 independent experiments]. Bars represent the viral RNA levels/zebrafish larva, quantified by RT-qPCR. (F) Zebrafish larvae injected with HuNoV GI.P7-GI.7 (from a 52-year-old patient) [7 independent experiments]. Bars represent the viral RNA levels/zebrafish larva, quantified by RT-qPCR. The dotted line represents the LOD. In all graphs: in every independent experiment 10 larvae were harvested at each time point, mean values ± SEM are presented, Mann-Whitney test, where ***p<0.001, **p<0.01, *p<0.05.
Fig 4
Fig 4. Serial passaging of HuNoV GII.P4-GII.4 in zebrafish larvae.
Bars represent viral RNA levels/larva after serial passaging of HuNoV GII.P4 New Orleans-GII.4 Sydney, quantified by RT-qPCR [5 independent experiments]. The dotted line represents the limit of detection (LOD). In every independent experiment 10 larvae were harvested at each time point, mean values ± SEM are presented, Mann-Whitney test, where ***p<0.001, **p<0.01, *p<0.05.
Fig 5
Fig 5. HuNoV sites of replication.
(A) Ten HuNoV-injected larvae were deyolked and then dissected into head, body, and tail (as depicted in the scheme) at 3 days pi. Bars represent the viral RNA levels/zebrafish larva, quantified by RT-qPCR (7 independent experiments). (B) Anatomy of a 6 dpf zebrafish larva.
Fig 6
Fig 6. HuNoV detected in the liver and pancreas of infected zebrafish larvae at 3 days pi.
Immunohistochemistry of HuNoV GII.P7-GII.6-infected zebrafish larvae (A, C, E) harvested at day 3 pi [and the respective uninfected controls (B, D, F)] was performed. Images show 5 μm sections stained with antibodies targeting VP1 at 10x and 40x magnifications, insets at 100x magnification of sagittal sections (A-D) and coronal sections (E-F). Viral antigens were detected in the liver (A, C, D, E) and pancreas (A, C). L: liver, P: pancreas, SB: swim bladder, I: intestine.
Fig 7
Fig 7. HuNoV detected in the intestine and caudal hematopoietic tissue of infected zebrafish larvae at 3 days pi.
Immunohistochemistry of HuNoV GII.P7-GII.6-infected zebrafish larvae (A, C, E, G, I) harvested at day 3 pi [and the respective uninfected controls (B, D, F, H, J)] was performed. Images show 5 μm sections stained with antibodies targeting VP1 at 10x and 40x magnifications, insets at 100x magnification of sagittal sections (A-F) and coronal sections (G-J). Viral antigens were detected in the intestine (A, C, G) and caudal hematopoietic tissue (A, E, I). L: liver, C: cloaca, SB: swim bladder, I: intestine, Pi: pigment, CHT: caudal hematopoietic tissue.

References

    1. Bartsch SM, Lopman BA, Ozawa S, Hall AJ, Lee BY. Global Economic Burden of Norovirus Gastroenteritis. PloS one. 2016;11(4):e0151219 Epub 2016/04/27. 10.1371/journal.pone.0151219 - DOI - PMC - PubMed
    1. Hemming M, Rasanen S, Huhti L, Paloniemi M, Salminen M, Vesikari T. Major reduction of rotavirus, but not norovirus, gastroenteritis in children seen in hospital after the introduction of RotaTeq vaccine into the National Immunization Programme in Finland. European journal of pediatrics. 2013;172(6):739–46. Epub 2013/01/31. 10.1007/s00431-013-1945-3 . - DOI - PMC - PubMed
    1. Bok K, Parra GI, Mitra T, Abente E, Shaver CK, Boon D, et al. Chimpanzees as an animal model for human norovirus infection and vaccine development. Proc Natl Acad Sci U S A. 2011;108(1):325–30. 10.1073/pnas.1014577107 - DOI - PMC - PubMed
    1. Cheetham S, Souza M, Meulia T, Grimes S, Han MG, Saif LJ. Pathogenesis of a genogroup II human norovirus in gnotobiotic pigs. J Virol. 2006;80(21):10372–81. 10.1128/JVI.00809-06 - DOI - PMC - PubMed
    1. Souza M, Azevedo MS, Jung K, Cheetham S, Saif LJ. Pathogenesis and immune responses in gnotobiotic calves after infection with the genogroup II.4-HS66 strain of human norovirus. J Virol. 2008;82(4):1777–86. 10.1128/JVI.01347-07 - DOI - PMC - PubMed

Publication types

Substances

LinkOut - more resources