. 2019 Oct;29(10):1578-1590.
doi: 10.1101/gr.248922.119. Epub 2019 Sep 19.

LTR retroelement expansion of the human cancer transcriptome and immunopeptidome revealed by de novo transcript assembly

Affiliations

LTR retroelement expansion of the human cancer transcriptome and immunopeptidome revealed by de novo transcript assembly

Jan Attig et al. Genome Res. 2019 Oct.

Abstract

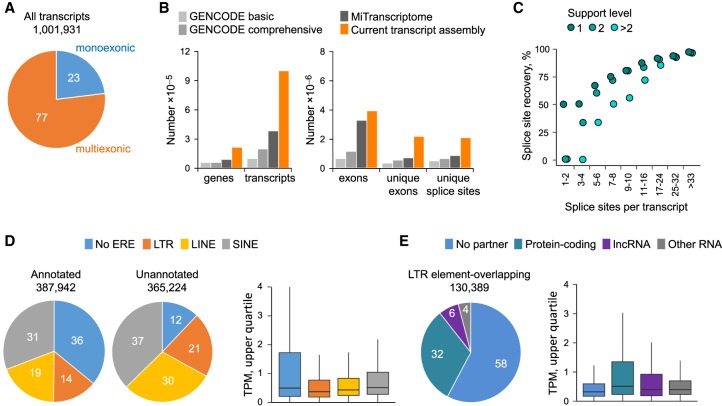
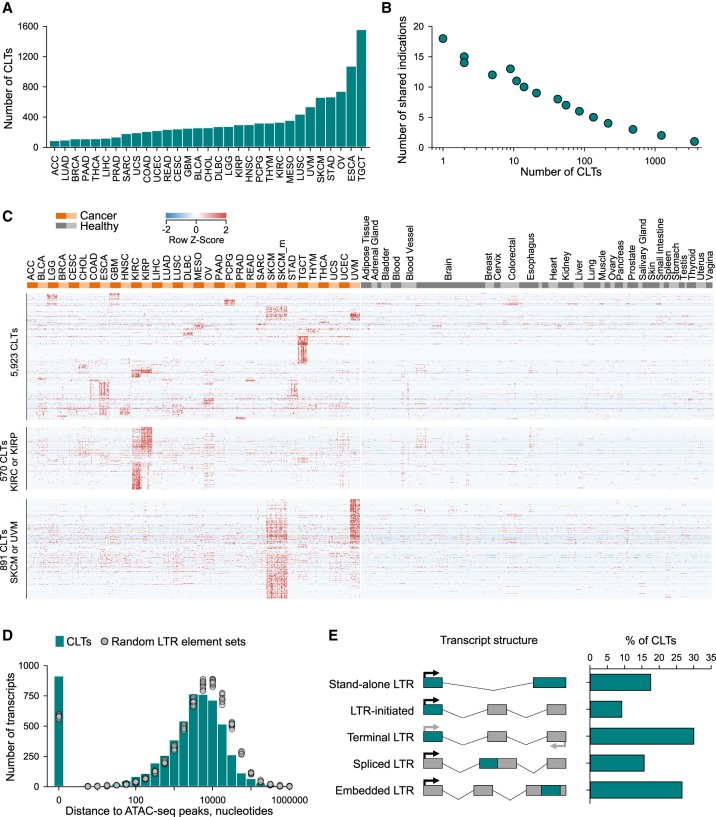
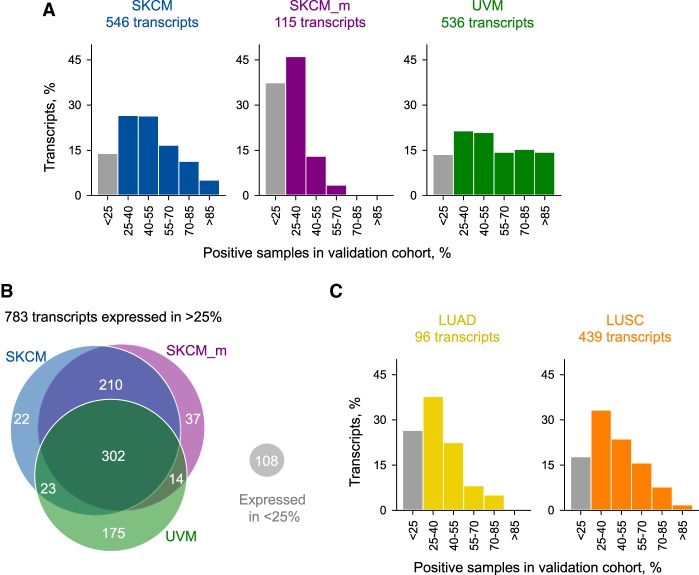
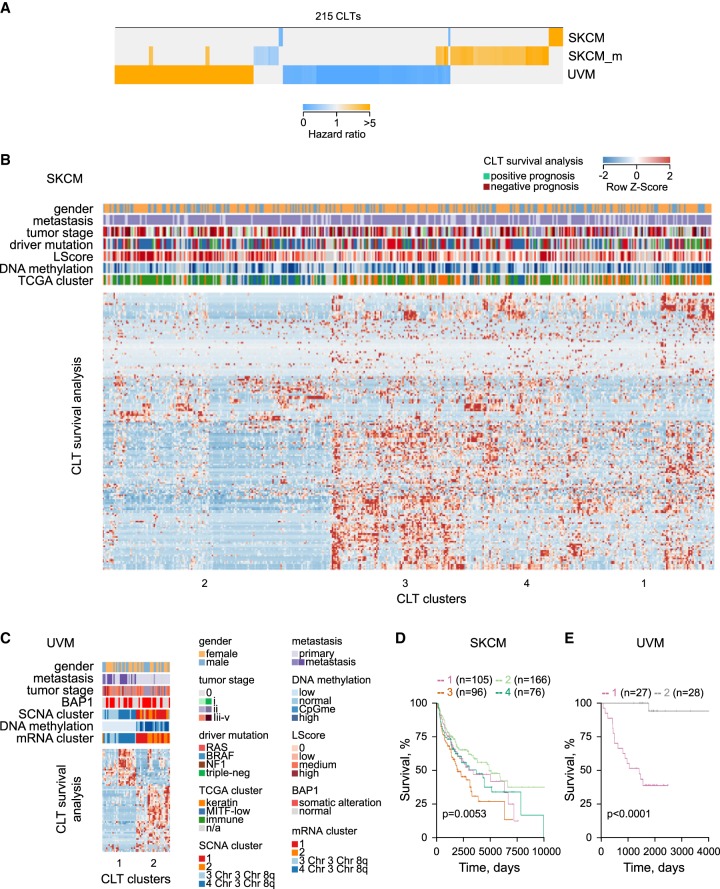
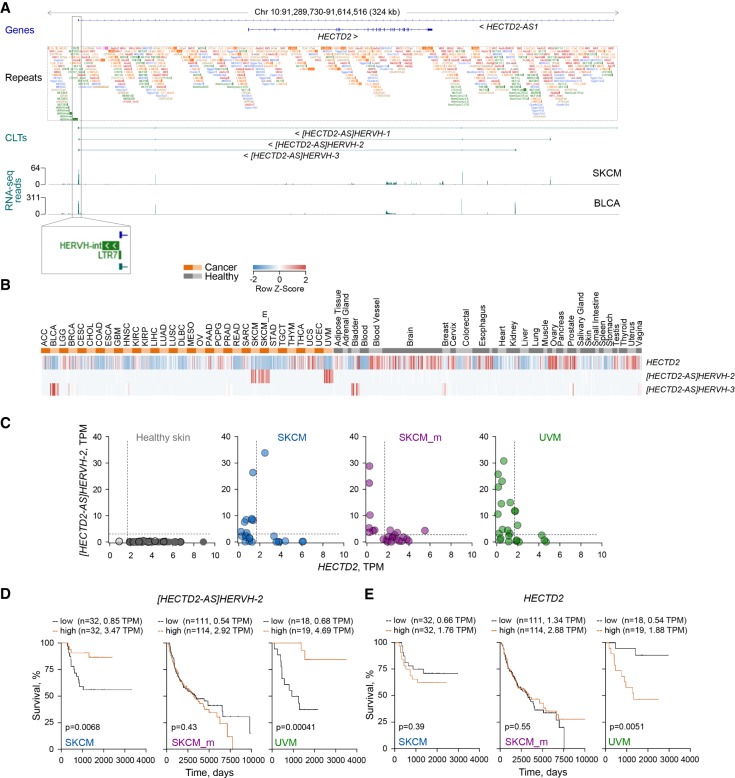
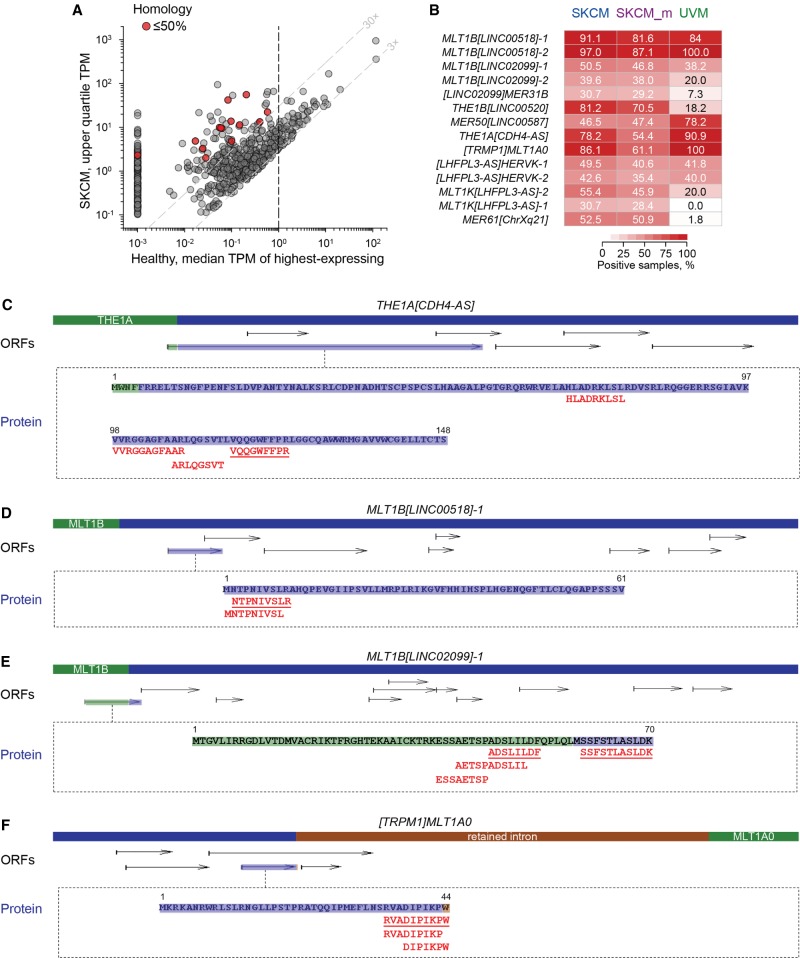
Dysregulated endogenous retroelements (EREs) are increasingly implicated in the initiation, progression, and immune surveillance of human cancer. However, incomplete knowledge of ERE activity limits mechanistic studies. By using pan-cancer de novo transcript assembly, we uncover the extent and complexity of ERE transcription. The current assembly doubled the number of previously annotated transcripts overlapping with long-terminal repeat (LTR) elements, several thousand of which were expressed specifically in one or a few related cancer types. Exemplified in melanoma, LTR-overlapping transcripts were highly predictable, disease prognostic, and closely linked with molecularly defined subtypes. They further showed the potential to affect disease-relevant genes, as well as produce novel cancer-specific antigenic peptides. This extended view of LTR elements provides the framework for functional validation of affected genes and targets for cancer immunotherapy.


Figures

Figure 1.
Figure 1.
Assembly, recovery, and expression of ERE-overlapping transcripts in tumors of diverse origins. (A) Total number and proportion of monoexonic or multiexonic de novo–assembled transcripts. (B) Comparison of the total number of genes, transcripts, exons, unique exons, and unique splice sites in the current transcript assembly with GENCODE (version 24) (Frankish et al. 2019) and MiTranscriptome (Iyer et al. 2015). Genes are defined here as nonoverlapping transcribed regions. (C) Completeness of the current transcript assembly, estimated by median recovery of splice sites annotated in GENCODE. The percentage of GENCODE recovered sites is plotted according to their support levels. Recovery of the 367,411 unique splice sites of high-confidence GENCODE transcripts was ∼93%. (D) Prior annotation status and ERE composition of the 753,166 transcripts out of the entire assembly that were expressed at one or more transcripts per million (TPM) in at least one sample (left) and expression levels of these transcripts according to their ERE composition (right). Transcripts were considered as previously annotated if all exons were present within GENCODE (v24 basic) and as ERE-overlapping if any exon overlapped with an ERE integration. For transcripts overlapping with multiple EREs, we assigned a hierarchical LTR, LINE, or SINE order. As overall expression level, we used the upper quartile TPM in the cancer type with highest expression for each transcript. (E) Breakdown of LTR element–overlapping transcripts (expressed at one or more TPM in at least one sample) according to overlap with protein-coding, lncRNA, or other RNA genes (left) and expression levels (upper quartile TPM in the cancer type with highest expression) or each type of LTR element–overlapping transcript (right).
Figure 2.
Figure 2.
Abundance of cancer-specific LTR element–overlapping transcripts. (A) Total number of CLTs identified per cancer type. (B) Overlap of CLT expression between cancer types, plotted as the number of CLTs against the number of cancer types sharing a given CLT. (C) Heatmap of expression values in cancer patient and healthy control samples of all 5923 identified CLTs (top), KIRC-specific and KIRP-specific CLTs (570) (middle), and SKCM-specific and UVM-specific CLTs (891) (bottom). (D) Proximity, in nucleotides, of the identified CLT TSS to ATAC-seq peaks. Also shown is the proximity of ATAC-seq peaks to the center of 10 random sets of similar numbers of LTR elements. (E) Composition of identified CLTs according to the indicated position of the LTR element in the transcript structure.
Figure 3.
Figure 3.
Validation of CLT expression prevalence. (A) Percentage of CLTs expressed in each bin of percentage of positive samples in larger cohorts of primary SKCM (n = 77), metastatic SKCM (SKCM_m; n = 318), or UVM (n = 31). (B) Number and overlap between melanoma types of CLTs that were validated in the larger cohorts, that is, expressed in >25% of cancer patient samples in the validation cohort. (C) Percentage of CLTs expressed in each bin of percentage of positive samples in larger cohorts of LUAD (n = 395) or LUSC (n = 338). Samples were considered positive if transcript expression level was more than three times that of the highest median in any normal tissue.
Figure 4.
Figure 4.
Potential biological processes underlying melanoma association of melanoma-expressed CLTs. (A) Heatmap of hazard ratios, calculated by Cox regression model, of the 215 melanoma-expressed CLTs that were significantly associated with survival probability for each melanoma type of patients in the higher versus the lower expression tertiles. (B,C) Unsupervised clustering of 180 SKCM-prognostic CLTs (B) and 67 UVM-prognostic CLTs (C), according to their expression values (x-axis) and effect on survival probability (y-axis). Also annotated are TCGA-defined clinical and molecular subtypes: (LScore) lymphocyte infiltration score (The Cancer Genome Atlas Network 2015; Robertson et al. 2017). (D,E) Kaplan–Meier plots and P-values from Cox multi-regression model for patients stratified according to the four CLT clusters identified in SKCM (D) and the CLT two clusters identified in UVM (E).
Figure 5.
Figure 5.
Down-regulation of HECTD2 expression by melanoma-specific antisense transcription of the [HECTD2-AS]HERVH-2 CLT. (A) GENCODE annotated transcripts at the indicated genomic location (genes), repeat content (repeats), CLTs and other selected transcripts at the same location in the current assembly (CLTs), and RNA-seq traces of representative SKCM and BCLA samples. (B) Heatmap of expression values in cancer patient and healthy control samples of HECTD2 and the two indicated antisense transcripts. (C) Anticorrelation of HECTD2 and [HECTD2-AS]HERVH-2 expression (TPM values). Each symbol is an individual patient or healthy control sample. (D,E) Kaplan-Meier plots and P-values from log-rank tests for melanoma patients stratified according to the higher versus the lower expression tertiles for [HECTD2-AS]HERVH-2 (D) and HECTD2 (E). The number of cases and the expression thresholds are also indicated in brackets.
Figure 6.
Figure 6.
Potential antigenicity of SKCM-specific CLTs. (A) Properties of selected CLTs (red circles) with unique protein-coding potential. Plotted is the expression level of SKCM CLTs with a predicted ORF ≥300 nt, in SKCM (upper quartile TPM) against the median TPM of the highest-expressing healthy tissue. Although the cut-off for CLT selection was ≤85% homology over the entire ORF length with any other ORF potentially expressed in healthy tissues, the final selected CLTs displayed 0%–50% homology. (B) Prevalence of expression of the indicted CLTs with unique protein-coding potential among primary SKCM (n = 101), metastatic SKCM (SKCM_m; n = 342), or UVM (n = 55) patients. Values are the percentages of patient that express each CLT at 0.5 or more TPM. (CF) CLT structure, all predicted ORFs >75 nt (ORFs), where the ORF with evidence for translation is highlighted, and amino acid sequence of the latter ORF. Also shown is the sequence of MHC-eluted peptides uniquely mapping to each CLT product. Underlined peptides were confirmed by comparison with synthetic peptides.

References

    1. Attig J, Young GR, Stoye JP, Kassiotis G. 2017. Physiological and pathological transcriptional activation of endogenous retroelements assessed by RNA-sequencing of B lymphocytes. Front Microbiol 8: 2489 10.3389/fmicb.2017.02489 - DOI - PMC - PubMed
    1. Babaian A, Mager DL. 2016. Endogenous retroviral promoter exaptation in human cancer. Mob DNA 7: 24 10.1186/s13100-016-0080-x - DOI - PMC - PubMed
    1. Bassani-Sternberg M, Bräunlein E, Klar R, Engleitner T, Sinitcyn P, Audehm S, Straub M, Weber J, Slotta-Huspenina J, Specht K, et al. 2016. Direct identification of clinically relevant neoepitopes presented on native human melanoma tissue by mass spectrometry. Nat Commun 7: 13404 10.1038/ncomms13404 - DOI - PMC - PubMed
    1. Baylin SB, Jones PA. 2011. A decade of exploring the cancer epigenome: biological and translational implications. Nat Rev Cancer 11: 726–734. 10.1038/nrc3130 - DOI - PMC - PubMed
    1. Burns KH, Boeke JD. 2012. Human transposon tectonics. Cell 149: 740–752. 10.1016/j.cell.2012.04.019 - DOI - PMC - PubMed

Publication types