. 2019 Dec 2;216(12):2800-2818.
doi: 10.1084/jem.20190678. Epub 2019 Sep 19.

Concomitant PIK3CD and TNFRSF9 deficiencies cause chronic active Epstein-Barr virus infection of T cells

Affiliations

Concomitant PIK3CD and TNFRSF9 deficiencies cause chronic active Epstein-Barr virus infection of T cells

Rémy Rodriguez et al. J Exp Med. .

Abstract

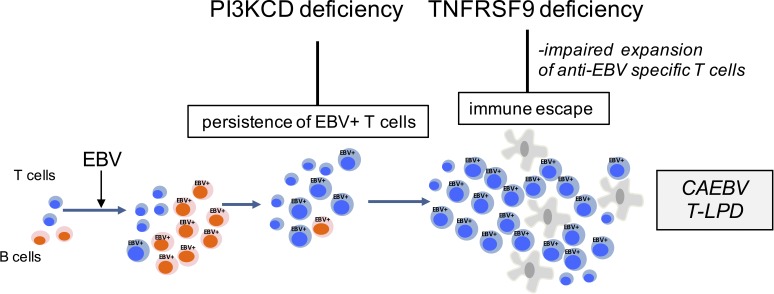
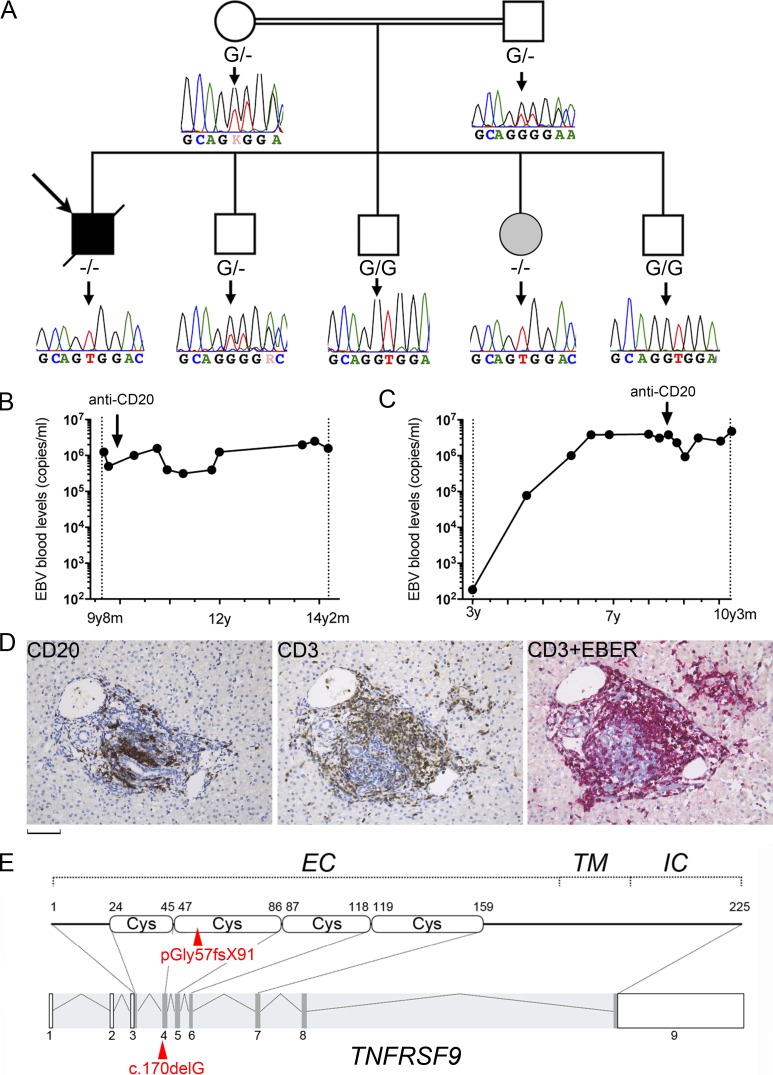
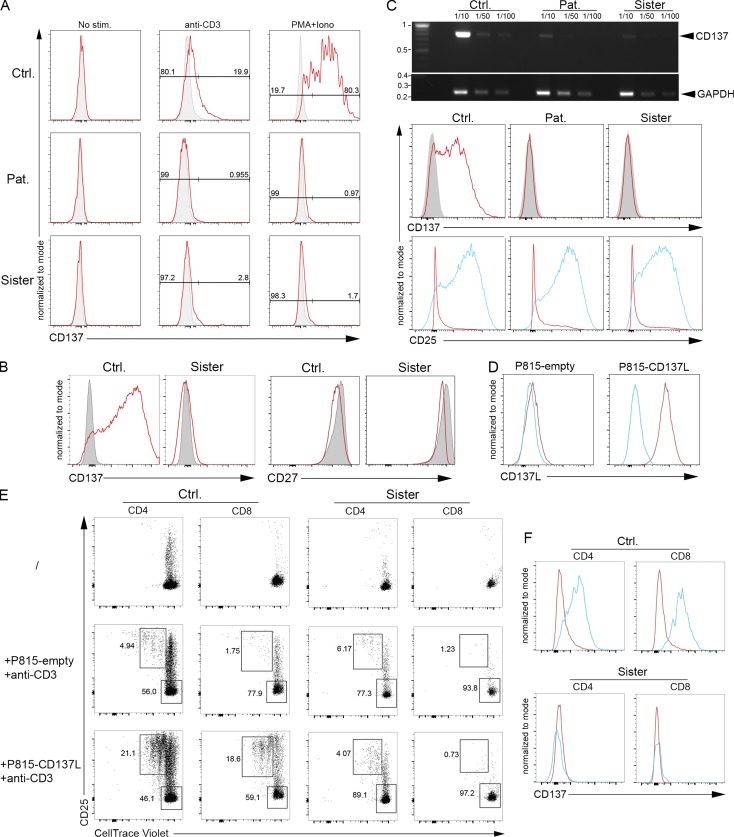
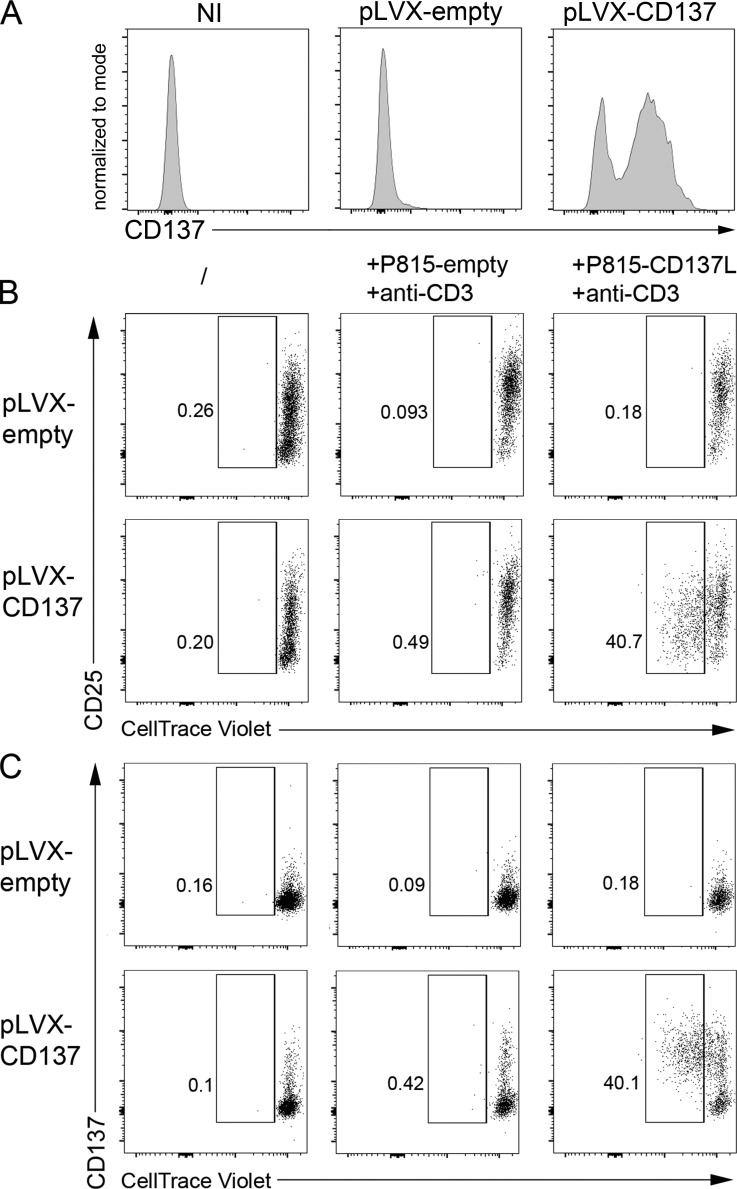
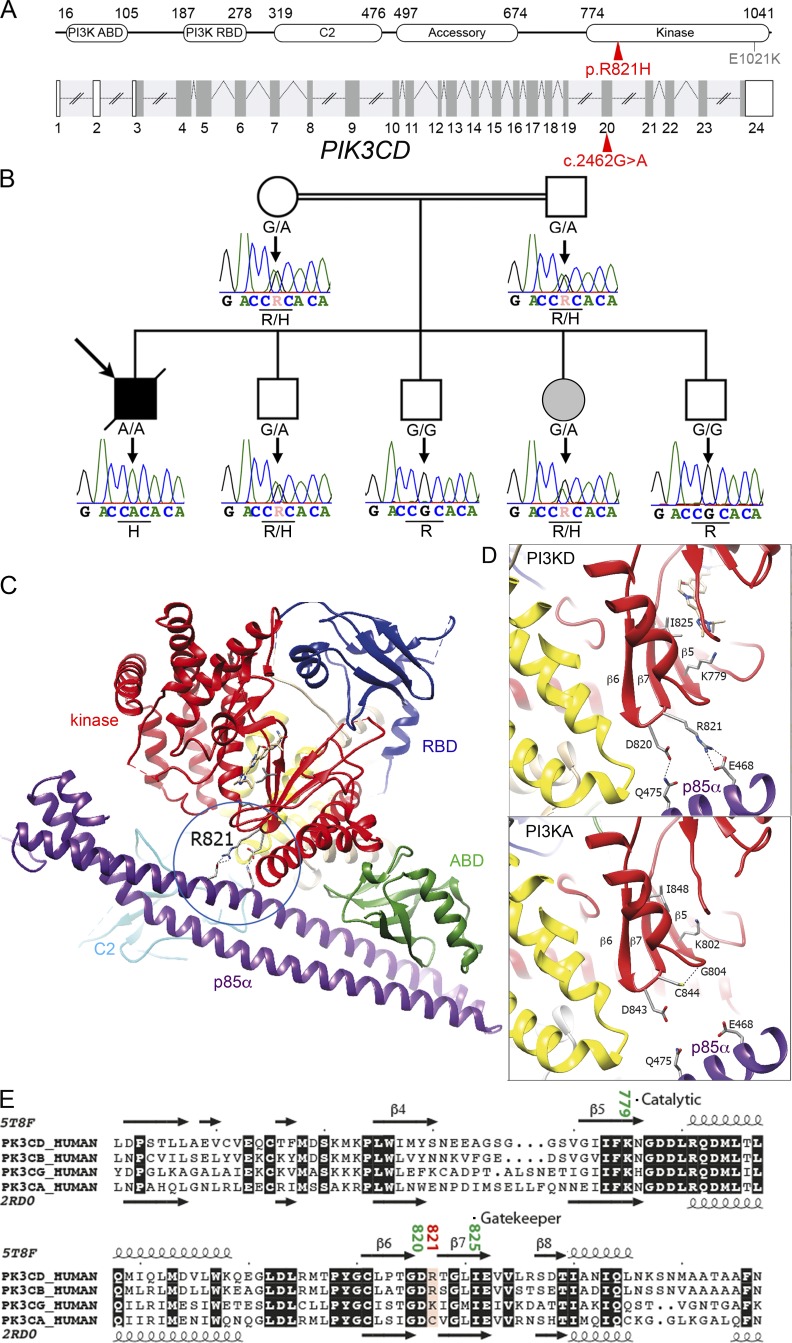
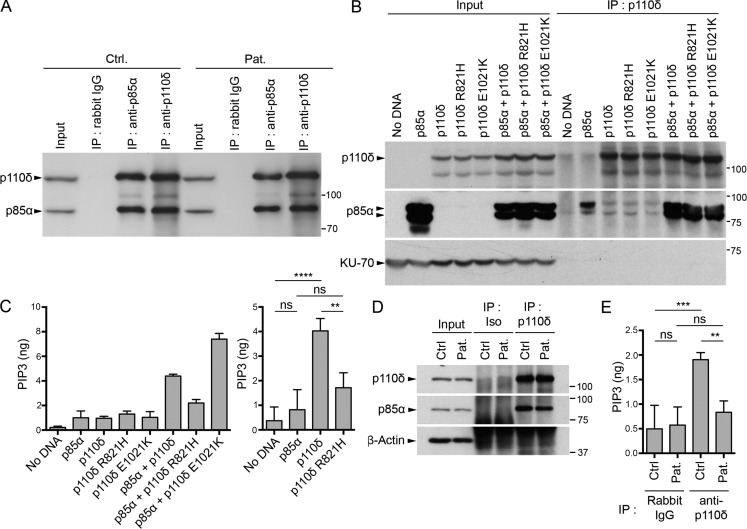
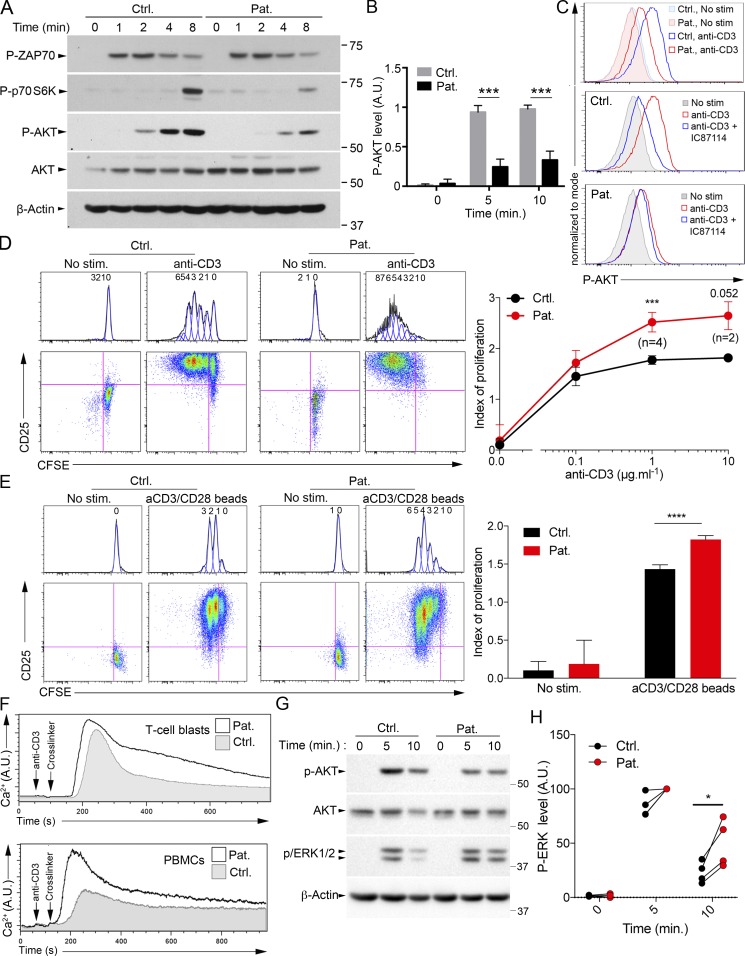
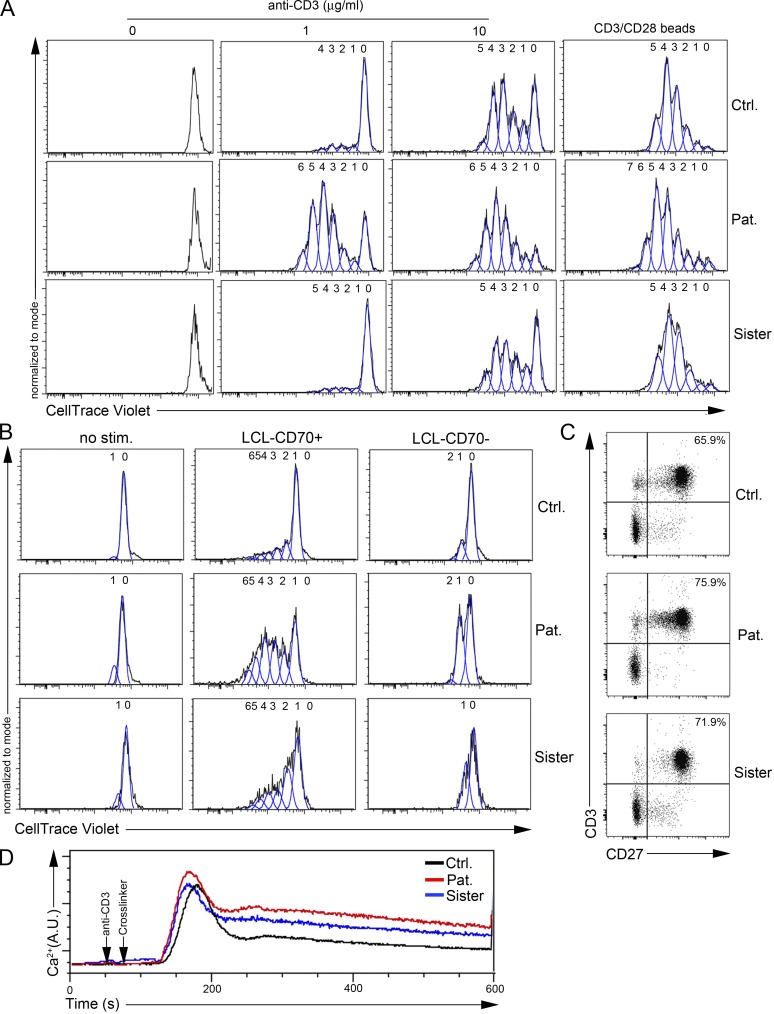
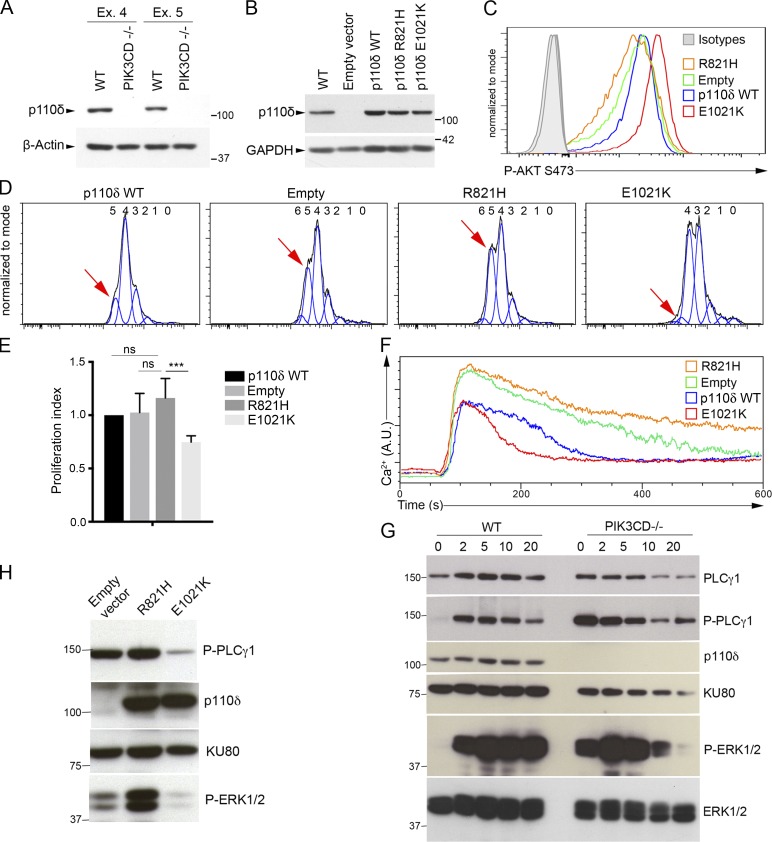
Infection of T cells by Epstein-Barr virus (EBV) causes chronic active EBV infection (CAEBV) characterized by T cell lymphoproliferative disorders (T-LPD) of unclear etiology. Here, we identified two homozygous biallelic loss-of-function mutations in PIK3CD and TNFRSF9 in a patient who developed a fatal CAEBV. The mutation in TNFRSF9 gene coding CD137/4-1BB, a costimulatory molecule expressed by antigen-specific activated T cells, resulted in a complete loss of CD137 expression and impaired T cell expansion toward CD137 ligand-expressing cells. Isolated as observed in one sibling, CD137 deficiency resulted in persistent EBV-infected T cells but without clinical manifestations. The mutation in PIK3CD gene that encodes the catalytic subunit p110δ of the PI3K significantly reduced its kinase activity. Deficient T cells for PIK3CD exhibited reduced AKT signaling, while calcium flux, RAS-MAPK activation, and proliferation were increased, suggestive of an imbalance between the PLCγ1 and PI3K pathways. These skewed signals in T cells may sustain accumulation of EBV-infected T cells, a process controlled by the CD137-CD137L pathway, highlighting its critical role in immunity to EBV.


Figures

None
Graphical abstract
Figure 1.
Figure 1.
Identification of a homozygous mutation in TNFRSF9 in two siblings with chronic EBV viremia and EBV-infected T cells. (A) Family pedigree with DNA electropherograms and the TNFRSF9 c.170DelG (−) genotype of each individual. The proband is indicated by an arrow. The healthy sister with chronic EBV corresponds to the gray circle. (B and C) EBV blood loads in the patient (B) and his sister (C) with EBV copies at different time points (black circles; y, years; m, months). Arrows indicate anti-CD20 treatments. (D) Patient liver biopsy. Staining with anti-CD3 (CD3) or anti-CD20 (CD20) showing portal and sinusoidal inflammatory infiltrate composed of CD3+ T lymphocytes and CD20+ B cells. Double staining with anti-CD3 antibody and EBER probe (CD3+EBER) detects EBV in the nucleus of most of CD3+ T cells. Magnification, ×200. Scale bar, 60 µm. (E) Schematic representation of TNFRSF9 intron–exon organization (coding regions in dark gray) and protein structure (extracellular [EC], transmembrane [TM], and intracytoplasmic [IC] domains) above. The mutation is indicated in red.
Figure 2.
Figure 2.
The G57fsX91 mutation prevents CD137 expression in activated T cells. (A) FACS histograms of CD137 of T cell blasts from the patient (Pat.), his sister, and a control (Ctrl.) unstimulated (No stim.) or stimulated with immobilized anti-CD3 antibody or PMA+ionomycin (PMA+Iono) for 7 d. Isotype control in gray. (B) FACS histograms of CD137 and CD27 of PBMCs unstimulated (gray) or stimulated with anti-CD3/CD28–coated beads (red) for 3 d. (C) Expression of CD137 full-length transcript (768 pb) and GAPDH (258 pb) by qRT-PCR in 72 h PHA-stimulated blasts. GAPDH as normalization controls for cDNA samples diluted as indicated, with the DNA ladder (kilobases) on the right. Bottom: FACS histograms of CD137 (isotype control in gray) and CD25 (non- and PHA-stimulated cells in red and blue, respectively). (D) FACS histograms of CD137L expression on P815 expressing CD137L (P815-CD137L) or not (P815-empty). Isotype control is shown in blue. (E) FACS dot-plots of proliferation assays of PBMCs labeled with the CellTrace Violet dye and cocultured or not (/) for 5 d with irradiated P815-CD137L or P815-empty cells preincubated with anti-CD3. Staining with anti-CD25 antibody as activation marker and gating on CD4+ or CD8+ T cells. Proliferating and nonproliferating T cells in the upper left and right lower gates, respectively. (F) FACS histograms of CD137 in proliferating (blue) or nonproliferating (red) CD4+ or CD8+ T cells gated from E. Numbers in A and E correspond the percentage of cells in gates. (D) One representative experiment of three. (E and F) experiments done in duplicate with the same results. One replicate is shown.
Figure 3.
Figure 3.
Correction of CD137 expression in CD137-deficient T cells restores their capacity to proliferate in response to CD137L-expressing cells. (A) FACS histograms of CD137 expression of T cells from the sister infected or not (NI) with a lentiviral vector containing or not (pLVX empty) a cDNA for CD137 (pLVX-CD137). (B and C) FACS dot-plots of proliferation assays from T cells shown in A (same as cells shown in Fig. 2 E). Cells were stained with an anti-CD25 antibody (B) as an activation marker or with an anti-CD137 antibody (C) and CellTrace Violet dilution analyzed by flow cytometry after gating on CD8+ T cells. Numbers correspond the percentage of proliferating cells in gates. Experiments in A–C were done in duplicate with the same results. One replicate is shown.
Figure 4.
Figure 4.
Identification in the patient of a homozygous mutation in PIK3CD affecting the catalytic site. (A) Schematic representation of PIK3CD coding the p110δ. Intron–exon organization (coding regions in dark gray) and corresponding protein structure. ABD, adaptor-binding domain; RBD, Ras-binding domain. The mutation is indicated in red, and the previously GOF mutation E1021K in gray. (B) Family pedigree with DNA electropherograms and the PIK3CD c.2462 G>A genotype of each individual (also see Fig. 1 A). (C) Ribbon representation of the p110δ–p85α complex (PDB: 5T8F), highlighting possible bonds between the p110δ kinase domain and p85α, in addition to contacts made by C2 and ABD. (D) Comparison of the experimental three-dimensional structures of PIK3CD (PI3KD; PDB: 5T8F; Castanedo et al., 2017) and PIK3CA (PI3KA; PDB: 2RD0; Huang et al., 2007) in complex with p85α. The catalytic residues K779 (PI3KD) and K802 (PI3KA) are shown and specific contacts with p85α (in purple) are highlighted. (E) Alignment of isoforms of p110 within the kinase domain. The observed secondary structures of p110δ/PIK3CD (PDB: 5T8F) and p110α/PIK3CA (PDB: 2RD0) are reported above and below the alignment, respectively (UniProtKB accession numbers PIK3CD_HUMAN: O00329, PK3CB_HUMAN: P42338, PK3CG_HUMAN: P48736, and PK3CA_HUMAN: P42336).
Figure 5.
Figure 5.
The R821H mutation in PIK3CD impairs p110δ kinase activity, but not binding to p85α. (A and B) Analysis of the p85α–p110δ association. (A) T cell lysates from the patient (Pat.) or a control (Ctrl.) after IP with control IgG (Rabbit IgG) or with antibody to p85α or p110δ followed by WB with anti-p85α or anti-p110δ. Total lysates (input) are shown on the left; molecular weight markers are shown on the right. (B) Lysates of HEK293T cells ectopically expressing or not p85α and/or WT, R821H, or E1021K p110δ, followed or not (input controls) by IP with anti-p110δ antibody (IP: p110δ) and WB with anti-p110δ, -p85α, and -KU-70 antibody as loading control. HEK293T expressed small amount of p85α that is not detected in the input but detectable in the IP of the p110δ, p110δ R821H, and p110δ E1021K (without ectopic p85α expression). (C) In vitro PI3K assays after IP, as in B, followed by quantification of produced PIP3 (left). Statistical analyses are shown on the right. (D) Same as A, except that total lysates are shown (input) and WB with anti–β-actin was used as a loading control. (E) In vitro PI3K assay of IPs obtained as in D followed by quantification of produced PIP3. Data are representative of two independent experiments (A, B, and C, left, and D) or are mean and SD of two independent experiments with three (C, right) or two (E) kinase assay replicates per group. ns, not significant; **, P < 0.01; ***, P < 0.001; ****, P < 0.0001 (one-way ANOVA with post hoc Bonferroni t test).
Figure 6.
Figure 6.
The R821H mutation in PIK3CD is associated with diminished activation of AKT and increased T cell proliferation and calcium flux. (A) Immunoblots of phosphorylated AKT (P-AKT), p70 S6K (P-p70 S6K), and ZAP70 (P-ZAP70) in T cell blasts from a control (Ctrl.) and the patient (Pat.) stimulated with anti-CD3 antibody for 0, 1, 2, 4, and 8 min. Total AKT and ACTIN were used as loading controls. Molecular weight markers are shown on the right. (B) Densitometry quantifications of immunoblots of P-AKT of T cells stimulated as in A for 0, 5, and 10 min. (C) FACS histograms of intracellular P-AKT in activated T cells not stimulated (no stim.) or stimulated with anti-CD3 in the presence or not of the p110δ pharmacological inhibitor IC87114 (IC). (D and E) FACS dot-plots and corresponding histograms of proliferation assays (after gating on CD3+ cells) assessed with the CFSE dye. T cell blasts (D) or PBMCs (E) stimulated or not with immobilized 1 µg ml−1 anti-CD3 (D, left), different doses of anti-CD3 (D, right) or anti-CD3/CD28 coated beads (E). Staining with anti-CD25 antibody as an activation marker. Numbers ahead each peak correspond to the number of divisions. Calculated proliferation indexes from FACS data are shown on the right. (F) Intracellular Ca2+ levels by real time flow cytometry in T cell blasts or PBMCs of Ctrl. (gray) or Pat. (black line) after stimulation with anti-CD3 and a cross-linker. (G) Same as A, with immunoblots of phosphorylated ERK (P-ERK). (H) Normalized densitometry quantifications of P-ERK immunoblots. Stimulation of patient cells at 5 min was used as 100%. *, P < 0.1; ***, P < 0.001; ****, P < 0.0001 with unpaired (B) or paired (D, E, and H) Student’s t test from data of five (B), two (0.1 and 10 µg ml−1; D), or four (0 and 1 µg ml−1; D) or four (E and H) independent experiments with mean and SD. In D, at 10 µg ml−1, P = 0.052 as indicated. Data are representative of three independent experiments for A, C, and F. A.U., arbitrary units.
Figure 7.
Figure 7.
Increased proliferation of activated T cells from the patient is not observed in his sister. (A and B) FACS histograms from plots of proliferation assays of T cell blasts (A) or PBMCs (B) from a control (Ctrl.), the patient (Pat.), or his sister assessed with the CellTrace Violet dye. Numbers ahead each peak correspond to the number of divisions. Cells were (A) stimulated or not (0) with immobilized 1 or 10 µg ml−1 anti-CD3 antibody or anti-CD3/CD28–coated beads or (B) stimulated by coculture or not (no stim.) with LCLs expressing (LCL-CD70+) or not CD70 (LCL-CD70) after preincubation with anti-CD3 antibody. (C) FACS dot-plots of CD27 and CD3 of PBMCs. Numbers represent the percentage of CD27+ CD3+ cells in the gates. (D) Intracellular Ca2+ levels analyzed by real-time flow cytometry in T cell blasts from the control (black line), the patient (red line), or his sister (blue line) after stimulation with anti-CD3 and a cross-linker. Data are from a single experiment (in which the cells of the patient and his sister were compared) but representative of several independent experiments in which the patient and his sister were tested separately and compared with controls (see Fig. 6, D and E; and Fig. S4 G).
Figure 8.
Figure 8.
Imbalanced PLCγ1–dependent signals in PIK3CD-deficient Jurkat T cells. (A and B) Immunoblots of p110δ expression (A) of PIK3CD-deficient (PIK3CD−/−) Jurkat cell lines obtained from CRISPR-Cas9 targeting of exon 4 (Ex. 4) or exon 5 (Ex. 5) of PIK3CD or nontargeted (WT) Jurkat cell lines (B) of WT or exon 4–targeted PIK3CD-deficient Jurkat cells (CRISPR-Ex4-PIK3CD−/−) reconstituted with an empty vector or a vector coding for WT (p110δ WT), R821H, or E1021K p110δ. (C) FACS histograms of intracellular phosphorylated AKT at serine 473 (Ser473 P-AKT) in the different exon 4 PIK3CD−/− Jurkat cell lines shown in B. Isotype controls are in gray. (D) FACS histograms from plots of proliferation assays of the different CRISPR–exon 4–PIK3CD−/− Jurkat cell lines shown in B assessed with the CellTrace Violet dye. Numbers ahead each peak correspond to the number of divisions. The red arrow indicates the peak of the fifth division in each histogram. (E) Indexes of proliferation calculated from D. (F) Intracellular Ca2+ levels analyzed by real-time flow cytometry in the different CRISPR–exon 4–PIK3CD−/− Jurkat cell lines shown in B stimulated with anti-CD3 antibody. (G) Immunoblots of phosphorylated PLCγ1 (P- PLCγ1) and ERK1/2 (P-ERK1/2) in WT Jurkat (WT) or CRISP–exon 4–PIK3CD−/− Jurkat (PIK3CD−/−) stimulated with anti-CD3 for 0, 1, 2, 5, 10, and 20 min. Total amounts of PLCγ1, PIK3CD (p110δ), KU80, and ERK1/2 are shown. (H) Same as G in nonstimulated PIK3CD−/− Jurkat (exon 4) reconstituted cells shown in B. (G and H) One representative experiment of two is shown. Similar experiments done with cells PIK3CD−/− cells obtained by targeting exon 5 showing the same results (see Fig. S4). Molecular weight markers are shown on the right (A and B) and left (G and H). Data are representative of three (A and B) or two (C, D, and F) independent experiments with three (D) or one (C and F) biological replicate per group in each. Two-way ANOVA test in E with mean and SD of two independent experiments with three and two replicates. ns, not significant; ***, P < 0.001, n = 5.

References

    1. Abolhassani, H., Edwards E.S., Ikinciogullari A., Jing H., Borte S., Buggert M., Du L., Matsuda-Lennikov M., Romano R., Caridha R., et al. . 2017. Combined immunodeficiency and Epstein-Barr virus-induced B cell malignancy in humans with inherited CD70 deficiency. J. Exp. Med. 214:91–106. 10.1084/jem.20160849 - DOI - PMC - PubMed
    1. Abraham, R.T., and Weiss A.. 2004. Jurkat T cells and development of the T-cell receptor signalling paradigm. Nat. Rev. Immunol. 4:301–308. 10.1038/nri1330 - DOI - PubMed
    1. Alkhairy, O.K., Perez-Becker R., Driessen G.J., Abolhassani H., van Montfrans J., Borte S., Choo S., Wang N., Tesselaar K., Fang M., et al. . 2015. Novel mutations in TNFRSF7/CD27: Clinical, immunologic, and genetic characterization of human CD27 deficiency. J. Allergy Clin. Immunol. 136:703–712.e10. 10.1016/j.jaci.2015.02.022 - DOI - PubMed
    1. Alosaimi, M.F., Hoenig M., Jaber F., Platt C.D., Jones J., Wallace J., Debatin K.M., Schulz A., Jacobsen E., Möller P., et al. . 2019. Immunodeficiency and EBV-induced lymphoproliferation caused by 4-1BB deficiency. J. Allergy Clin. Immunol. 144:574–583.e5. 10.1016/j.jaci.2019.03.002 - DOI - PMC - PubMed
    1. Angulo, I., Vadas O., Garçon F., Banham-Hall E., Plagnol V., Leahy T.R., Baxendale H., Coulter T., Curtis J., Wu C., et al. . 2013. Phosphoinositide 3-kinase δ gene mutation predisposes to respiratory infection and airway damage. Science. 342:866–871. 10.1126/science.1243292 - DOI - PMC - PubMed

Publication types

MeSH terms

Substances