. 2019 Dec 2;216(12):2763-2777.
doi: 10.1084/jem.20182111. Epub 2019 Sep 19.

A CCL1/CCR8-dependent feed-forward mechanism drives ILC2 functions in type 2-mediated inflammation

Affiliations

A CCL1/CCR8-dependent feed-forward mechanism drives ILC2 functions in type 2-mediated inflammation

Lisa Knipfer et al. J Exp Med. .

Abstract

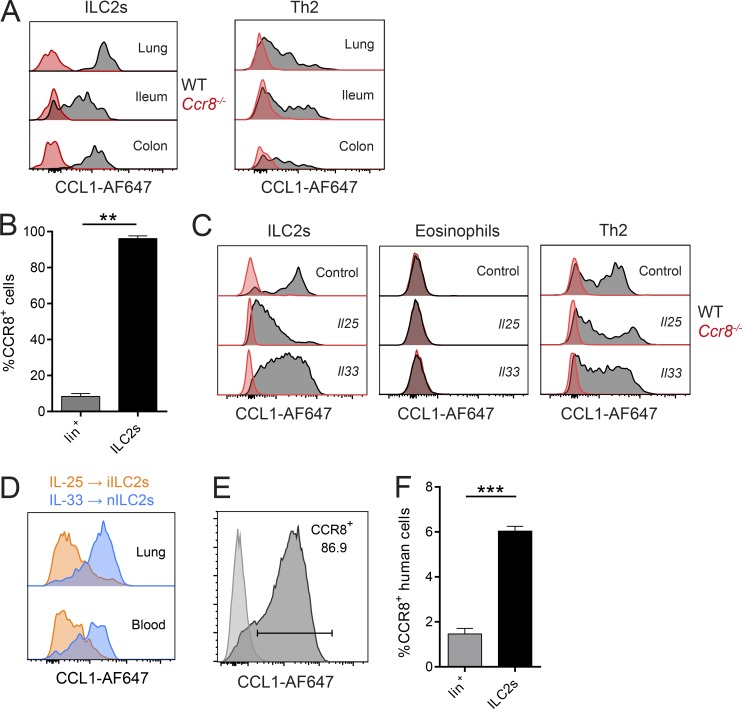
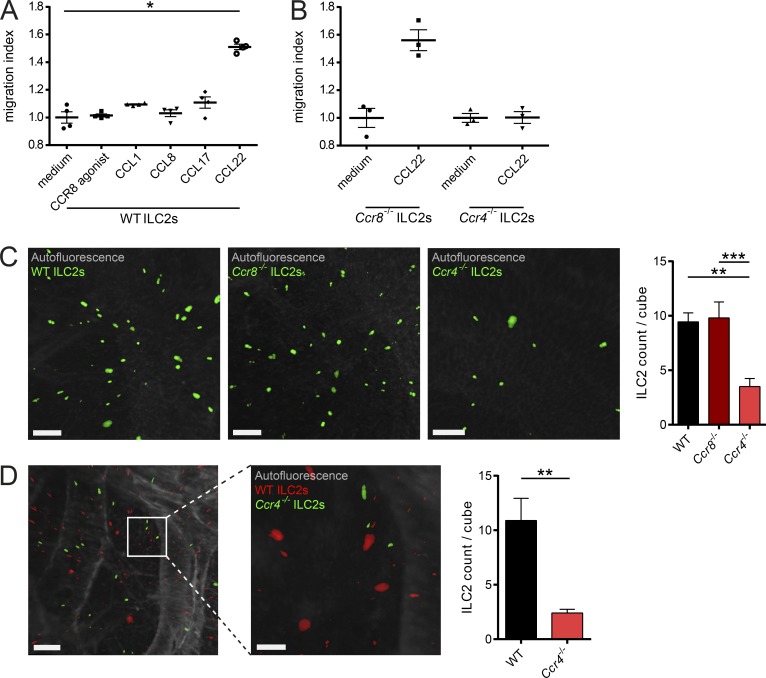
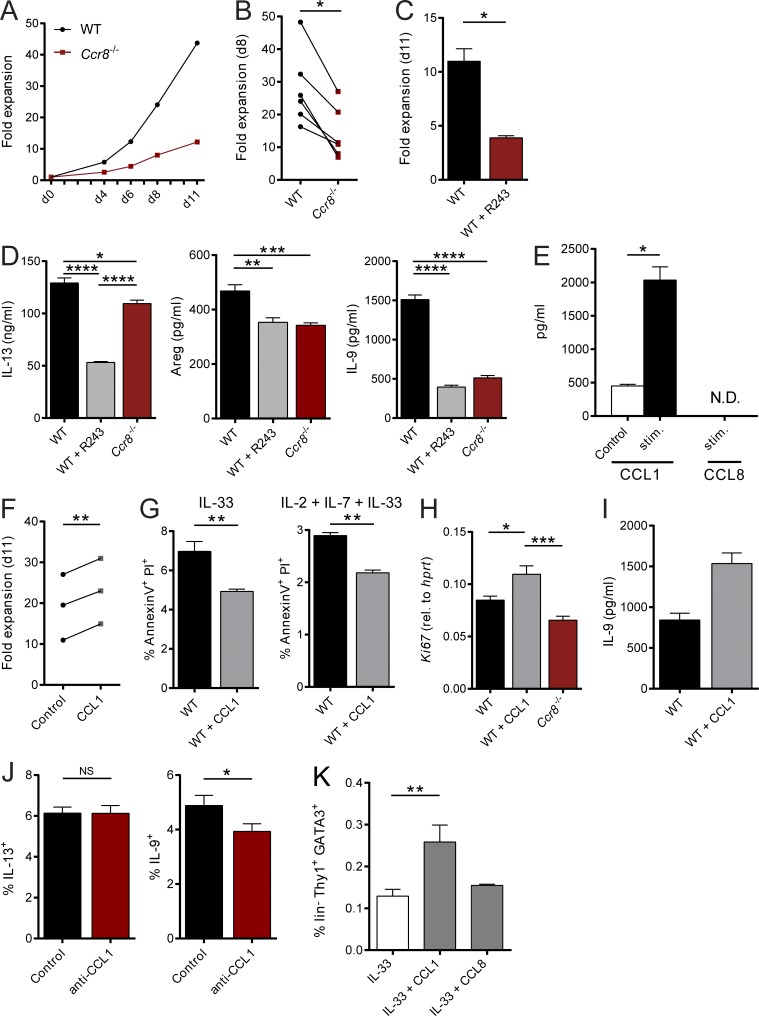
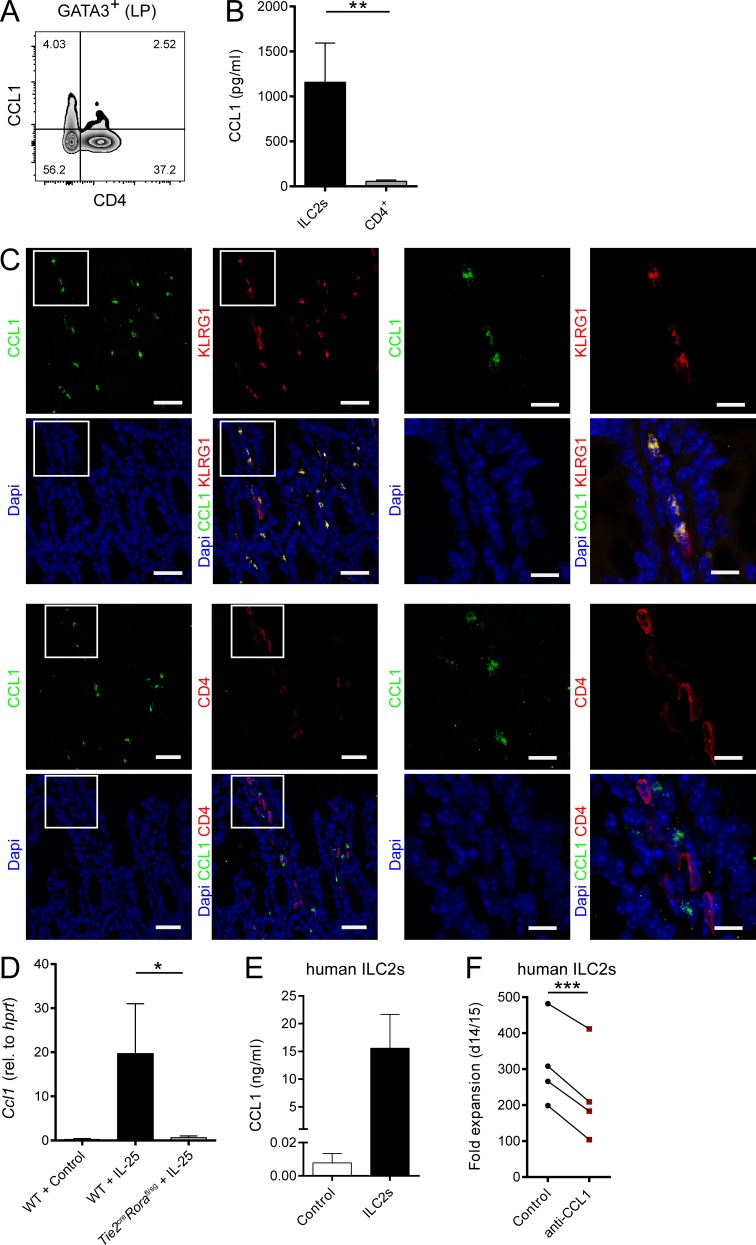
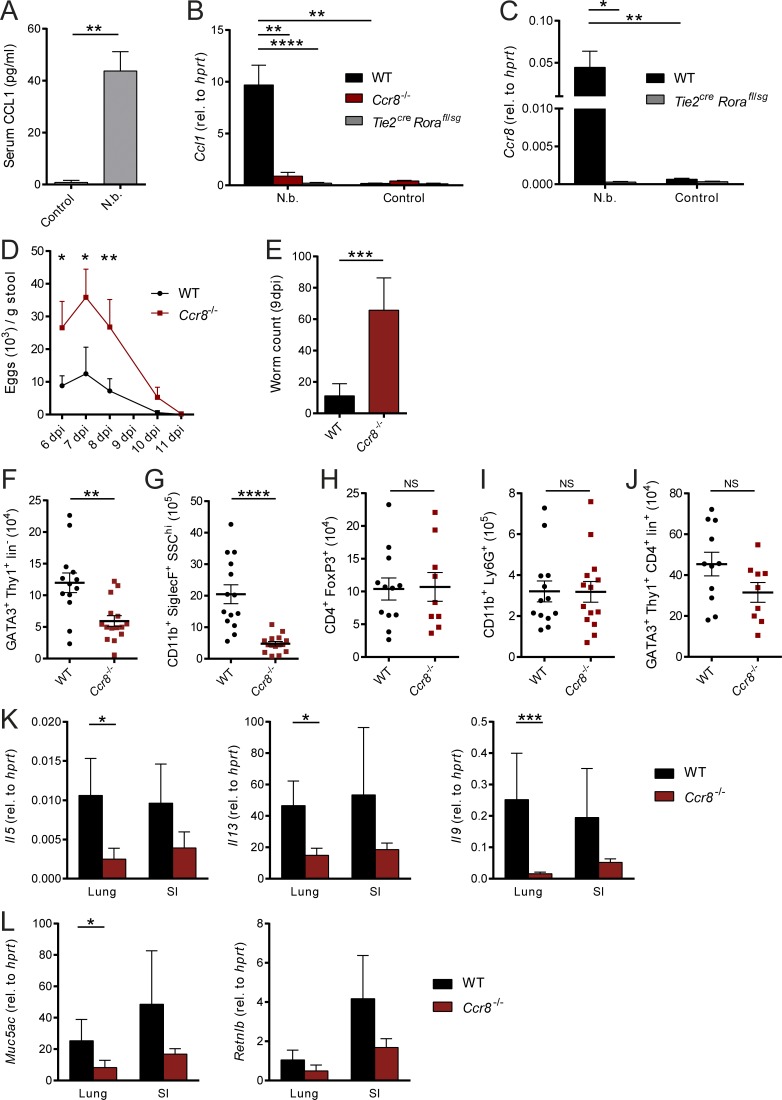
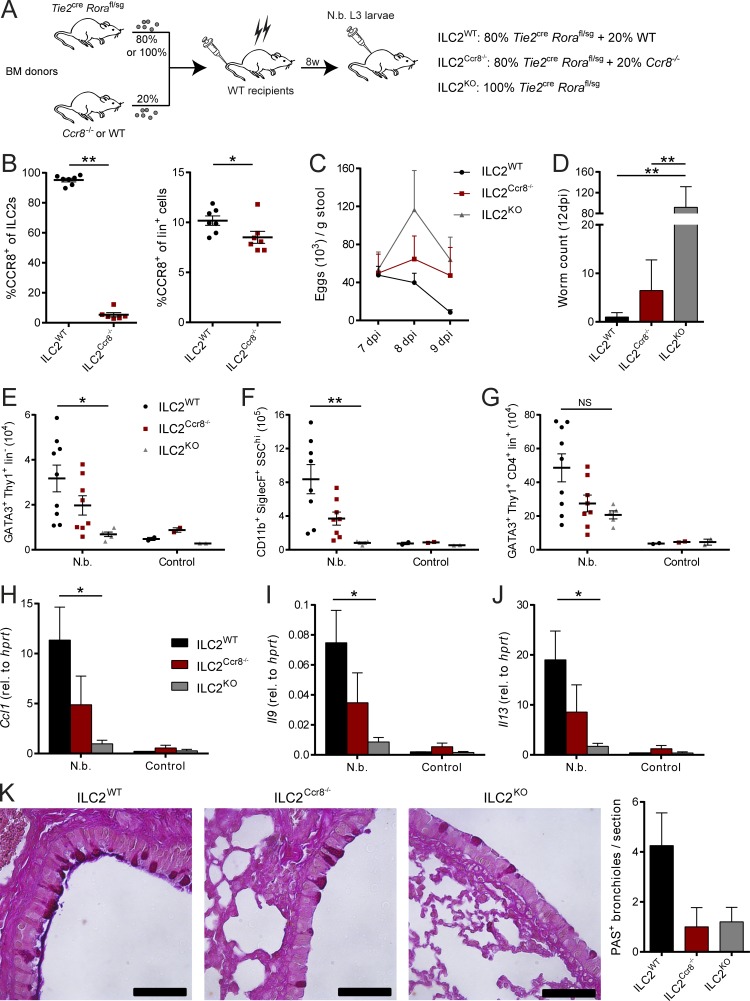
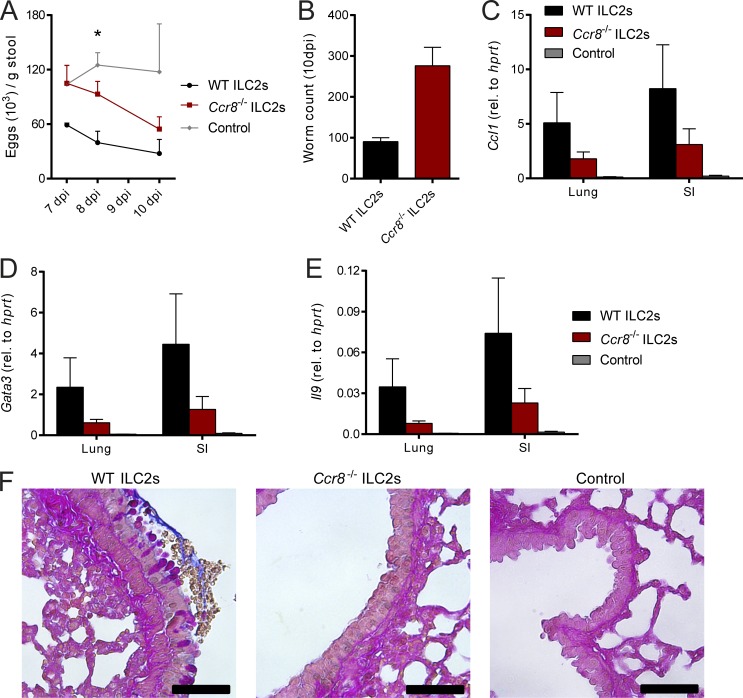
Group 2 innate lymphoid cells (ILC2s) possess indispensable roles during type 2-mediated inflammatory diseases. Although their physiological and detrimental immune functions seem to depend on the anatomical compartment they reside, their tissue tropism and the molecular and immunological processes regulating the self-renewal of the local pool of ILC2s in the context of inflammation or infection are incompletely understood. Here, we analyzed the role of the CC-chemokine receptor CCR8 for the biological functions of ILC2s. In vitro and in vivo experiments indicated that CCR8 is in comparison to the related molecule CCR4 less important for migration of these cells. However, we found that activated mouse and human ILC2s produce the CCR8 ligand CCL1 and are a major source of CCL1 in vivo. CCL1 signaling to ILC2s regulates their proliferation and supports their capacity to protect against helminthic infections. In summary, we identify a novel chemokine receptor-dependent mechanism by which ILC2s are regulated during type 2 responses.


Figures

Figure 1.
Figure 1.
Analysis of CCR8 expression on ILC2s. (A–F) Flow cytometric analyses of CCR8 surface expression using fluorophore-coupled recombinant CCL1 (CCL1-AF647) or a human anti-CCR8 antibody (F). (A) ILC2s (LinThy1+KLRG1+ICOS+ST2+) or Th2 (CD3+CD4+ST2+) cells in lung or the ileal/colonic lamina propria of naive WT and Ccr8−/− mice were analyzed by flow cytometry. (B) WT mice were infected with N. brasiliensis, and lung lineage+ lymphocytes (lin+) and ILC2s (LinThy1+KLRG1+ST2+) were analyzed after 9 d. A Mann–Whitney U test was applied. (C) Lung cells of WT and Ccr8−/− mice challenged for 3 d with DNA vectors encoding Il25 or Il33 or empty vectors (control) were analyzed for CCR8 on ILC2s (LinThy1+KLRG1+ICOS+), eosinophils (CD11b+SiglecF+CD11cSSChi), and Th2 cells (Lin+Thy1+ST2+). (D) To investigate CCR8 expression on ILC2 subsets, WT mice were treated with Il25 (to induce iILC2s) or Il33 (to induce nILC2s) vectors for 5 d, and iILC2s (LinCD127+KLRG1hiST2) or nILC2s (LinCD127+KLRG1intST2+) from lungs and blood were analyzed and compared by flow cytometry. (E) Murine sorted and in vitro–expanded ILC2s were analyzed and compared with a fluorescence minus one (FMO) control. (F) ILC2s (LinCD127+CD161+CRTH2+) and lineage+ (Lin+) lymphocytes in freshly isolated human PBMCs were analyzed. An unpaired t test was applied. All results are representative of two or more independent experiments. A and C–E show representative histograms of one animal of two to four animals in total per experimental group (A, C, and D) or four independent sorting experiments (E). Bar graphs represent five mice (B) or three donors (F). Data represent mean ± SEM. **, P ≤ 0.01; ***, P ≤ 0.001 by Mann–Whitney U tests or unpaired t test.
Figure 2.
Figure 2.
CCR4, but not CCR8, mediates ILC2 migration. (A and B) To assess the migratory behavior of ILC2s, in vitro–expanded WT (A) and Ccr8−/− or Ccr4−/− (B) ILC2s were used. Chemotaxis assays were performed using transwell inserts against gradients of the chemokines CCL1, CCL8, CCL17, or CCL22 (100 ng/ml each) as well as an activating CCR8 agonist (5 µM). (C and D) To investigate ILC2 lung homing, WT mice were pretreated with papain, and 106 fluorescent-labeled WT, Ccr4−/−, or Ccr8−/− ILC2s (C) or a 50:50 mix (D) were adoptively transferred by i.v. injection. 24 h later, lungs were collected, processed, and analyzed by light-sheet microscopy. (C) One-way ANOVA was applied. Scale bars are 100 µm. Images were acquired with a 10× zoom factor. (D) The pictures show snapshots of Video 1. Scale bars are 200 µm (left) or 100 µm (right). Images were acquired with a 25× zoom factor. (A and B) Each dot represents a technical replicate. One representative experiment out of two independently performed experiments is shown. (C and D) Data represent one out of two independent sorting experiments with one or two mice per group. Data represent mean ± SEM. *, P ≤ 0.05; **, P ≤ 0.01; ***, P ≤ 0.001 by Mann-Whitney U tests or, if indicated, one-way ANOVA.
Figure 3.
Figure 3.
The CCR8 ligand CCL1 is an autocrine survival factor for ILC2s. (A–C and F) Sorted mouse ILC2s were cultured as described in Materials and methods and cell numbers determined at the indicated days to calculate fold expansion. (A and B) WT and Ccr8−/− ILC2 numbers were compared at indicated time points. (A) One representative experiment is shown. (B) Each replicate represents one independent sorting experiment. An unpaired t test was applied. (C) WT ILC2s were expanded in the presence of the CCR8 inhibitor R243. (D) In vitro–expanded WT ILC2s, WT ILC2s plus R243, and Ccr8/− ILC2s were restimulated with IL-2, IL-7, and IL-33 (20 ng/ml each). Production of IL-13, Amphiregulin, and IL-9 was measured in the supernatants after 24 h. A one-way ANOVA was applied. (E) To measure secretion of CCL1 and CCL8 by in vitro–expanded murine WT ILC2s, cells were stimulated (IL-2, IL-7, and IL-33; 20 ng/ml each) under addition of PMA/ionomycin, and supernatants were collected after 24 h. (F) WT ILC2s were expanded in the presence of CCL1 (50 ng/ml). Each replicate represents one independent sorting experiment, and a paired t test was applied. (G) To measure cell death, WT ILC2s expanded with or without CCL1 were restimulated for 24 h with IL-33 or IL-2, IL-7, and IL-33 (20 ng/ml each), and Annexin V/PI stainings were performed. (H) WT ILC2s expanded with or without CCL1 or Ccr8−/− ILC2s were restimulated for 24 h with IL-2, IL-7, and IL-33 (20 ng/ml each) and Ki67 expression determined by qPCR. A one-way ANOVA was applied. (I) IL-9 was measured in the supernatant of WT ILC2s expanded with or without CCL1 for 11 d. P = 0.0571. (J) Flow cytometry of WT ILC2s restimulated with IL-2, IL-7, and IL-33 (20 ng/ml each) and a neutralizing anti-CCL1 antibody (10 µg/ml) for 24 h. Monensin was added to the culture for the last 4 h of stimulation. (K) WT mice were challenged with DNA vectors for IL-33, CCL1, or CCL8 as indicated. After 5 d, liver single-cell suspensions were generated and analyzed by flow cytometry. The graphs show pooled data of two independent experiments with at least four mice per group. A one-way ANOVA was applied. (C–E and G–J) Data represent technical replicates of one out of at least two independent experiments. Data represent mean ± SEM. *, P ≤ 0.05; **, P ≤ 0.01; ***, P ≤ 0.001; ****, P ≤ 0.0001 by Mann-Whitney U tests or, if indicated, paired t test, unpaired t test, or one-way ANOVA. N.D., not detected.
Figure 4.
Figure 4.
ILC2s are a major in vivo source of CCL1. (A) Flow cytometric analysis of gut lamina propria (LP) cells. Lymphocytes were gated on GATA3+ cells and analyzed for CD4 and CCL1 expression. (B) ILC2s and CD4+ T cells were sorted from intestinal lamina propria cells of naive RoracreRosa26-tdtomatofl/fl mice. Cells were cultivated in the presence of PMA/ionomycin, and supernatants were collected after 48 h for CCL1-specific ELISA analysis. (C) Small intestinal tissue sections of C57BL/6 WT mice overexpressing IL-33 were stained with DAPI (blue), anti-CCL1 (green), and anti-KLRG1 (red, top) or anti-CD4 (red, bottom) antibodies and analyzed by confocal microscopy. Scale bars are 30 µm (left) or 10 µm (right). Pictures show results of one representative animal. (D) WT and Tie2creRorafl/sg mice were challenged with DNA vectors for systemic release of IL-25 or empty vectors (control). Livers were collected after 5 d, and the presence of Ccl1 transcripts was investigated by qPCR. (E) In vitro–expanded human ILC2s were restimulated with IL-2, IL-25, and IL-33, and supernatants were collected after 3 d for CCL1 measurements. CCL1 levels were compared with supernatants of feeder cells only. Each replicate represents one independent sorting experiment. (F) Sorted human ILC2s were expanded with or without neutralizing anti-CCL1 antibodies and cell number determined to investigate fold expansion. Each dot represents one independent sorting experiment. Paired t test was applied. All graphs show data of one representative experiment out of at least two independent experiments. Experimental groups consisted of at least three mice or donors. Data represent mean ± SEM. *, P ≤ 0.05; **, P ≤ 0.01; ***, P ≤ 0.001 by Mann–Whitney U tests or, if indicated, a paired t test.
Figure 5.
Figure 5.
Ccr8−/−mice are impaired in N. brasiliensis defense due to defective type 2 immune responses. (A–L) Mice of indicated genotypes were infected with 500 L3 N. brasiliensis (N.b.) larvae. (A) Serum concentrations of CCL1 in WT mice were measured in response to N. brasiliensis infection at 9 dpi. (B and C) Expression of Ccl1 and Ccr8 was determined in naive (control) and N. brasiliensis–infected WT, Ccr8−/−, and Tie2creRorafl/sg lungs by qPCR. One-way ANOVA was applied. (D) Parasite eggs in stool samples of WT and Ccr8−/− mice were counted 6 dpi to 11 dpi. (E) Adult worm counts in small intestinal tissues were determined 9 dpi. (F–J) ILC2 (GATA3+Thy1+Lin), eosinophil (CD11b+SiglecF+SSChi), T reg cell (CD4+FoxP3+), neutrophil (CD11b+Ly6G+), and Th2 cell (GATA3+Thy1+CD4+Lin+) numbers per lung were determined by flow cytometry 9 dpi. (K and L) Expression of the type 2–related effector cytokines Il5, Il13, and Il9 (K) as well as the mucins Muc5ac and Retnlb (L) were determined in lung and small intestinal (SI) tissues by qPCR 9 dpi. All graphs show pooled data of two to four representative experiments with at least four mice in each experimental group. Each dot represents one animal. Data represent mean ± SEM. *, P ≤ 0.05; **, P ≤ 0.01; ***, P ≤ 0.001; ****, P ≤ 0.0001; Mann–Whitney U tests or, if indicated, one-way ANOVA.
Figure 6.
Figure 6.
ILC2-specific deletion of CCR8 results in impaired immunity against N. brasiliensis infection. (A–K) Mixed bone marrow (BM) chimeras with 80% Tie2creRorafl/sg and 20% WT (ILC2WT) or Ccr8−/− (ILC2Ccr8−/−) bone marrow were generated. Additionally, chimeras with 100% Tie2creRorafl/sg (ILC2KO) bone marrow were created. After 8 wk, mice were infected with 500 L3 N. brasiliensis larvae or left untreated (control). (B) To confirm the absence of CCR8 on ILC2s in ILC2Ccr8−/− mice, flow cytometry of lung ILC2s (LinThy1+KLRG1+ST2+) and lineage+ lymphocytes was performed. CCR8 surface expression was detected using fluorophore-coupled recombinant CCL1 (CCL1-AF647). (C) Parasite egg counts were determined in stool samples. (D) Adult worm counts in small intestinal tissues were determined 12 dpi. (E–J) ILC2 (E; GATA3+Thy1+Lin), eosinophil (F; CD11b+SiglecF+SSChi), and Th2 (G; GATA3+Thy1+CD4+Lin+) numbers per lung were analyzed by flow cytometry 12 dpi. Ccl1 (H), Il9 (I), and Il13 (J) expression in lung tissues was determined by qPCR 12 dpi. (K) AB-PAS staining was performed from lung paraffin sections. Scale bars are 50 µm. Pictures show results of one representative animal and quantification of one representative experiment with three to five animals in one experimental group. Graphs in B–J show pooled data of two representative experiments out of three independent experiments in total. Each dot represents one animal. Data represent mean ± SEM. *, P ≤ 0.05; **, P ≤ 0.01; Mann–Whitney U tests (B) or one-way ANOVA (D–J).
Figure 7.
Figure 7.
CCR8 on ILC2s is critical for efficient type 2 immunity against N. brasiliensis infection upon adoptive cell transfer. (A–F) Sorted WT or Ccr8−/− ILC2s were adoptively transferred into Rag2−/−il2rg−/− mice or received no ILC2s (control) and infected with N. brasiliensis. (A) Parasite eggs were counted in stool samples. (B) Mice were sacrificed after 10 d, and adult worm counts in small intestinal tissues were determined. (C–E) Ccl1, Gata3, and Il9 expression was determined in lung and small intestinal tissues by qPCR. (F) AB-PAS staining was performed from lung paraffin sections. Scale bars are 50 µm. Pictures show results of one representative animal. Graphs in A–E show pooled data of two independent experiments with two to five mice in each experimental group. Data represent mean ± SEM. *, P ≤ 0.05 by one-way ANOVA.

References

    1. Anderson C.A., Solari R., and Pease J.E.. 2016. Biased agonism at chemokine receptors: obstacles or opportunities for drug discovery? J. Leukoc. Biol. 99:901–909. 10.1189/jlb.2MR0815-392R - DOI - PubMed
    1. Ballesteros-Tato A., Randall T.D., Lund F.E., Spolski R., Leonard W.J., and León B.. 2016. T Follicular Helper Cell Plasticity Shapes Pathogenic T Helper 2 Cell-Mediated Immunity to Inhaled House Dust Mite. Immunity. 44:259–273. 10.1016/j.immuni.2015.11.017 - DOI - PMC - PubMed
    1. Barlow J.L., and McKenzie A.N.. 2014. Type-2 innate lymphoid cells in human allergic disease. Curr. Opin. Allergy Clin. Immunol. 14:397–403. 10.1097/ACI.0000000000000090 - DOI - PMC - PubMed
    1. Barsheshet Y., Wildbaum G., Levy E., Vitenshtein A., Akinseye C., Griggs J., Lira S.A., and Karin N.. 2017. CCR8+FOXp3+ Treg cells as master drivers of immune regulation. Proc. Natl. Acad. Sci. USA. 114:6086–6091. 10.1073/pnas.1621280114 - DOI - PMC - PubMed
    1. Bishop B., and Lloyd C.M.. 2003. CC chemokine ligand 1 promotes recruitment of eosinophils but not Th2 cells during the development of allergic airways disease. J. Immunol. 170:4810–4817. 10.4049/jimmunol.170.9.4810 - DOI - PubMed

Publication types

MeSH terms