. 2019 Dec 2;216(12):2701-2713.
doi: 10.1084/jem.20190738. Epub 2019 Sep 19.

Selective inhibition of low-affinity memory CD8+ T cells by corticosteroids

Affiliations

Selective inhibition of low-affinity memory CD8+ T cells by corticosteroids

Akihiro Tokunaga et al. J Exp Med. .

Abstract

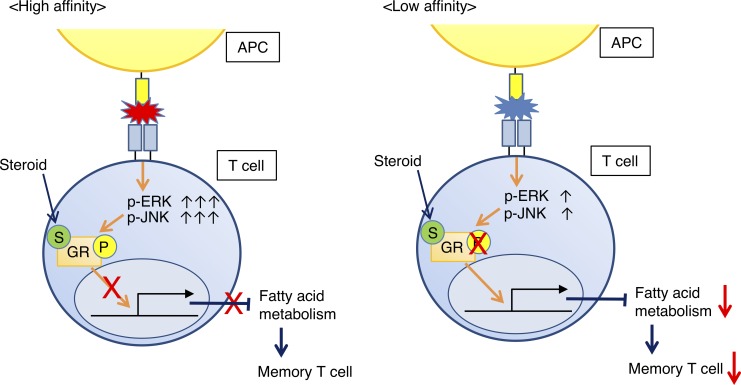
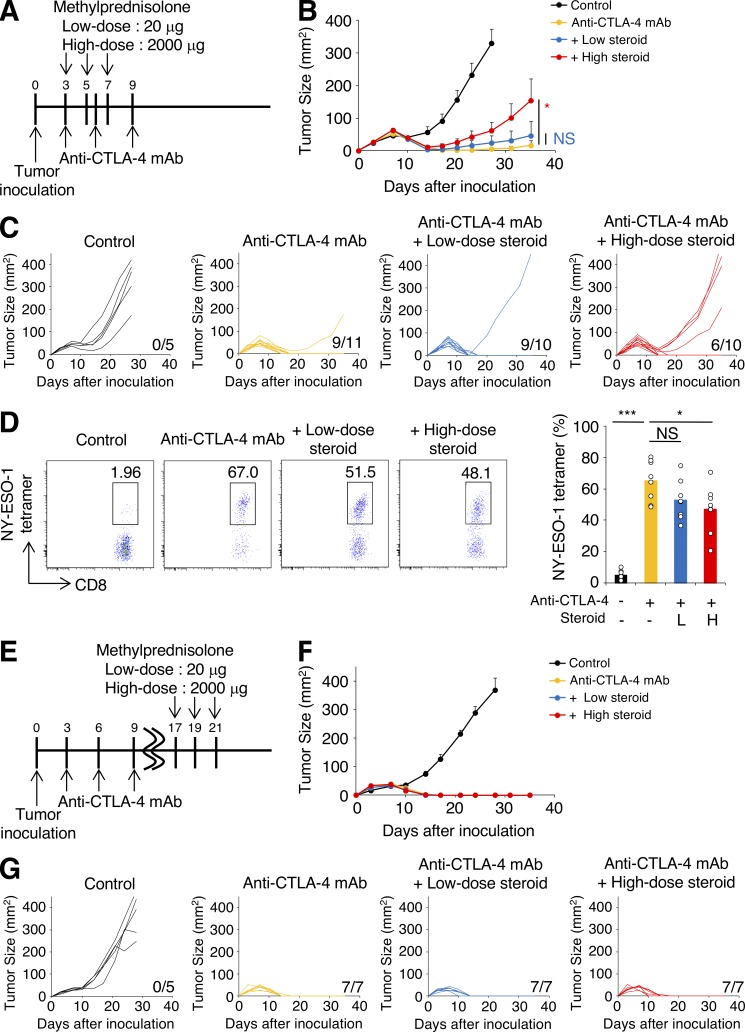
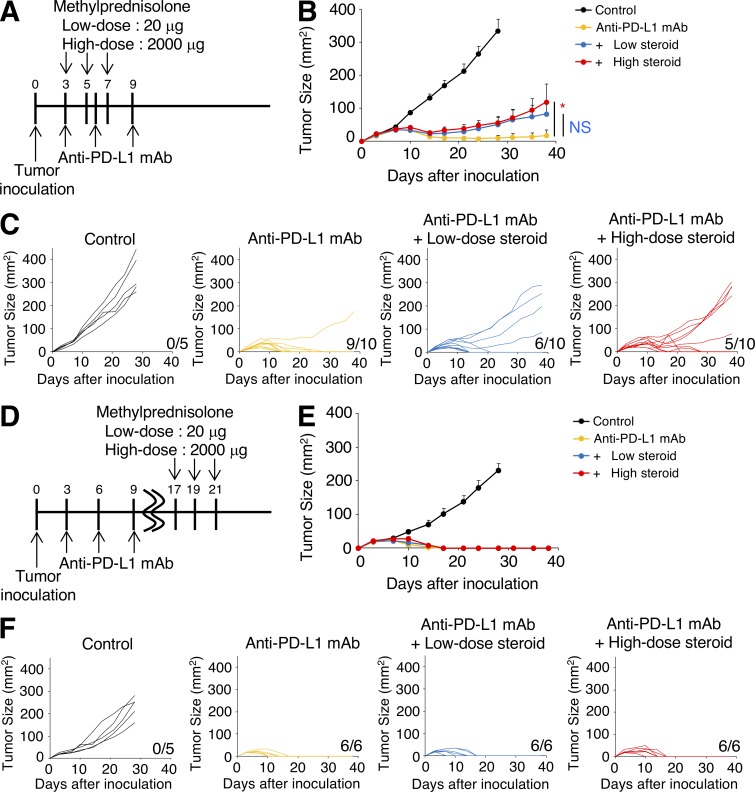
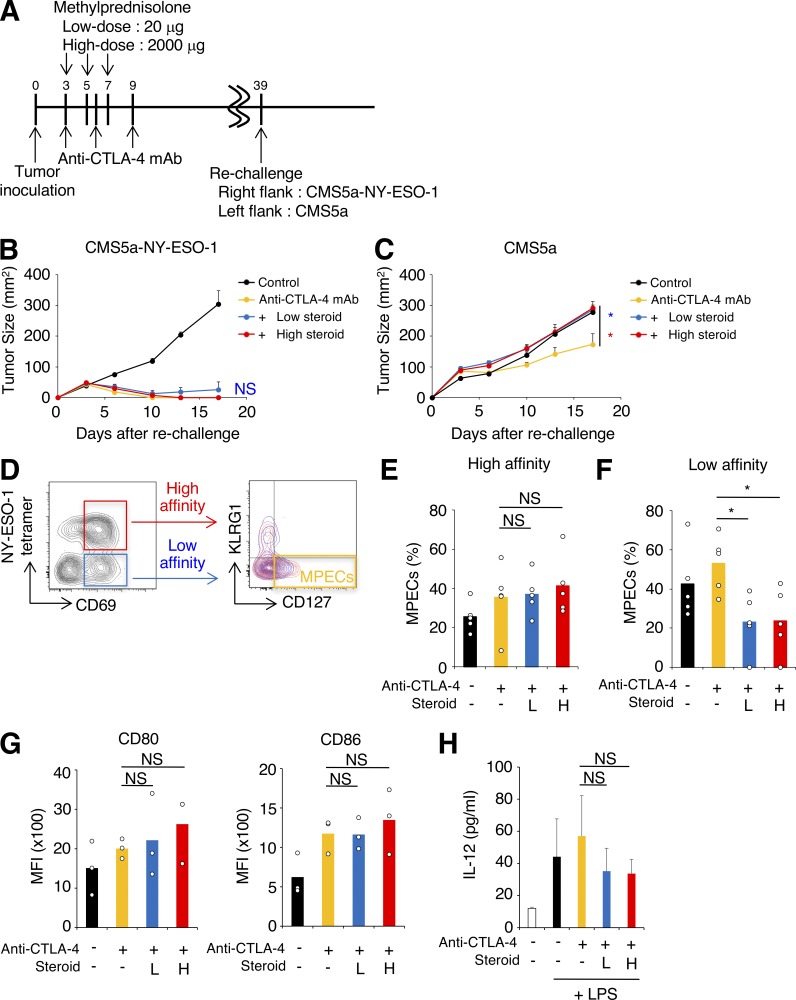
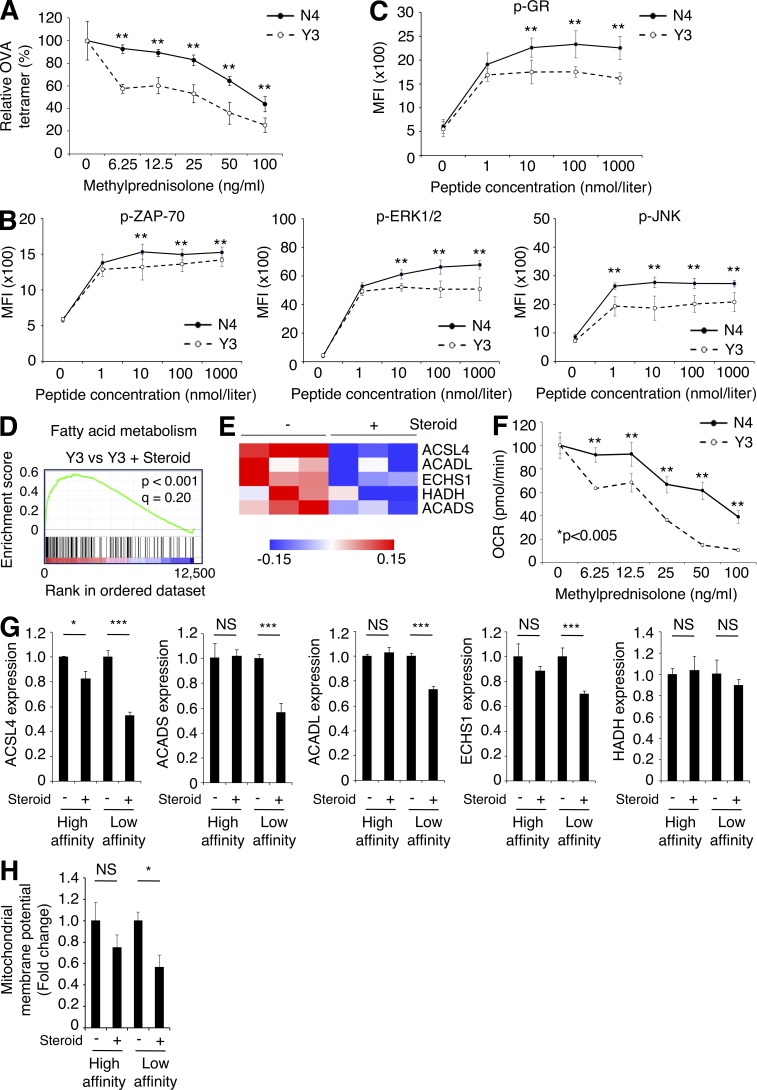
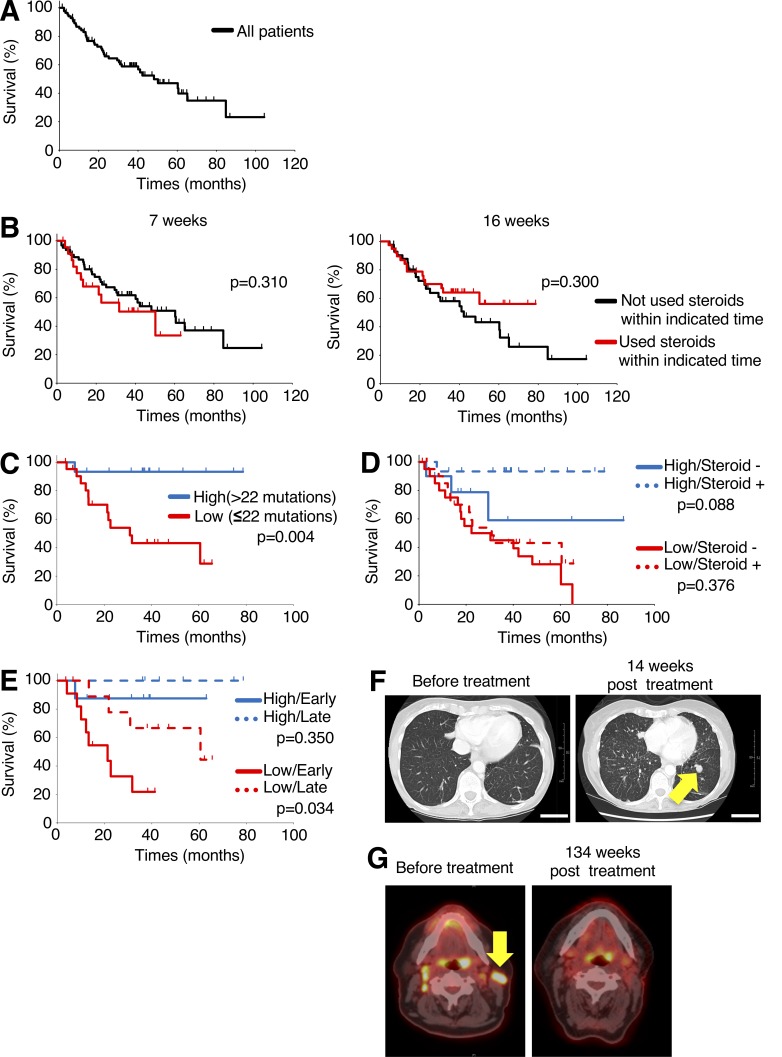
Patients treated with immune checkpoint blockade (ICB) sometimes experience immune-related adverse events (irAEs), requiring immuno-suppressive drugs such as corticosteroids despite the possibility that immunosuppression may impair the antitumor effects of ICB. Here, we address the dilemma of using corticosteroids for the treatment of irAEs induced by ICB. ICB augments neoantigen-specific CD8+ T cell responses, resulting in tumor regression. In our model, simultaneous, but not late, administration of corticosteroids impaired antitumor responses with reduction of CD8+ T cell proliferation. Secondary challenge using tumors with/without the neoantigen showed selective progression in tumors lacking the neoantigen when corticosteroids were administered. Corticosteroids decreased low- but not high-affinity memory T cells by suppressing fatty acid metabolism essential for memory T cells. In a small cohort of human melanoma patients, overall survival was shorter after treatment with CTLA-4 blockade in patients who received early corticosteroids or had low tumor mutation burden. Together, low-affinity memory T cells are dominantly suppressed by corticosteroids, necessitating careful and thoughtful corticosteroid use.


Figures

None
Graphical abstract
Figure 1.
Figure 1.
Early corticosteroid treatment reduces antitumor activity by anti–CTLA-4 mAb in a dose-dependent fashion. (A–C) Experimental schema (A) and tumor growth curves (B: mean, C: individual mice) of early corticosteroid treatment. BALB/c mice were inoculated with CMS5a-NY-ESO-1 and injected with anti–CTLA-4 mAb on days 3, 6, and 9 after tumor inoculation. Corticosteroid administration was started on the same day with anti–CTLA-4 mAb (n = 5–11). (D) Representative flow cytometric analysis (left) and summary (right) of NY-ESO-1-tetramer+CD8+ T cells in CMS5a-NY-ESO-1 tumors at 10 d after tumor inoculation (n = 8). L, low dose; H, high dose. (E–G) Experimental schema (E) and tumor growth curves (F: mean; G: individual mice) of late corticosteroid treatment. BALB/c mice were inoculated with CMS5a-NY-ESO-1 and injected with anti–CTLA-4 mAb on days 3, 6, and 9 after tumor inoculation. Corticosteroid administration was started on day 17 (n = 5–7). Data in B and F are mean + SE. Statistical analysis by Dunnett’s test; *, P < 0.05; ***, P < 0.001. These experiments were performed independently three times with similar results.
Figure 2.
Figure 2.
Early corticosteroid treatment reduces antitumor activity by anti–PD-L1 mAb. (A–C) Experimental schema (A) and tumor growth curves (B: mean; C: individual mice) of early corticosteroid treatment. BALB/c mice were inoculated with CT26-NY-ESO-1 and injected with anti–PD-L1 mAb on days 3, 6, and 9 after tumor inoculation. Corticosteroid administration was started on the same day of anti–PD-L1 mAb (n = 5–10). (D–F) Experimental schema (D) and tumor growth curves (E: mean; F: individual mice) of late corticosteroid treatment. BALB/c mice were inoculated with CT26-NY-ESO-1 and injected with anti–PD-L1 mAb on days 3, 6, and 9 after tumor inoculation. Corticosteroid administration was started on day 17 (n = 5 or 6). Data in B and E are mean + SE. Statistical analysis by Student’s t test; *, P < 0.05. These experiments were performed independently three times with similar results.
Figure 3.
Figure 3.
Early corticosteroid treatment impairs low-affinity memory T cell differentiation. (A–C) Experimental schema (A) and tumor growth curves (B: CMS5a-NY-ESO-1; C: CMS5a) of rechallenge to early corticosteroid-treated mice. CMS5a-NY-ESO-1–bearing mice were treated as in Fig. 1 A. Mice that had completely rejected the initial tumors were collected and secondarily inoculated with CMS5a-NY-ESO-1 and parental CMS5a (day 39). Control naive mice were injected with the same tumors (n = 5–10). (D) Gating strategy for flow-cytometric analysis of MPECs population in high-affinity (NY-ESO-1-tetramer+) and low-affinity (NY-ESO-1-tetramer) CD8+ T cells at 10 d after tumor inoculation. (E and F) Percentages of MPECs in high- (E) and low-affinity (F) CD8+ T cells (n = 5). L, low dose; H, high dose. (G) Expression of maturation markers on DCs (CD11c+MHC class II+CD8α+) in tumor-draining lymph nodes 10 d after tumor inoculation (n = 3). MFI, mean fluorescence intensity. (H) Cytokine production (IL-12p70) by DCs. DCs from draining lymph nodes in CMS5a-NY-ESO-1–bearing mice were stimulated with LPS overnight. Cytokine production was measured by ELISA (n = 3 or 4). Data in B, C, and H are mean + SE. Statistical analysis by Dunnett’s test; *, P < 0.05. These experiments were performed independently three times with similar results.
Figure 4.
Figure 4.
Corticosteroids compromise FAO in low-affinity but not high-affinity memory T cells. (A) Relative frequency of OVA tetramer+ cells. OT-I cells were stimulated with N4 (high-affinity) or Y3 (low-affinity) peptide, and treated with various concentrations of corticosteroids in vitro. Frequency of OVA tetramer+CD8+ T cells on day 7 was determined. The graph shows the percentage of OVA tetramer+ cells in CD8+ T cells in comparison with the control culture without corticosteroids (n = 3). (B) Quantitative analysis of TCR signaling. OT-I cells were stimulated with various concentrations of N4 or Y3 peptide for 3 h. Phosphorylation of ZAP-70 (left), ERK1/2 (middle), and JNK (right) was determined by flow cytometry (n = 5). MFI, mean fluorescence intensity. (C) Phosphorylation of GR. OT-I cells were stimulated with various concentrations of N4 or Y3 peptide for 3 h. Phosphorylation of GR was determined by flow cytometry (n = 5). (D) GSEA of fatty acid metabolism-related genes in Y3 stimulated OT-I cells relative to those treated with corticosteroids. (E) Heat map of expression of FAO-related genes. OT-I cells were stimulated with Y3 peptide and treated with corticosteroids in vitro for 4 d. mRNA expression was examined with microarray. (F) OCR of peptide-stimulated OT-I cells with etomoxir. OT-I cells were stimulated with N4 or Y3 peptide, and treated with various concentrations of corticosteroids in vitro for 4 d. FAO was determined with etomoxir by measuring OCR using extracellular flux analyzer (n = 5). (G) FAO-related mRNA expression in high- or low-affinity CD8+ T cells in CMS5a-NY-ESO-1 tumors at 10 d after tumor inoculation (n = 3). (H) FAO-associated mitochondrial membrane potential in high- or low-affinity CD8+ T cells in CMS5a-NY-ESO-1 tumors at 10 d after tumor inoculation (n = 4). Data in A–C and F–H are mean ± SD. Statistical analysis by Student’s t test; *, P < 0.05; **, P < 0.01; ***, P < 0.001. These experiments were performed independently three times with similar results.
Figure 5.
Figure 5.
Low-mutation burden and early corticosteroid administration in patients treated with anti–CTLA-4 mAb are associated with poor prognosis. (A) Kaplan–Meier curve for OS of 86 malignant melanoma patients treated with anti–CTLA-4 mAb. (B) Kaplan–Meier curves for OS by corticosteroid treatment; 7 wk (used steroids, n = 23, did not use steroids, n = 62, right) and 16 wk (used steroids, n = 38, did not use steroids, n = 42, left). (C–E) Kaplan–Meier curves for OS of corticosteroid-treated patients, classified on the basis of high (>22 mutations)/low (≤ 22 mutations)–mutation burdens determined by MSK-IMPACT, a next-generation sequencing technique that can identify alterations in 468 cancer-associated genes, to identify tumor mutation burden (C); any corticosteroid administration to patients with high-/low-mutation burdens (high-mutation/used corticosteroids, n = 15, high-mutation/not used corticosteroids, n = 10, low-mutation/used corticosteroids, n = 22, low-mutation/not used corticosteroids, n = 21; D), and early (≤7 wk)/late (>7 wk) corticosteroid administration to patients with high-/low-mutation burdens (high-mutation/early, n = 8, high-mutation/late, n = 7, low-mutation/early, n = 12, low-mutation/late, n = 10; E). (F) Representative computed tomography scans of early corticosteroid-treated patient with low-mutation burden before (left) and 14 wk after anti–CTLA-4 mAb treatment with evidence of new and progressive pulmonary metastases (right). Scale bars, 50 mm. (G) Representative positron emission tomography images of late corticosteroid-treated patient with high-mutation burden before (left) and 134 wk after anti–CTLA-4 mAb treatment (right). Statistical analysis by log-rank test.

References

    1. Ashwell J.D., Lu F.W., and Vacchio M.S.. 2000. Glucocorticoids in T cell development and function. Annu. Rev. Immunol. 18:309–345. 10.1146/annurev.immunol.18.1.309 - DOI - PubMed
    1. Barnes P.J., and Adcock I.M.. 2009. Glucocorticoid resistance in inflammatory diseases. Lancet. 373:1905–1917. 10.1016/S0140-6736(09)60326-3 - DOI - PubMed
    1. Butler M.O., Friedlander P., Milstein M.I., Mooney M.M., Metzler G., Murray A.P., Tanaka M., Berezovskaya A., Imataki O., Drury L., et al. . 2011. Establishment of antitumor memory in humans using in vitro-educated CD8+ T cells. Sci. Transl. Med. 3:. 10.1126/scitranslmed.3002207 - DOI - PMC - PubMed
    1. Callahan M.K., Postow M.A., and Wolchok J.D.. 2016. Targeting T Cell Co-receptors for Cancer Therapy. Immunity. 44:1069–1078. 10.1016/j.immuni.2016.04.023 - DOI - PubMed
    1. Chen D.S., and Mellman I.. 2017. Elements of cancer immunity and the cancer-immune set point. Nature. 541:321–330. 10.1038/nature21349 - DOI - PubMed

Publication types

MeSH terms