. 2019 Oct 7;218(10):3436-3454.
doi: 10.1083/jcb.201903109. Epub 2019 Sep 19.

A kindlin-3-leupaxin-paxillin signaling pathway regulates podosome stability

Affiliations

A kindlin-3-leupaxin-paxillin signaling pathway regulates podosome stability

Sarah Klapproth et al. J Cell Biol. .

Abstract

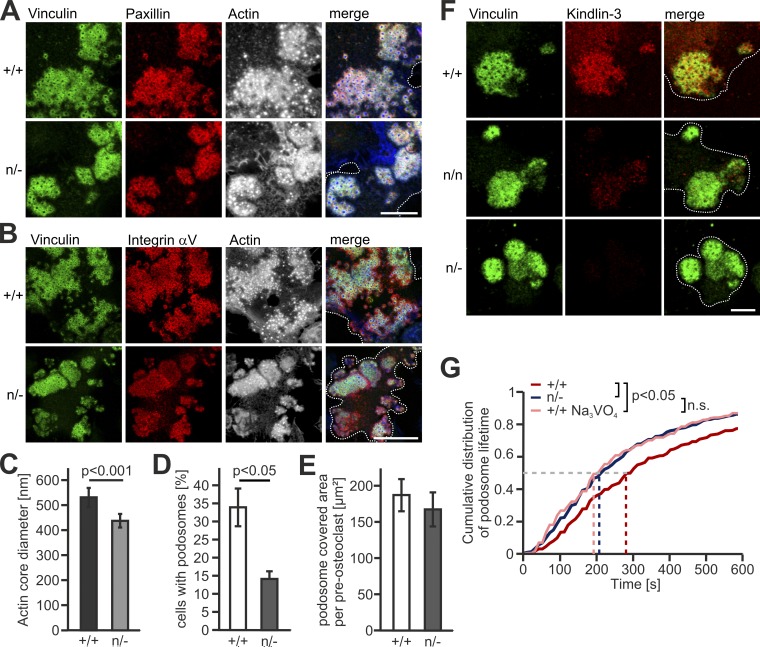
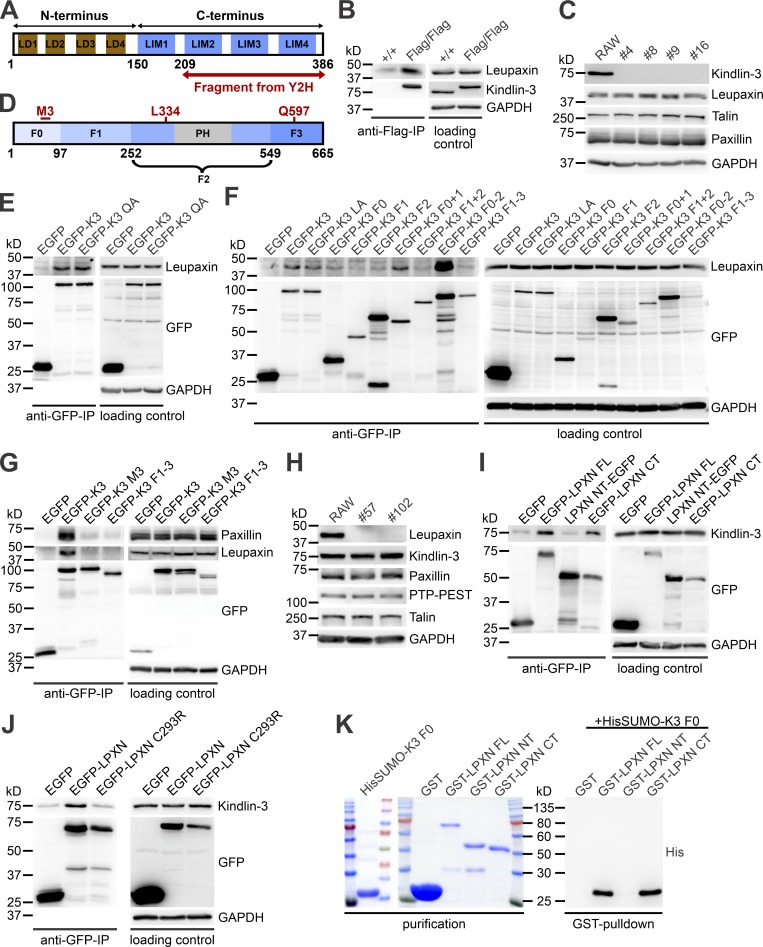
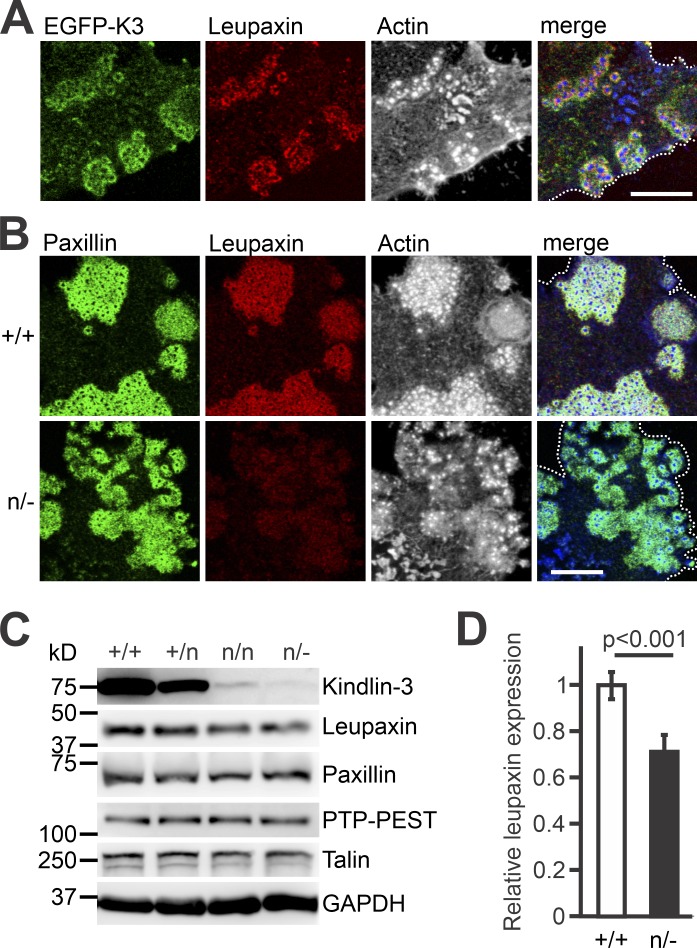
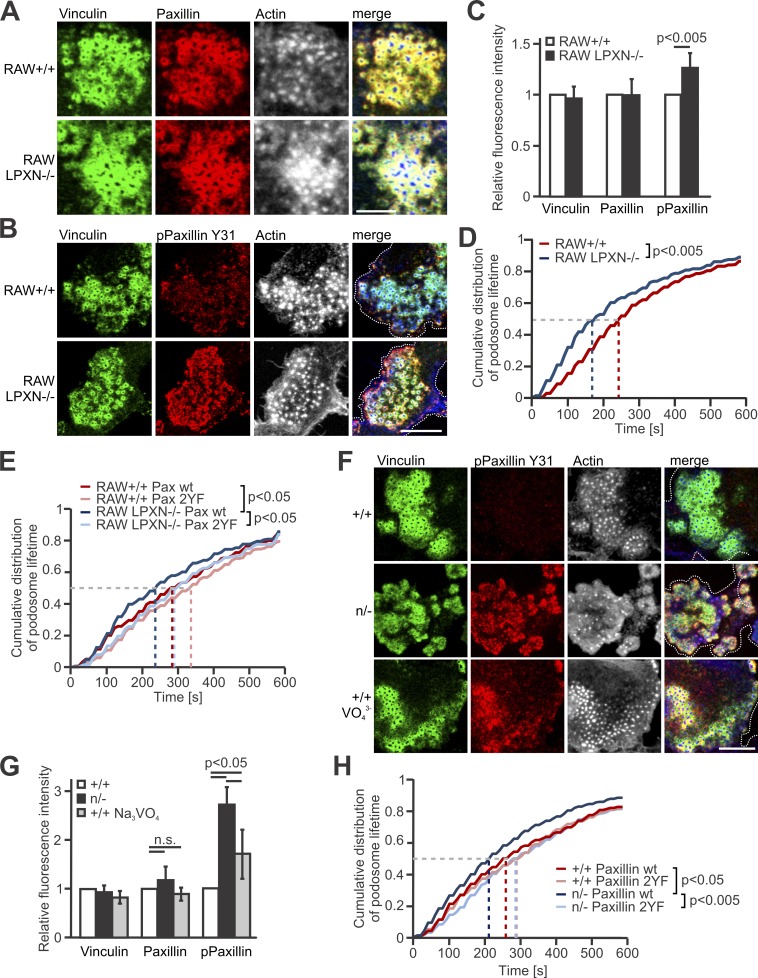
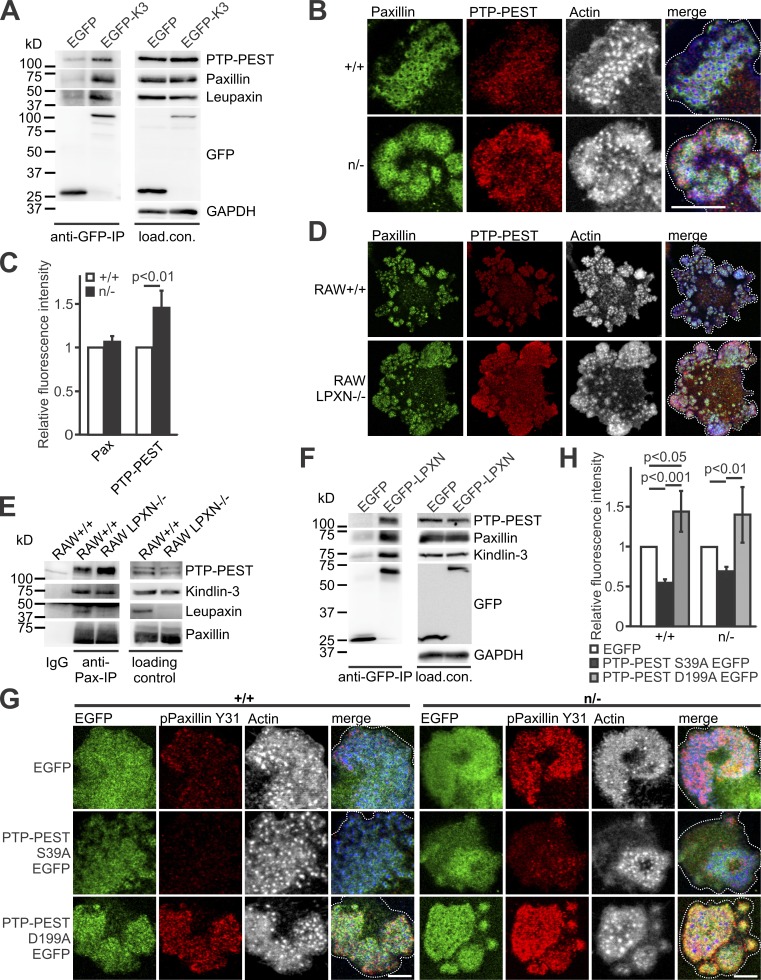
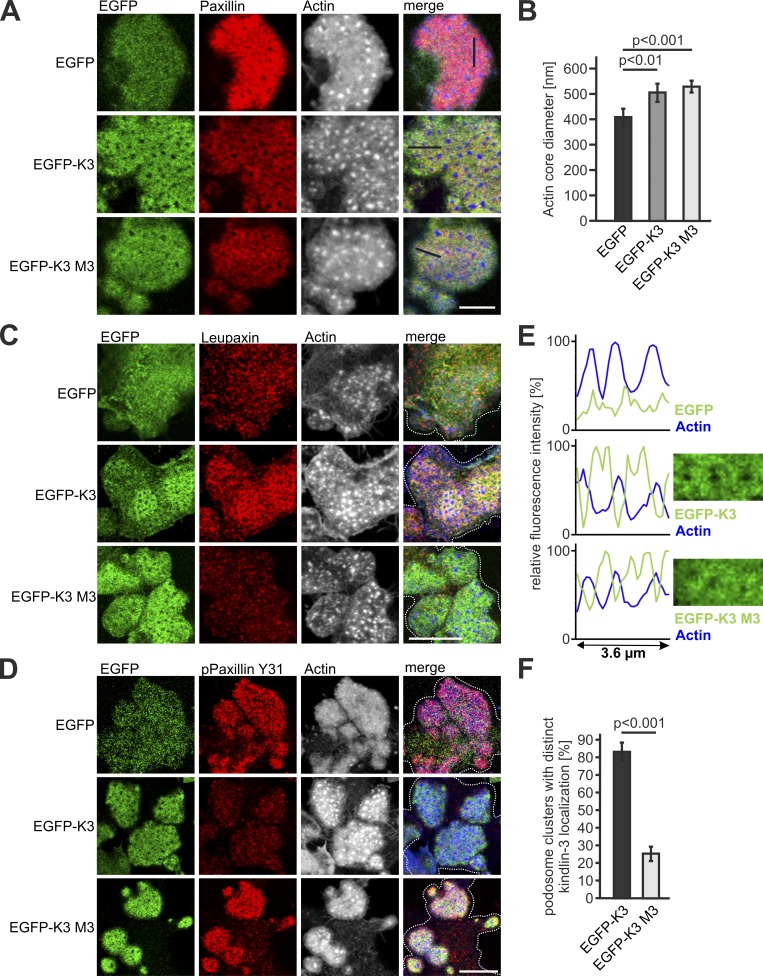
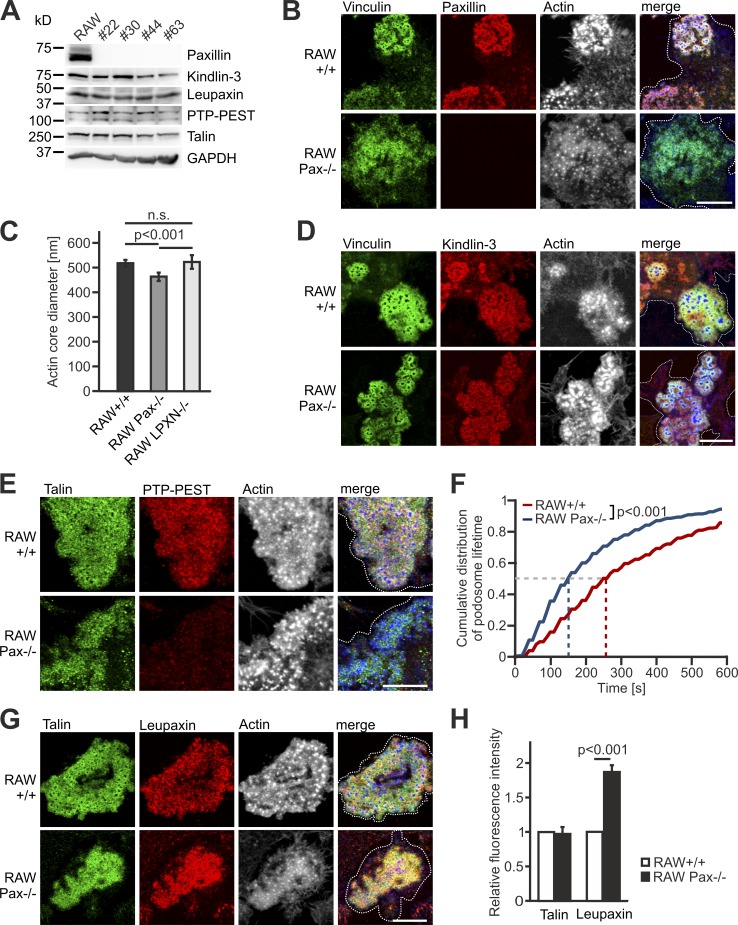
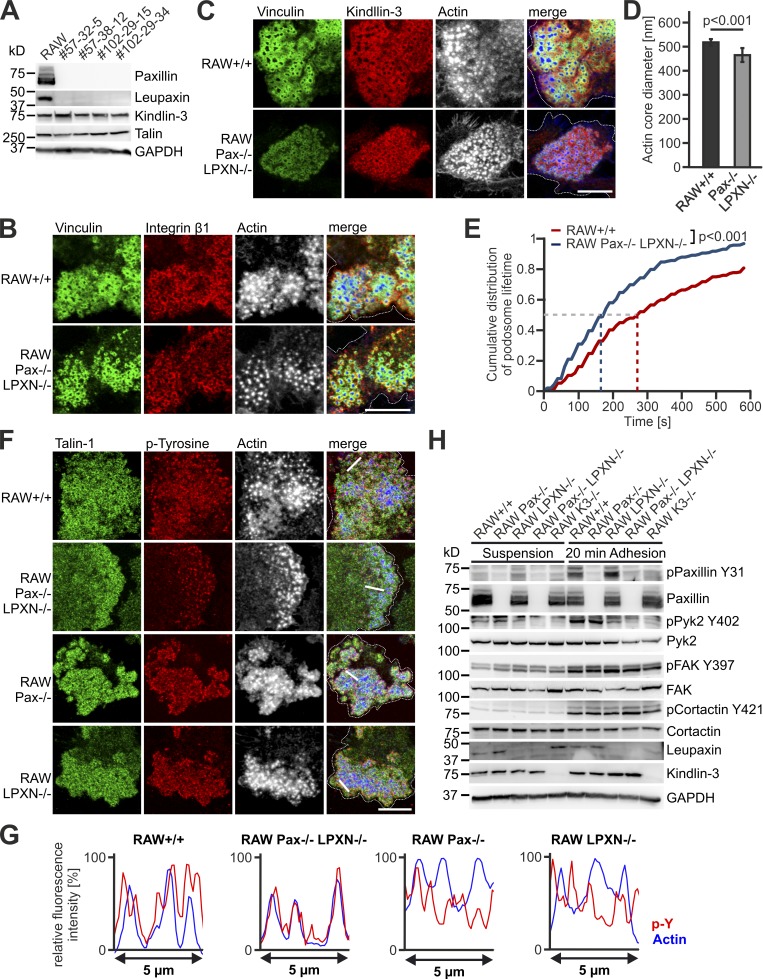
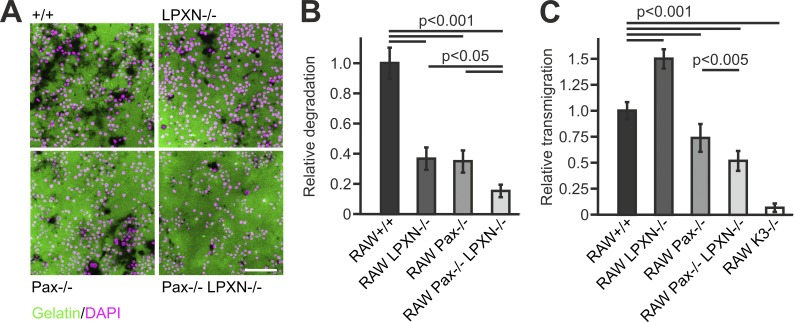
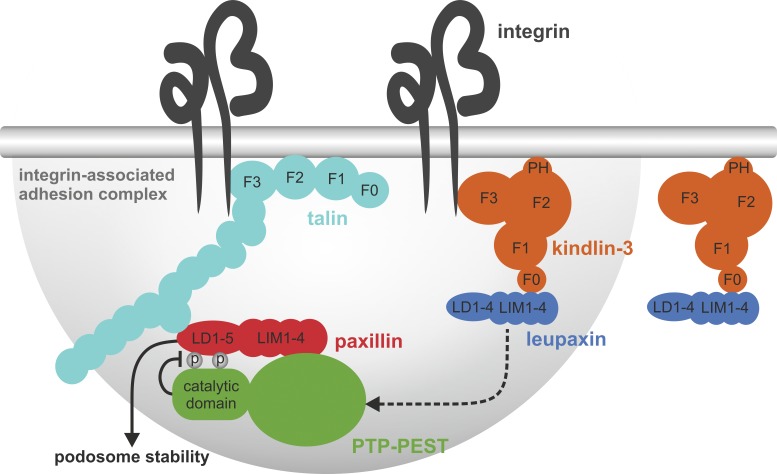
Binding of kindlins to integrins is required for integrin activation, stable ligand binding, and subsequent intracellular signaling. How hematopoietic kindlin-3 contributes to the assembly and stability of the adhesion complex is not known. Here we report that kindlin-3 recruits leupaxin into podosomes and thereby regulates paxillin phosphorylation and podosome turnover. We demonstrate that the activity of the protein tyrosine phosphatase PTP-PEST, which controls paxillin phosphorylation, requires leupaxin. In contrast, despite sharing the same binding mode with leupaxin, paxillin recruitment into podosomes is kindlin-3 independent. Instead, we found paxillin together with talin and vinculin in initial adhesion patches of kindlin-3-null cells. Surprisingly, despite its presence in these early adhesion patches, podosomes can form in the absence of paxillin or any paxillin member. In conclusion, our findings show that kindlin-3 not only activates and clusters integrins into podosomes but also regulates their lifetime by recruiting leupaxin, which controls PTP-PEST activity and thereby paxillin phosphorylation and downstream signaling.


Figures

Figure 1.
Figure 1.
Low kindlin-3 expression results in reduced podosome lifetime. (A) IF stainings of WT (+/+) and K3n/− (n/−) preosteoclasts for vinculin (green), paxillin (red) and actin (white/blue in merge). Scale bar, 10 µm. (B) IF stainings for vinculin (green), integrin αV (red), and actin (white/blue in merge) in podosomes of +/+ and n/− preosteoclasts. Scale bar, 20 µm. (C) Diameter of the podosomal actin cores in +/+ and n/− cells. 10 actin cores in two regions of three cells were measured per experiment. n = 5. (D) Percentage of podosome forming +/+ and n/− preosteoclasts. n = 4. (E) Quantification of the basal cell surface area that podosomal clusters cover in +/+ and n/− preosteoclasts. n = 48/50 from five different preparations. (F) Vinculin (green) and kindlin-3 (red) IF stainings of +/+ and n/− preosteoclasts. Scale bar, 5 µm. (G) Cumulative distribution of podosome lifetimes in +/+ untreated or treated with orthovanadate and n/− preosteoclasts. 15–20 podosomes were measured per cell. Two to five cells were analyzed in each of six different dishes per genotype. See also Videos 1 and 2. Dotted white lines mark cell borders.
Figure 2.
Figure 2.
Identification and characterization of leupaxin as new kindlin-3 interactor. (A) Domain structure of leupaxin. A C-terminal leupaxin fragment bound to kindlin-3 in a yeast-two-hybrid screen. (B) Flag-immunoprecipitation (IP) from lysates of +/+ and Flag-tagged kindlin-3 expressing (Flag/Flag) bone marrow–derived macrophages to verify interaction with endogenous leupaxin. (C) Western blot analyses of leupaxin, talin, and paxillin expression in +/+ RAW cells and four different K3−/− RAW cell clones. (D) Domain structure of kindlin-3. (E) GFP-IP from lysates of K3−/− RAW cells expressing EGFP, EGFP-K3, or the EGFP-tagged K3 QA mutant analyzed for leupaxin. (F) GFP-IP from lysates of K3−/− RAW cells expressing different EGFP-K3 fragments to identify the leupaxin-interacting domain. (G) GFP-IP from lysates of K3−/− RAW cells expressing EGFP, EGFP-K3, EGFP-K3 M3 mutant, or EGFP-K3 F1–3 to investigate the interaction with leupaxin and paxillin. (H) Western blot analyses of +/+ RAW cells and two leupaxin−/− RAW cell clones for their expression of kindlin-3, paxillin, PTP-PEST, and talin. (I) GFP-IP from lysates of leupaxin−/− RAW cells reconstituted with EGFP-tagged FL leupaxin (LPXN), a N-terminal fragment (NT), or its CT to determine interaction with kindlin-3. (J) GFP-IP from lysates of leupaxin−/− RAW cells reconstituted either with EGFP-tagged WT leupaxin or a leupaxin mutant (C293R) analyzed for kindlin-3 binding. (K) GST-pulldown with GST, GST-leupaxin FL, GST-leupaxin NT, and GST-leupaxin CT incubated with His-Sumo-tagged K3 F0.
Figure 3.
Figure 3.
Reduced kindlin-3 expression impairs leupaxin recruitment to podosomes. (A) IF staining of a K3−/− preosteoclast retrovirally transduced with EGFP-K3 (green), for leupaxin (red) and F-actin (white/blue in merge). (B) IF stainings of K3+/+ and K3n/− preosteoclasts for paxillin (green), leupaxin (red), and actin (white/blue in merge). (C) Western blot analyses on lysates of K3+/+, K3+/n, K3n/n, and K3n/− macrophages for leupaxin, paxillin, PTP-PEST, and talin expression. (D) Densitometric quantification of leupaxin expression in K3n/− macrophages relative to WT cells. All values were normalized to the corresponding GAPDH signal. n = 6. Scale bars, 10 µm. Dotted white lines mark cell borders.
Figure 4.
Figure 4.
Loss of leupaxin and reduced kindlin-3 expression result in increased podosomal paxillin phosphorylation and decreased podosome lifetime. (A) IF stainings of +/+ RAW cells and leupaxin−/− RAW cells for vinculin, (green), paxillin (red), and actin (white/blue in merge) Scale bar, 10 µm. (B) IF stainings of +/+ and leupaxin−/− RAW cells for vinculin (green), phospho-paxillin Y31 (red), and actin (white/blue in merge). Scale bar, 5 µm. (C) Quantification of vinculin, total paxillin, and phospho-paxillin Y31 recruitment to podosome clusters assessed by measuring fluorescence intensity (MFI) of confocal images. MFIs of +/+ cells were set to 1. In each independent experiment, five podosome regions in each of at least 10 cells were measured. n ≥ 6. (D) Cumulative distribution of podosome lifetime in +/+ and leupaxin−/− RAW cells. 10–30 podosomes were measured per cell. At least two cells were analyzed in each of eight independent experiments. (E) Control RAW cells and different clones of leupaxin−/− RAW cells were cotransfected with WT paxillin-Cherry or a non-phosphorylatable mutant paxillin-Cherry (paxillin 2YF) and LifeAct-GFP. Podosome lifetime was assessed and blotted as cumulative distribution. 10–30 podosomes were measured per cell. At least 2 cells were analyzed in each of 5 different dishes. (F) IF stainings of +/+ preosteoclasts untreated or treated with Na3VO4 and K3n/− preosteoclasts for phosphorylated paxillin (red). Vinculin (green) and actin (white/blue in merge) served as control stainings. Scale bar, 10 µm. (G) Quantification of the recruitment of vinculin, paxillin and phospho-paxillin Y31 to podosome clusters of +/+ preosteoclasts untreated or treated with Na3VO4 and K3n/− preosteoclasts by measuring MFI of confocal images. MFIs of untreated +/+ cells were set to 1. At least five podosome regions in each of at least 10 cells were measured per experiment. n ≥ 5. (H) Control and K3n/− preosteoclasts were transfected with LifeAct-GFP, left untreated or treated with Na3VO4, or cotransfected with WT paxillin-Cherry or a nonphosphorylatable mutant paxillin-Cherry (paxillin 2YF). The cells were imaged for 10 min with a 15-s time interval. Podosome lifetime was assessed and blotted as cumulative distribution. 10–30 podosomes were measured per cell. Two to five cells were analyzed per condition in each of six different dishes. Dotted white lines mark cell borders.
Figure 5.
Figure 5.
Dephosphorylation of paxillin by PTP-PEST depends on kindlin-3–mediated recruitment of leupaxin into podosomes. (A) GFP-IP from K3−/− RAW cells, retrovirally transduced with GFP alone or a N-terminally GFP-tagged kindlin-3 analyzed for leupaxin, paxillin, and PTP-PEST. (B) IF staining of +/+ and n/− preosteoclasts for paxillin (green), PTP-PEST (red), and actin (white/blue in merge). Scale bar, 10 µm. (C) IF stainings shown in B were quantified by measuring fluorescence intensity. Values from WT cells were set to 1. In each independent experiment, five podosome regions in each of at least 10 cells were measured. n = 5. (D) Control and leupaxin−/− RAW cells stained for paxillin (green), PTP-PEST (red), and actin (white/blue in merge). Scale bar, 20 µm. (E) IP using a mouse–anti-paxillin antibody or an IgG control with lysates from +/+ and leupaxin−/− RAW cells. Binding of PTP-PEST, kindlin-3, and leupaxin was tested. (F) GFP-IP from lysates of leupaxin−/− RAW cells, retrovirally transduced with GFP alone or a N-terminally GFP-tagged leupaxin analyzed for kindlin-3, paxillin, and PTP-PEST. (G) Control and n/− preosteoclasts lentivirally transduced with EGFP, PTP-PEST S39A EGFP, or PTP-PEST D199A EGFP and stained for paxillin phosphorylated at Y31 (red) and actin (white/blue in merge). Scale bars, 5 µm. (H) Quantification of paxillin phosphorylation levels observed in G. n = 5. Dotted white lines mark cell borders.
Figure 6.
Figure 6.
Leupaxin-binding mutant kindlin-3 fails to recruit leupaxin to podosomes and to reduce paxillin phosphorylation. (A, C, and D) IF staining and confocal imaging of K3−/− preosteoclasts retrovirally transduced with EGFP, WT EGFP-K3, or the EGFP-K3 M3 mutant (green) for paxillin (red, A), leupaxin (red, C), and phospho-paxillin Y31 (red, D) and actin (white/blue in merge). Scale bars, 5 µm (A) and 10 µm (C and D). (B) Actin core diameter of K3−/− preosteoclasts expressing EGFP, EGPF-K3, or the EGFP-K3 M3 mutant. 10 actin cores in two regions of three to five cells were measured per experiment. n = 5. (E) Fluorescence intensity profile through three actin-cores (indicated by the black lines in A) of K3−/− preosteoclasts expressing EGFP, WT EGPF-K3, or the EGFP-K3 M3 mutant. (F) Percentage of cells with podosome clusters, which reveal discrete localization of EGFP-K3 and EGFP-K3 M3 in the podosomal ring. 50 cells were evaluated per condition in each of three independent experiments. Dotted white lines mark cell borders.
Figure 7.
Figure 7.
Paxillin-deficient cells form podosomes with smaller actin cores and strongly reduced lifetime. (A) Kindlin-3, leupaxin, PTP-PEST, and talin expression in +/+ RAW cells and four different paxillin−/− RAW cell clones analyzed by Western blotting. (B) IF stainings of +/+ and paxillin−/− RAW cells for vinculin (green), paxillin (red), and actin (white/blue in merge). (C) Diameter of the podosome actin cores in +/+, paxillin−/−, and leupaxin−/− RAW cells. 10 actin cores in two regions of five to eight cells were measured in each experiment. n = 10/6/7. (D) IF stainings for vinculin (green), kindlin-3 (red), and actin (white/blue in merge) on +/+ and paxillin−/− RAW cells. (E) IF stainings for talin (green), PTP-PEST (red) and actin (white/blue in merge) on +/+ and paxillin−/− RAW cells. (F) Control RAW cells and different clones of paxillin−/− RAW cells were transfected with LifeAct-GFP and imaged at a spinning disc microscope for 10 min with a 15-s time interval. The cumulative distribution of these measurements is shown. 10–30 podosomes were measured per cell. At least four cells were analyzed in each of six independent experiments. (G) Confocal images of talin (green), leupaxin (red), and actin (white/blue in merge) IF stainings of +/+ and paxillin−/− RAW cells. (H) IF stainings shown in G were quantified by measuring fluorescence intensity. Values from WT cells were set to 1. In each independent experiment, five podosome regions in each of at least 10 cells were measured. n = 4. Scale bars, 10 µm. Dotted white lines mark cell borders.
Figure 8.
Figure 8.
Characterization of podosomes from paxillin/leupaxin double deficient RAW cells. (A) Western blot analyses of +/+ RAW cells and four different clones of paxillin/leupaxin dKO RAW cells for their expression of kindlin-3 and talin. (B and C) IF stainings of +/+ and paxillin/leupaxin dKO RAW cells for vinculin (green), integrin β1 (red, B), kindin-3 (red, C) and actin (white/blue in merge). (D) Diameter of the podosome actin cores in +/+ and paxillin/leupaxin dKO RAW cells. 10 actin cores in two regions of five to eight cells were measured in each experiment. n = 9/7. (E) Control RAW cells and different clones of paxillin/leupaxin dKO RAW cells were transfected with LifeAct-GFP and imaged at a spinning disc microscope for 10 min with a 15-s time interval. The cumulative distribution of these measurements is shown. 20 podosomes were measured per cell. At least four cells were analyzed in each of six dishes. (F) IF stainings for talin (green), tyrosine-phosphorylated proteins (red) and actin (white/blue in merge) on +/+, paxillin/leupaxin dKO, paxillin−/− and leupaxin−/− RAW cells. (G) Fluorescence intensity profiles of actin (blue) and phospho-tyrosine (p-Y; red) through three actin cores (indicated by the white lines in E) of +/+, paxillin/leupaxin dKO, paxillin−/−, and leupaxin−/− RAW cells. (H) Western blot analyses of the phosphorylation status of paxillin, Pyk2, FAK and cortactin in +/+, paxillin−/−, leupaxin−/−, K3−/− and paxillin/leupaxin dKO RAW cells kept in suspension or adherent to fibronectin. Scale bars, 10 µm. Dotted white lines mark cell borders.
Figure 9.
Figure 9.
Loss of leupaxin and/or paxillin affect matrix degradation and cell migration. (A) IF images of DAPI-stained (magenta) +/+, leupaxin−/−, paxillin−/−, and paxillin/leupaxin dKO RAW cells seeded on Oregon Green 488–labeled gelatin (green) for 24 h. Scale bar, 100 µm. (B) Relative degradation capacity (area of degraded collagen normalized by number of nuclei) quantified from images shown in A. (C) Migration of these and K3−/− RAW cells in relation to +/+ cells assessed by Transwell assays.
Figure 10.
Figure 10.
A kindlin-3/leupaxin complex regulates paxillin tyrosine phosphorylation and podosome stability. Kindlin-3/leupaxin interaction is independent of integrin binding. However, kindlin-3 targets leupaxin into the podosome adhesion complex. In contrast, paxillin recruitment to podosomes occurs independent of kindlin-3. The recruitment of leupaxin into podosomes enables the tyrosine phosphatase PTP-PEST to dephosphorylate paxillin at Y31 and Y118, resulting in increased podosome lifetime and stability. PH, pleckstrin homology domain.

Comment in

Similar articles

Cited by

References

    1. Angers-Loustau A., Côté J.F., Charest A., Dowbenko D., Spencer S., Lasky L.A., and Tremblay M.L.. 1999. Protein tyrosine phosphatase-PEST regulates focal adhesion disassembly, migration, and cytokinesis in fibroblasts. J. Cell Biol. 144:1019–1031. 10.1083/jcb.144.5.1019 - DOI - PMC - PubMed
    1. Azimifar S.B., Böttcher R.T., Zanivan S., Grashoff C., Krüger M., Legate K.R., Mann M., and Fässler R.. 2012. Induction of membrane circular dorsal ruffles requires co-signalling of integrin-ILK-complex and EGF receptor. J. Cell Sci. 125:435–448. 10.1242/jcs.091652 - DOI - PubMed
    1. Badowski C., Pawlak G., Grichine A., Chabadel A., Oddou C., Jurdic P., Pfaff M., Albigès-Rizo C., and Block M.R.. 2008. Paxillin phosphorylation controls invadopodia/podosomes spatiotemporal organization. Mol. Biol. Cell. 19:633–645. 10.1091/mbc.e06-01-0088 - DOI - PMC - PubMed
    1. Ballestrem C., Erez N., Kirchner J., Kam Z., Bershadsky A., and Geiger B.. 2006. Molecular mapping of tyrosine-phosphorylated proteins in focal adhesions using fluorescence resonance energy transfer. J. Cell Sci. 119:866–875. 10.1242/jcs.02794 - DOI - PubMed
    1. Betz U.A., Vosshenrich C.A., Rajewsky K., and Müller W.. 1996. Bypass of lethality with mosaic mice generated by Cre-loxP-mediated recombination. Curr. Biol. 6:1307–1316. 10.1016/S0960-9822(02)70717-3 - DOI - PubMed

Publication types