. 2019 Sep 19;10(1):4270.
doi: 10.1038/s41467-019-12077-w.

Transcription-dependent targeting of Hda1C to hyperactive genes mediates H4-specific deacetylation in yeast

Affiliations

Transcription-dependent targeting of Hda1C to hyperactive genes mediates H4-specific deacetylation in yeast

So Dam Ha et al. Nat Commun. .

Abstract

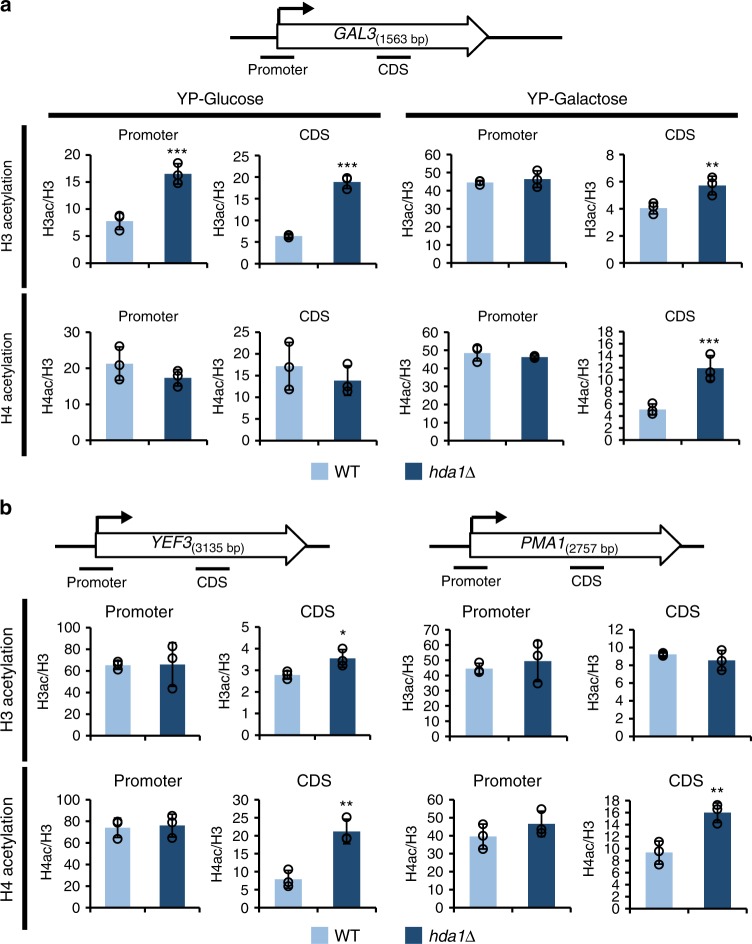
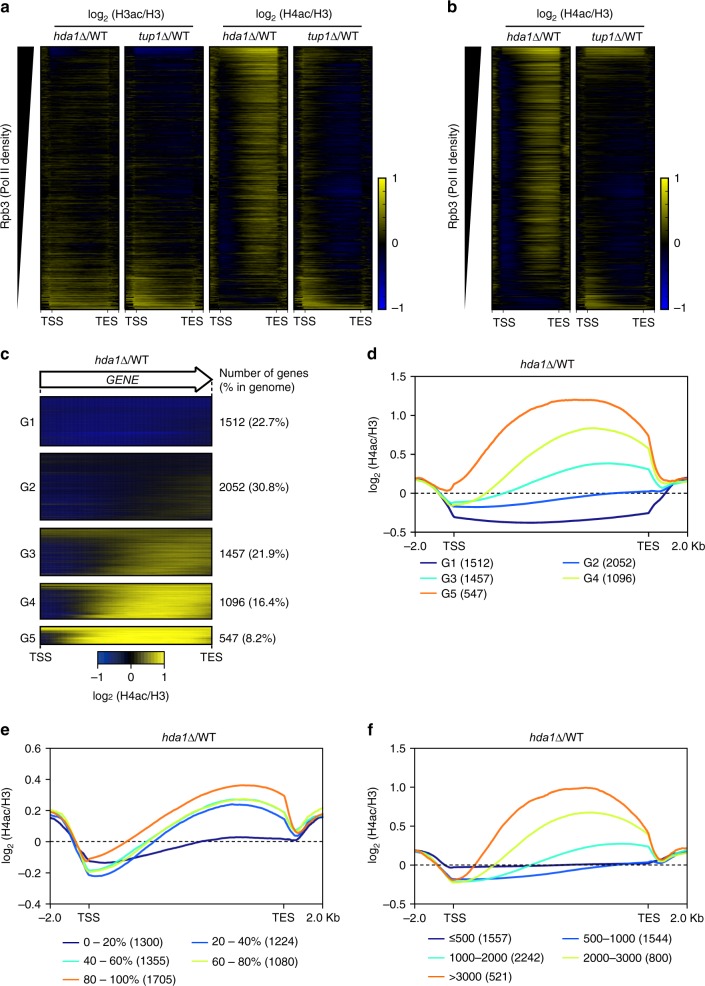
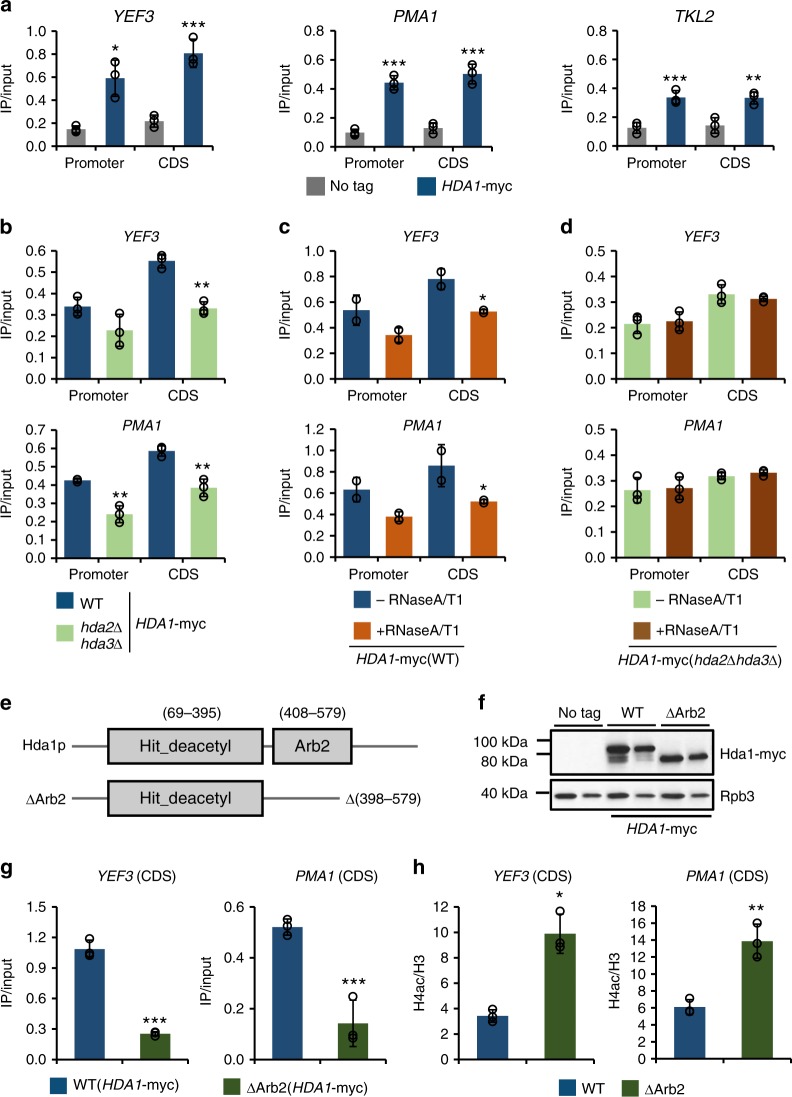
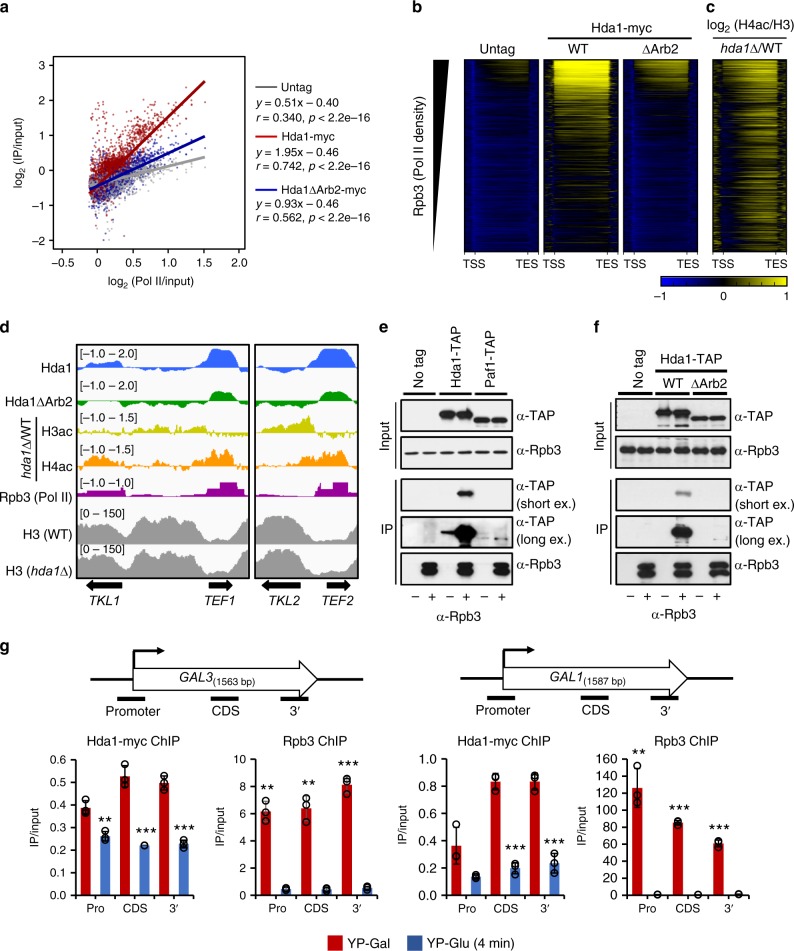
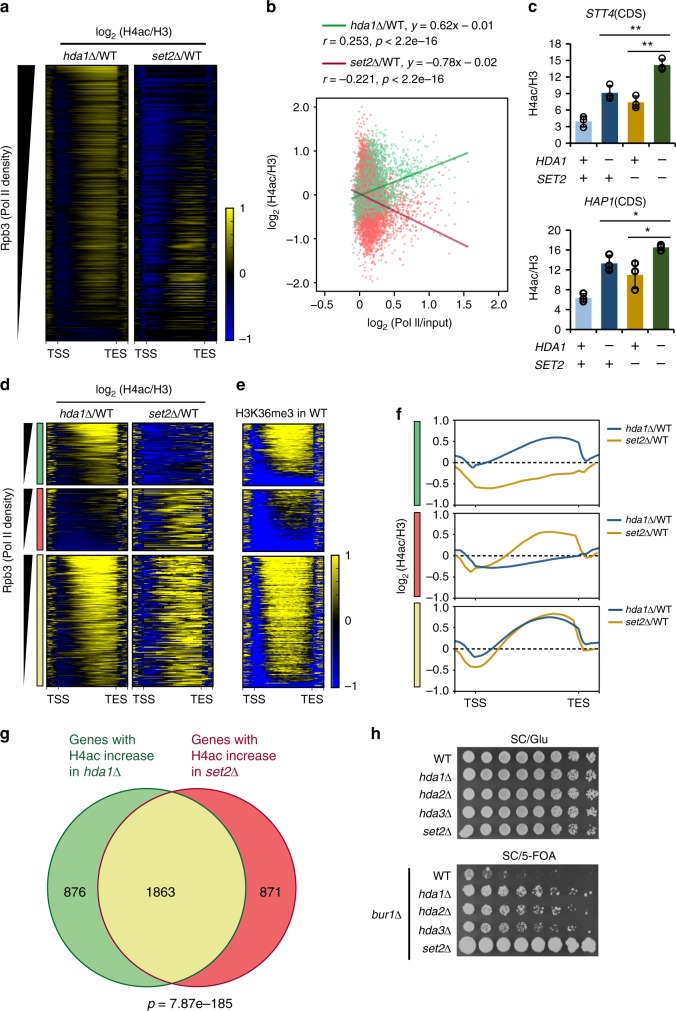
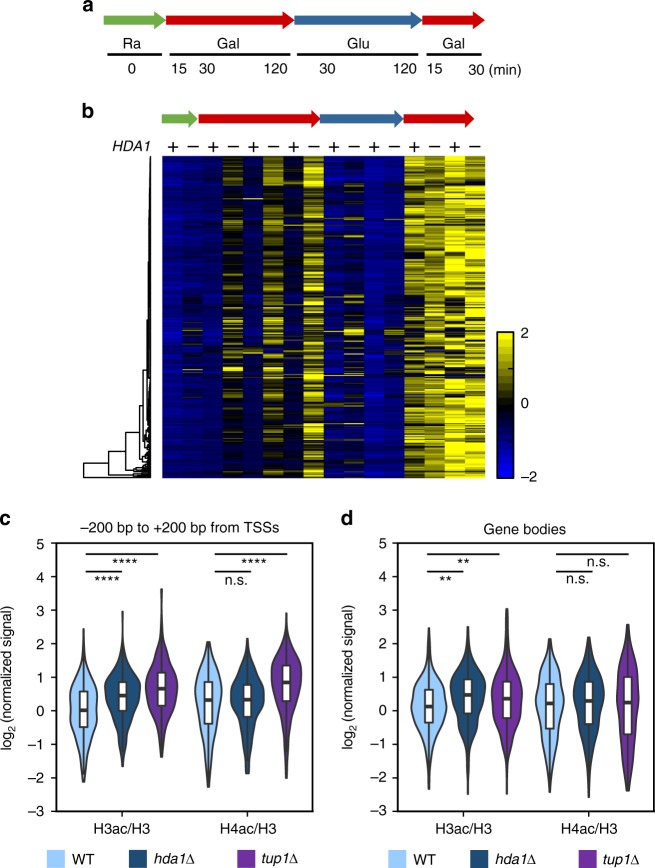
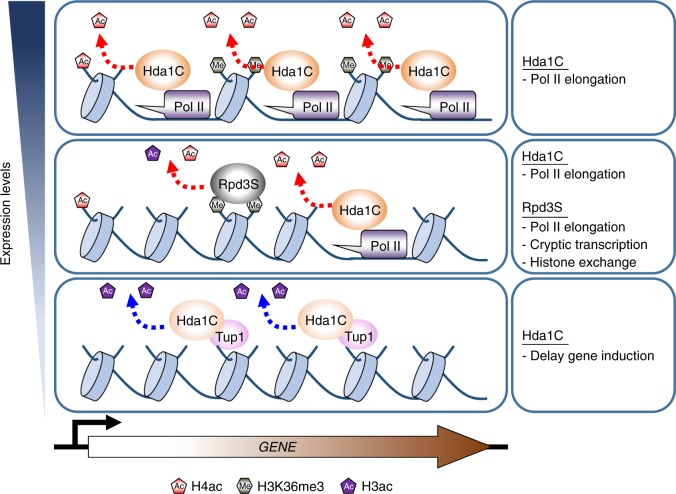
In yeast, Hda1 histone deacetylase complex (Hda1C) preferentially deacetylates histones H3 and H2B, and functionally interacts with Tup1 to repress transcription. However, previous studies identified global increases in histone H4 acetylation in cells lacking Hda1, a component of Hda1C. Here, we find that Hda1C binds to hyperactive genes, likely via the interaction between the Arb2 domain of Hda1 and RNA polymerase II. Additionally, we report that Hda1C specifically deacetylates H4, but not H3, at hyperactive genes to partially inhibit elongation. This role is contrast to that of the Set2-Rpd3S pathway deacetylating histones at infrequently transcribed genes. We also find that Hda1C deacetylates H3 at inactive genes to delay the kinetics of gene induction. Therefore, in addition to fine-tuning of transcriptional response via H3-specific deacetylation, Hda1C may modulate elongation by specifically deacetylating H4 at highly transcribed regions.


Conflict of interest statement

The authors declare no competing interests.

Figures

Fig. 1
Fig. 1
Hda1C preferentially deacetylates histone H4 at actively transcribed genes. a Hda1C specifically deacetylates histone H4 at active GAL3-coding regions. Crosslinked chromatin from the indicated strains grown in YP-Glucose (YPD) or YP-Galactose was precipitated with an anti-H3, anti-acetyl H3, or anti-acetyl H4 antibody as indicated. PCR analysis of the precipitated DNA was carried out on the promoter and coding regions of GAL3. A non-transcribed region located close to the telomere of chromosome VI was used as an internal control. The signals for acetyl H3 and acetyl H4 were quantitated and normalized to the total H3 signal. Error bars show the standard deviation calculated from three biological replicates, each with three technical replicates. **p < 0.01 and ***p < 0.001 (two-tailed unpaired Student’s t tests). b Hda1C deacetylates histone H4 at coding regions of the actively transcribed genes YEF3 and PMA1. Crosslinked chromatin from the indicated strains grown in YPD was precipitated with an anti-H3 or anti-acetyl H4 antibody as indicated, and a ChIP assay was performed as in a. Error bars show the standard deviation calculated from three biological replicates, each with three technical replicates. *p < 0.05 and **p < 0.01 (two-tailed unpaired Student’s t tests). Source data are provided as a Source Data file
Fig. 2
Fig. 2
Actively transcribed long genes are preferentially deacetylated by Hda1C. a Hda1, but not Tup1, deacetylates histone H4 within coding regions. Heatmaps of H3 and H4 acetylation levels calculated as the log2 fold change in hda1∆ or tup1∆ cells versus wild-type cells from two independent ChIP-seq experiments. All genes are sorted by descending order of Rpb3 occupancy from Mayer et al.. The y axis indicates each gene and the x axis indicates relative position to the transcription start site (TSS) and transcription end site (TES). b Confirmation of H4-specific deacetylation by Hda1C. Heatmaps of H4 acetylation levels calculated as in a from two independent ChIP-seqs including S. pombe chromatin as spike-in controls. All genes are sorted by descending order of Rpb3 occupancy. The y axis indicates each gene and the x axis indicates relative position to the transcription start site (TSS) and transcription end site (TES). c Heatmaps of H4 acetylation patterns for five gene groups identified by K-mean clustering using ChIP-seq data from b. The number of genes and % in genome are indicated on the right. d Average plot of the data shown in c. The x axis indicates relative position to the transcription start site (TSS) and transcription end site (TES). The number of genes is indicated in the parenthesis. e Actively transcribed genes exhibit a marked increase in H4 acetylation upon deletion of HDA1. Average plot of histone acetylation patterns based on RNA Pol II occupancy (Rpb3). The “0–20%” group includes genes showing the lowest Rpb3 occupancy and the “80–100%” group includes genes with the highest level of Rpb3 binding. f Longer genes show a larger increase in H4 acetylation than shorter genes upon deletion of HDA1. The plot shows average histone acetylation patterns grouped by gene length
Fig. 3
Fig. 3
The Arb2 domain of Hda1 is required for its binding to chromatin. a Hda1 binds strongly to active genes. Crosslinked chromatin from untagged control (HDA1) or HDA1-myc cells grown in YP-Glucose (YPD) was precipitated with an anti-myc antibody. PCR analysis of the precipitated DNA was carried out on the promoters and coding regions of the indicated genes. A non-transcribed region near the telomere of chromosome VI was used as an internal control. The signals for anti-myc were quantitated and normalized to the input signal. Error bars show the standard deviation calculated from three biological replicates, each with three technical replicates. *p < 0.05, **p < 0.01, and ***p < 0.001 (two-tailed unpaired Student’s t tests). b Hda2 and Hda3 partially affect Hda1 recruitment. ChIP assays using the indicated strains were performed as in a. Error bars show the standard deviation calculated from three biological replicates, each with three technical replicates. **p < 0.01 (two-tailed unpaired Student’s t tests). c RNA removal partially reduces Hda1 occupancy. Crosslinked chromatin from cells expressing Hda1-myc was treated with or without RNaseA/T1 and precipitated with an anti-myc antibody. The PCR analysis was performed as in a. *p < 0.05 (two-tailed unpaired Student’s t tests). d RNA removal has no effect on Hda1 occupancy in hda2∆hda3∆ mutant. Crosslinked chromatin from the indicated strain was treated with or without RNaseA/T1 and precipitated with an anti-myc antibody. The PCR analysis was performed as in a. Error bars show the standard deviation calculated from three biological replicates, each with three technical replicates. e Schematic representation of the Hda1 protein showing the HDAC domain (Hit_deacetyl; N terminus) and the Arb2 domain (C terminus). The Arb2 domain was deleted at the genomic HDA1 locus in the Arb2 strain. f Loss of the Arb2 domain partially reduces Hda1 protein levels. Total extracts from the indicated strains grown in YPD were separated by SDS-PAGE and probed with the indicated antibodies. Rpb3 was used as a loading control. g The Arb2 domain is required for Hda1 binding to chromatin. ChIP assay using the indicated strains was done as in a. Error bars show the standard deviation calculated from three biological replicates, each with three technical replicates. ***p < 0.001 (two-tailed unpaired Student’s t tests). h Loss of the Arb2 domain increases H4 acetylation. ChIP assay using the indicated strains was performed as in Fig. 1b. Error bars show the standard deviation calculated from three biological replicates, each with three technical replicates. *p < 0.05 and **p < 0.01 (two-tailed unpaired Student’s t tests). Source data are provided as a Source Data file
Fig. 4
Fig. 4
Transcription-dependent binding of Hda1C to active coding regions. a Hda1 binds to hyperactive genes. Scatterplot of Hda1 occupancy from two independent ChIP-seqs including S. pombe chromatin as spike-in controls in untagged (gray), Hda1-myc wild-type (red), and Hda1-myc (Arb2) (blue) cells, plotted against Rpb3 levels (relative Pol II). Pearson’s correlation coefficients are indicated. b Hda1 occupancies for the top 25% of highly transcribed genes (1705 genes) from two independent ChIP-seqs including S. pombe chromatin as spike-in control. The genes were sorted in descending order of Rpb3 occupancy in wild-type cells. The y axis indicates each gene and the x axis indicates relative position to the transcription start site (TSS) and transcription end site (TES). c Histone acetylation patterns of the genes shown in b. d ChIP-seq tracks at active genes, TKL1, TEF1, and TEF2, and an inactive gene, TKL2 showing the signals for Hda1 occupancy, H4 acetylation levels, H3 acetylation levels, Rpb3 occupancy, or histone H3 occupancy. e Hda1 interacts with Rpb3. Total extracts prepared from the indicated strains were incubated with an anti-Rpb3 antibody and protein G beads. The precipitates (IP) were analyzed by immunoblotting for TAP-tagged proteins (TAP) and Rpb3. Two independent experiments showed the same results. f The Arb2 domain is important for the interaction between Hda1 and Rpb3. Co-immunoprecipitation assay using the indicated strains was done as in e. Two independent experiments showed the same results. g Transcription-dependent Hda1C binding to GAL genes. The cells were grown in YP-Galactose (red) and then shifted to YP-Glucose for 4 min (blue). ChIP analyses of GAL3 and GAL1 were performed using anti-Rpb3 or anti-myc antibodies, as in Fig. 3a. Error bars show the standard deviation calculated from three biological replicates, each with three technical replicates. **p < 0.01 and ***p < 0.001 (two-tailed unpaired Student’s t tests). Source data are provided as a Source Data file
Fig. 5
Fig. 5
Hda1C and Set2 differentially affect H4 acetylation within coding regions. a Heatmaps of H4 acetylation patterns in hda1∆ (6664 genes) and set2∆ (5648 genes) cells. The plots show the log2 fold changes in H4 acetylation in hda1∆ (from Fig. 2b) or set2∆ cells versus wild-type cells. All genes are sorted by descending order of Rpb3 occupancy. The y axis indicates each gene and the x axis indicates relative position to the transcription start site (TSS) and transcription end site (TES). Histone acetylation patterns of set2∆ were analyzed using the data set from Venkatesh et al.. b H4 deacetylation by Hda1, but not Set2, correlates with RNA Pol II occupancy. Scatterplot showing the relationship between H4 acetylation changes in hda1∆ or set2∆ cells and Rpb3 occupancy. Pearson’s correlation coefficients are indicated. c Dual loss of Hda1 and Set2 increases H4 acetylation further. A ChIP assay using the indicated strains was performed as in Fig. 1b. *p < 0.05 and **p < 0.01 (two-tailed unpaired Student’s t tests). Source data are provided as a Source Data file. d Genes displaying H4 hyperacetylation in the hda1∆ or set2∆ cells were divided into three groups: Hda1-specific (green), Set2-specific (red), and common (yellow) genes. Heatmaps of H4 acetylation patterns are shown as in a. The y axis indicates each gene and the x axis indicates relative position to the transcription start site (TSS) and transcription end site (TES). e Heatmap of H3K36me3 patterns in the three groups shown in d. The y axis indicates each gene and the x axis indicates relative position to the transcription start site (TSS) and transcription end site (TES). H3K36me3 patterns were analyzed using the data set from Weiner et al.. f Average plots of H4 acetylation patterns in the three groups shown in d. g Venn diagram of the three groups described in d. The significance of the overlap was calculated using Fisher’s exact test. h Loss of Hda1C bypasses the requirement of Bur1, a positive elongation factor. BUR1 plasmid shuffling strains harboring the indicated deletions were spotted in threefold dilutions onto a synthetic complete (SC)/Glu plate (shown after 2 days) or a SC/5-FOA plate (shown after 8 days). The set2∆ mutant was used as a positive control
Fig. 6
Fig. 6
H3 deacetylation by Hda1C fine-tunes the kinetics of gene induction. a Schematic representation of the time-course experiments to monitor gene expression changes in wild-type and hda1∆ cells during carbon source shifts. Ra, raffinose; Gal, galactose; Glu, glucose. RNA samples were collected at the indicated time-points. b Hda1C negatively regulates the kinetics of gene induction. RNA samples from the time-course experiments described in a were analyzed by strand-specific RNA-sequencing. The ratios of transcript levels for 331 genes in hda1∆ versus wild-type cells are shown. Hda1-repressed genes were identified as those showing at least a 1.7-fold increase in transcript levels at one or more time-points. c, d Hda1C preferentially deacetylates histone H3 at inducible genes. Average profiles of H3 and H4 acetylation changes upon deletion of HDA1 or TUP1 around the transcription start sites (TSSs; −200 bp to +200 bp) (c) and within gene bodies (d) of the Hda1-repressed genes. Significance levels were computed by permutation tests. **p < 0.01 and ****p < 1.0 × 10−10
Fig. 7
Fig. 7
Model for the regulation of histone acetylation by Hda1C. At hyperactive genes, Hda1C strongly interacts with RNA Pol II to specifically deacetylate histone H4 within coding regions. Deacetylation of H4 by Hda1C may inhibit RNA Pol II elongation. At genes transcribing at intermediate levels, both Hda1C and Rpd3S promote histone deacetylation. When a gene is currently transcribing, Hda1C interacting with RNA Pol II may deacetylate histone H4. When a gene is not being transcribed, or once RNA Pol II passes, recognition of H3K36me3 by the Eaf3 chromodomain of Rpd3S may result in deacetylation of the remaining acetylated histones. Both Hda1C and Rpd3S may negatively affect elongation. In addition, Rpd3S inhibits initiation from cryptic promoters and suppresses histone exchange. At inactive or inducible genes, Hda1C preferentially deacetylates histone H3 to delay the kinetics of gene induction

References

    1. Kouzarides T. Chromatin modifications and their function. Cell. 2007;128:693–705. doi: 10.1016/j.cell.2007.02.005. - DOI - PubMed
    1. Li B, Carey M, Workman JL. The role of chromatin during transcription. Cell. 2007;128:707–719. doi: 10.1016/j.cell.2007.01.015. - DOI - PubMed
    1. Woo H, Dam HaS, Lee SB, Buratowski S, Kim T. Modulation of gene expression dynamics by co-transcriptional histone methylations. Exp. Mol. Med. 2017;49:e326. doi: 10.1038/emm.2017.19. - DOI - PMC - PubMed
    1. Lee BB, et al. Rpd3L HDAC links H3K4me3 to transcriptional repression memory. Nucleic Acids Res. 2018;46:8261–8274. doi: 10.1093/nar/gky573. - DOI - PMC - PubMed
    1. McKnight JN, Boerma JW, Breeden LL, Tsukiyama T. Global promoter targeting of a conserved lysine deacetylase for transcriptional shutoff during quiescence entry. Mol. Cell. 2015;59:732–743. doi: 10.1016/j.molcel.2015.07.014. - DOI - PMC - PubMed

Publication types

MeSH terms