. 2019 Sep 19;10(1):4276.
doi: 10.1038/s41467-019-12152-2.

NPC1 regulates ER contacts with endocytic organelles to mediate cholesterol egress

Affiliations

NPC1 regulates ER contacts with endocytic organelles to mediate cholesterol egress

D Höglinger et al. Nat Commun. .

Abstract

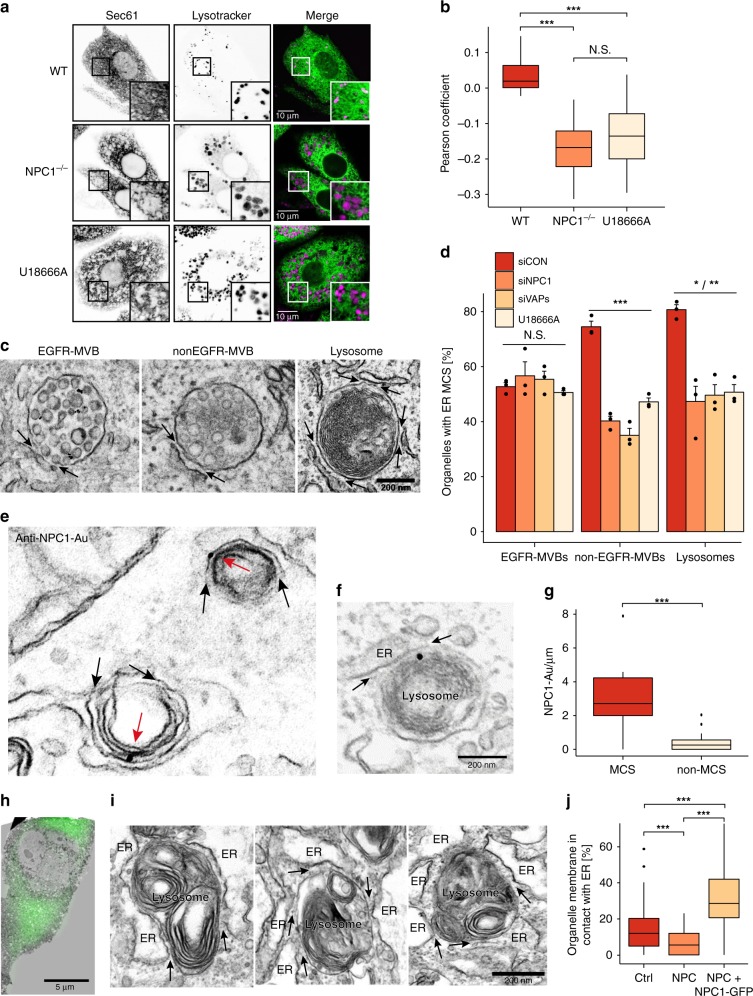
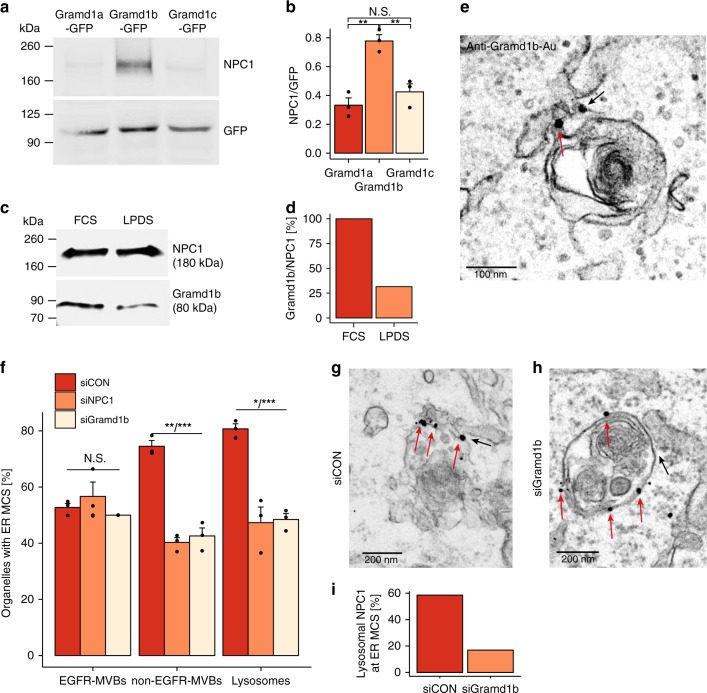
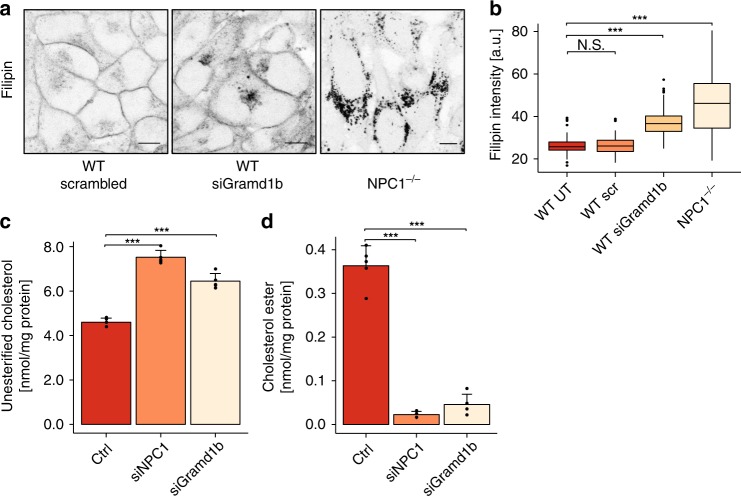
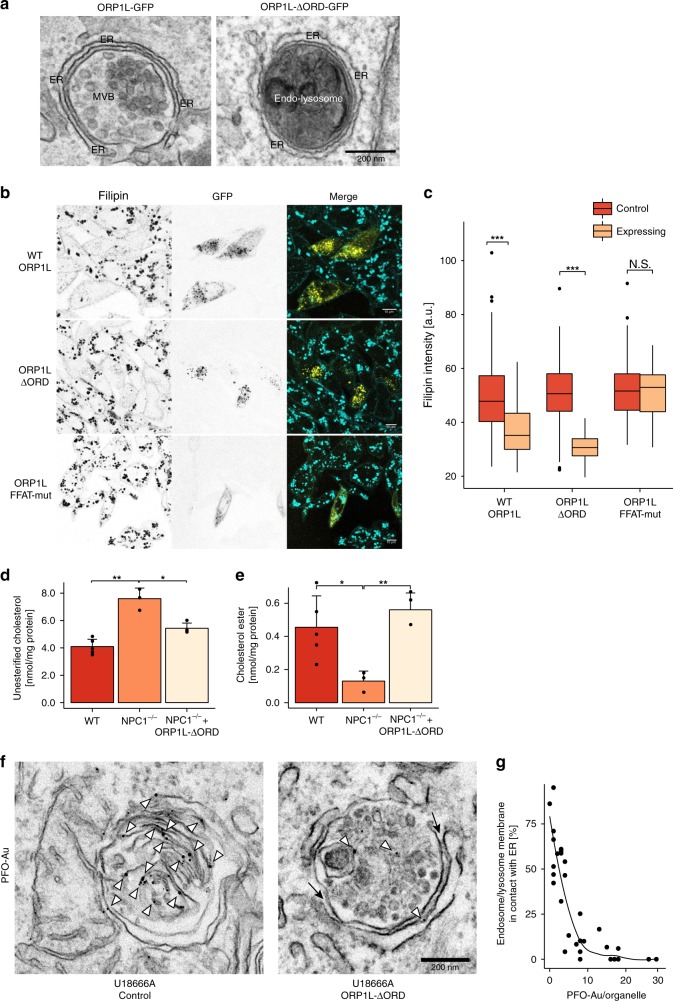
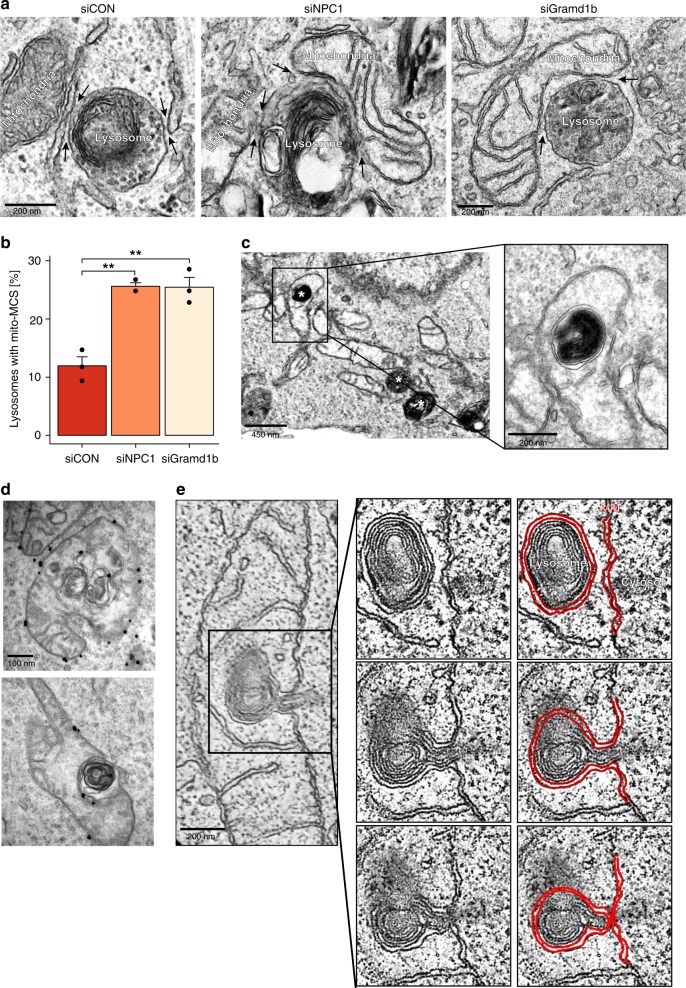
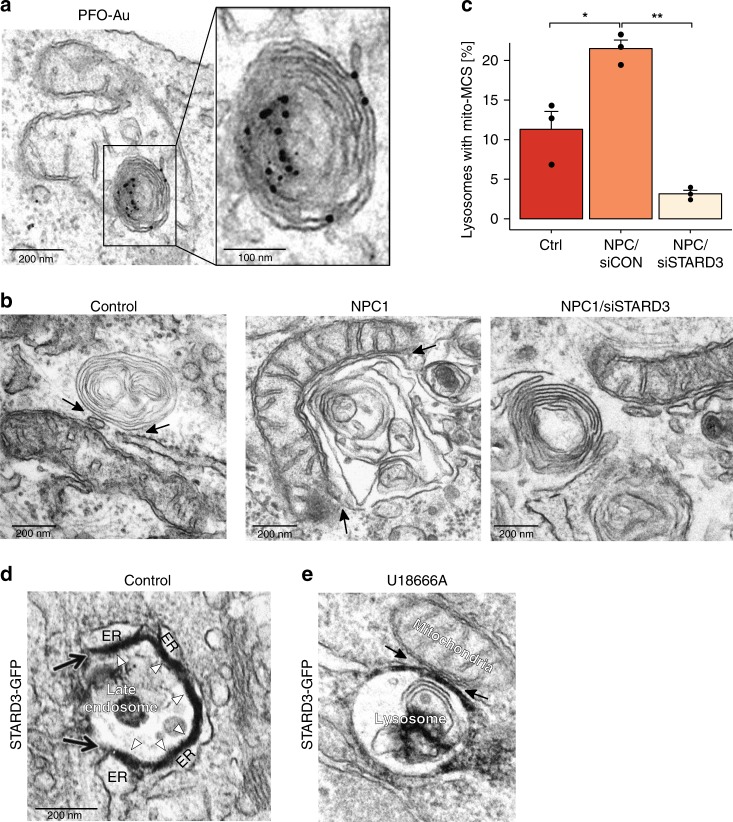
Transport of dietary cholesterol from endocytic organelles to the endoplasmic reticulum (ER) is essential for cholesterol homoeostasis, but the mechanism and regulation of this transport remains poorly defined. Membrane contact sites (MCS), microdomains of close membrane apposition, are gaining attention as important platforms for non-vesicular, inter-organellar communication. Here we investigate the impact of ER-endocytic organelle MCS on cholesterol transport. We report a role for Niemann-Pick type C protein 1 (NPC1) in tethering ER-endocytic organelle MCS where it interacts with the ER-localised sterol transport protein Gramd1b to regulate cholesterol egress. We show that artificially tethering MCS rescues the cholesterol accumulation that characterises NPC1-deficient cells, consistent with direct lysosome to ER cholesterol transport across MCS. Finally, we identify an expanded population of lysosome-mitochondria MCS in cells depleted of NPC1 or Gramd1b that is dependent on the late endosomal sterol-binding protein STARD3, likely underlying the mitochondrial cholesterol accumulation in NPC1-deficient cells.


Conflict of interest statement

F.P. is consultant to Actelion, Orphazyme and IntraBio and co-founder of IntraBio. Other authors declare no competing interests.

Figures

Fig. 1
Fig. 1
NPC1 tethers ER contact sites with late endocytic organelles. a Live-cell confocal microscopy images of ER and late endosomes/lysosomes. WT Chinese hamster ovary (CHO) cells, NPC1−/− CHO cells and WT CHO cells treated with U18666A (2 µg/ml for 72 h) were transfected with Sec61-GFP for 24 h and incubated with Lysotracker Red (75 nM) for 15 min before imaging. Scale bar, 10 µm. b Quantification of ER and lysosomal co-localization. The Pearson correlation coefficient between Sec61-GFP and Lysotracker channels was extracted for each cell (WT: n = 24 cells, NPC1−/−: n = 30 cells, U18666A: n = 27 cells) and presented as boxplots. Centre lines show medians, box limits indicate first (Q1) and third quartiles (Q3), whiskers extend to a maximum distance of 1.5*IQR (interquartile range) from Q1 and Q3, respectively or to the most extreme datapoint within that range. Welch two sample t-tests were performed between all conditions (WT-NPC: ***P = 2.8 × 10−15, WT-U18666A: ***P = 8.6 × 10−12, NPC-U18666A: N.S. P = 0.185). c Representative electron micrographs showing distinct MCS populations. HeLa cells were stimulated with EGF for 25 min in the presence of anti-EGFR antibody coupled to 10 nm gold prior to preparation for EM. Arrows indicate MCSs between the ER and endocytic organelles. Scale bar, 200 nm. d Endocytic organelle populations in c were scored according to the presence of MCS with the ER and the percentage of organelles with an ER MCS quantified. Data shown is the mean of three independent experiments + SEM. Welch two sample t-tests were performed between siCON and treatment conditions for each vesicle population (EGFR-MVBs: N.S. P = 0.524, P = 0.470, P = 0.278, nonEGFR-MVBs: ***P = 0.00025, P = 0.00034, P = 0.00071, Lysosomes: */**P = 0.01859, P = 0.00622, P = 0.00164). e Representative electron micrograph of NPC-patient fibroblasts transfected with NPC1-GFP and stained for NPC1 using pre-embedding labelling. NPC1-GFP (red arrows) is visible at MCSs (black arrows) between the ER and lysosomes. Scale bar, 200 nm. f Representative electron micrograph showing endogenous NPC1 staining at ER-lysosome MCSs (black arrows) using pre-embedding labelling in HeLa cells. g Quantification of NPC1 labelling on late endosome/lysosome limiting membrane that is (MCS) or is not (nonMCS) in contact with the ER (n = 16 late endosomes/lysosomes). h NPC1-GFP was expressed in NPC-patient fibroblasts cultured on gridded dishes and imaged by light microscopy prior to preparation for EM. EM images of individual cells, identified using grid coordinates, were montaged and the fluorescent image overlaid in order to distinguish between expressing and non-expressing cells. An expressing cell is shown. Scale bar, 5 μm. i Representative electron micrographs of endocytic organelles in NPC1gfp-expressing cells showing extended MCSs (arrows). Scale bar, 200 nm. j The length of MCSs was measured in non-transfected control fibroblasts (Ctrl) and transfected NPC-patient fibroblasts not expressing (NPC) or expressing NPC1-GFP (+NPC1gfp) and expressed as a percentage of the total endocytic organelle limiting membrane. n = 62 organelles (Ctrl), 60 organelles (NPC) and 84 organelles (+NPC1gfp). Welch two sample t-tests were performed between all conditions (Ctrl/NPC: ***P = 7.4 × 10−5, Ctrl/NPCgfp: ***P = 1.8 × 10−9, NPC/NPCgfp: ***P < 2.2 × 10−16)
Fig. 2
Fig. 2
NPC1 interacts with the ER-localised sterol transport protein Gramd1b at MCSs. a GFP immunoprecipitates from HeLa cells transfected with Gramd1a-c GFP plasmids were immunoblotted with anti-NPC1 and GFP antibodies. b Quantification of the ratio of NPC to GFP present in a, represented as a mean of three independent experiments. Welch two sample t-tests were performed between all conditions (Gramd1a/Gramd1b: **P = 0.00275, Gramd1b/Gramd1c: **P = 0.00836, Gramd1a/Gramd1c: N.S. P = 0.2835). c NPC1 immunoprecipitates from HeLa cells cultured in medium containing 10% FCS or LPDS for 18 h were immunoblotted with anti-Gramd1b antibody. d Quantification of the amount of Gramd1b as a percentage of NPC1 present in c, represented as the mean of two experiments. e Representative electron micrograph showing endogenous Gramd1b staining at ER-lysosome MCSs (black arrows) using pre-embedding labelling in HeLa cells. Scale bar, 100 nm. f Endocytic organelle populations in HeLa cells treated with control, NPC1 or Gramd1b siRNA were scored according to the presence of MCS with the ER. The percentage of organelles with an ER MCS was quantified and represented as the mean of three independent experiments + SEM. Welch two sample t-tests were performed between siCON and treatment conditions for each vesicle population (EGFR-MVBs: N.S. P = 0.5244, P = 0.197, nonEGFR-MVBs: ***P = 0.00025, **P = 0.00127, Lysosomes: *P = 0.01859, ***P = 0.00038). g, h Representative electron micrographs showing endogenous NPC1 staining (red arrows) at an ER-lysosome MCS (black arrows) using pre-embedding labelling in HeLa cells transfected with a non-targeting control siRNA (g) or with siRNA targeting Gramd1b (h). Scale bar, 200 nm. i Quantification of NPC1 labelling on late endosome/lysosome limiting membrane that is (MCS) or is not (nonMCS) in contact with the ER in cells prepared in panels g and h (n = 50 late endosomes/lysosomes per condition)
Fig. 3
Fig. 3
NPC1-regulated MCSs mediate cholesterol transport from late endocytic organelles to the ER. a Confocal microscopy images of WT HeLa cells transfected with control (scrambled) or Gramd1b siRNA as well as NPC1−/− HeLa cells stained with 50 µg/mL Filipin. Scale bars,10 µm. b Quantification of Filipin intensity in cells treated as described in a. Boxplots show medians as centre lines, box limits indicate first (Q1) and third quartiles (Q3), whiskers are at a maximum distance of 1.5*IQR (interquartile range) from Q1 and Q3, respectively or to the most extreme datapoint within that range. Outliers are shown. Welch two sample t-tests were performed between untreated WT condition and treatment conditions: WT-scrambled (n = 95 cells), WT-siGramd1b (n = 101 cells), NPC1−/− (n = 43 cells). N.S. P = 0.6216, ***P < 2.2 × 10−16, ***P = 4.9 × 10−11. c Quantification of unesterified cholesterol in HeLa cells treated with non-targeting control (ctrl), NPC1 and Gramd1b siRNAs. Cholesterol was measured using the Amplex Red Cholesterol Assay Kit and values are presented as mean of five independent experiments + SD. Welch two sample t-tests were performed between all conditions. ctrl/siNPC1 ***P = 0.00063, ctrl/siGramd1b **P = 0.00389, siNPC1/siGramd1b **P = 0.0085. d Quantification of cholesterol esters in HeLa cells treated with control, NPC1 and Gramd1b siRNAs. Cholesterol esters were measured using the Amplex Red Cholesterol Assay Kit with addition of 0.2 U/mL cholesterol esterase. Data are represented as mean of five independent experiments + SD. Welch two sample t-tests were performed between all conditions. ctrl/siNPC1 ***P = 0.00012, ctrl/siGramd1b ***P = 0.00033, siNPC1/siGramd1b N.S. P = 0.6758
Fig. 4
Fig. 4
Expansion of lysosome-ER contact sites restores cholesterol egress in NPC1-deficient cells. a Electron micrographs showing extended MCSs in HeLa cells transfected with wtORP1L or ORP1L-ΔORD GFP constructs. Scale bar, 200 nm. b Confocal microscopy images of CHO NPC1−/− cells transfected with ORP1L-GFP, ORP1L-deltaORD-GFP and ORP1L-FFATmut-GFP for 24 h, fixed and stained with 50 µg/ml Filipin (GFP, yellow; Filipin, cyan). Scale bar, 10 µm. c Quantification of intracellular Filipin staining in cells treated as described in b. Centre lines show medians, box limits indicate first (Q1) and third quartiles (Q3), whiskers extend to a maximum distance of 1.5*IQR (interquartile range) from Q1 and Q3, respectively or to the most extreme datapoint within that range. Welch two sample t-tests were performed between control and expressing cells for each condition (ORP1L: n = 203 cells (Control), n = 39 cells (Expressing), ***P = 9.1 × 10−10, ORP1L-deltaORD: n = 204 cells (Control), n = 42 cells (Expressing), ***P < 2.2 × 10−16, ORP1L-FFATmut-GFP: n = 202 cells (control), n = 33 cells (Expressing) N.S. P = 0.713,). d Quantification of unesterified cholesterol in WT and NPC1−/− HeLa cells as well as in NPC1−/− HeLa cells transfected with ORP1L-ΔORD-GFP, with expressing cells sorted by FACS. Cholesterol was measured using the Amplex Red Cholesterol Assay Kit and values are presented as mean of 5 (WT), 3 (NPC1) or 4 (NPC1 + ORP1L) independent experiments + SD. Welch two sample t-tests were performed: WT/NPC1−/− **P = 0.00959, NPC1−/−/NPC1−/− + ORP1L-ΔORD *P = 0.04161. e Quantification of cholesterol esters in WT and NPC1−/− HeLa cells as well as in NPC1−/− HeLa cells transfected with ORP1L-ΔORD-GFP and sorted by FACS. Cholesterol esters were measured using the Amplex Red Cholesterol Assay Kit with addition of 0.2 U/mL cholesterol esterase. Data are represented as mean of 5 (WT), 3 (NPC1) or 4 (NPC1 + ORP1L) independent experiments + SD with asterisks indicating statistical significance as determined by Welch two sample t-tests. WT/NPC1−/− *P = 0.01547, NPC1−/−/NPC1−/− + ORP1L-ΔORD **P = 0.00104. f HeLa cells transfected with ORP1L-deltaORD were treated with U18666A (2 µg/ml for 18 h) and labelled with PFO prior to preparation for EM. Representative electron micrographs show a lysosome with little/no contact with the ER (likely not expressing ORP1L-deltaORD) staining strongly for PFO and a lysosome with an extended contact with the ER with greatly reduced PFO labelling. Scale bar, 200 nm. g The percentage of endocytic organelle membrane in contact with the ER in f was measured and plotted against the number of PFO-gold particles (cholesterol label)/endocytic organelle (n = 30 organelles)
Fig. 5
Fig. 5
Increased lysosome-mitochondria contact sites in NPC1-deficient cells. a Electron micrographs of HeLa cells treated with non-targeting control siRNA (siCON), NPC1-siRNA (siNPC1) or with Gramd1b-siRNA (siGramd1b) showing lysosome MCSs (black arrows) with ER in control or mitochondria in NPC1 or Gramd1b-depleted cells. Scale bar, 200 nm. b The percentage of endocytic organelles with a mitochondria MCS from a were quantified and expressed as the mean of three independent experiments + SEM. Welch two sample t-tests were performed between siCON and treatment conditions (siNPC1:**P = 0.00615, siGramd1b:**P = 0.00412). c Electron micrograph of HeLa cells pulsed with HRP for 2 h prior to treatment with U18666A (2 µg/mL for 18 h). Asterisks indicate HRP-containing organelles, identified by the electron-dense reaction product. Scale bar, 450 nm and 200 nm in boxed enlargement d Representative electron micrographs of HeLa cells treated with U18666A (2 µg/mL for 18 h) and stained for endogenous Tom20 using pre-embedding labelling. Tom20-stained OMM appears to surround the lysosome. Scale bar, 100 nm. e Slices from a tomographic reconstruction from HeLa cells treated with U18666A (2 µg/mL for 18 h). Red lines, mitochondrial membrane. Scale bar, 200 nm
Fig. 6
Fig. 6
STARD3-dependent association of mitochondria with cholesterol-rich lysosomes with reduced ER contact. a Electron micrograph of HeLa cells treated with U18666A (2 µg/mL for 18 h) showing apparent engulfment of a lysosome by a mitochondria. Cholesterol was stained with PFO using pre-embedding labelling. “Engulfed” lysosomes are rich in PFO-stained cholesterol. Scale bar, 200 nm and 100 nm in boxed enlargement. b Representative electron micrographs showing lysosome contact sites (arrows) with ER or mitochondria in fibroblasts derived from healthy donors (control), fibroblasts from NPC1-patients (NPC1) or NPC1 patient fibroblasts treated with siSTARD3 (NPC1/siSTARD3). Scale bar, 200 nm. c The percentage of lysosomes with a mitochondria MCS from b are presented as mean from 3 independent experiments + SEM. d, e STARD3-GFP was co-expressed with APEX2-GBP in d control HeLa cells, or e HeLa cells treated with U18666A (2 µg/mL for 18 h) prior to preparation for EM. Electron dense APEX reaction product (STARD3-GFP) localizes to extended ER contacts with late endocytic organelles in control cells (d), but to lysosome-mitochondria MCS on NPC1 inhibition (e). Arrows, MCSs. Scale bar, 200 nm
Fig. 7
Fig. 7
Reciprocal relationship between lysosomal cholesterol and NPC1-regulated MCS. A schematic representation of cholesterol transport at NPC1-regulated lysosomal MCSs. In the presence of cholesterol in the endocytic pathway, lysosomal NPC1 interacts with Gramd1b on the ER to tether MCSs that mediate the transport of cholesterol from the endosome to the ER for esterification by ACAT. In the absence of functional NPC2, luminal cholesterol fails to be delivered to the limiting membrane for egress at NPC1-Gramd1b tethered MCS and therefore accumulates in the lysosome. In the absence of functional NPC1, NPC1-tethered lysosome-ER contact sites are lost and cholesterol accumulates in the lysosome. Under these conditions STARD3 mediates extended lysosome contact sites with mitochondria. However, when the lysosome is artificially tethered to the ER by expression of an ORP1L mutant with its sterol-binding domain deleted (ORP1L-ΔORD), cholesterol transport to the ER is restored

References

    1. Vance JE. Dysregulation of cholesterol balance in the brain: contribution to neurodegenerative diseases. Dis. Models Mech. 2012;5:746–755. doi: 10.1242/dmm.010124. - DOI - PMC - PubMed
    1. Platt FM. Sphingolipid lysosomal storage disorders. Nature. 2014;510:68–75. doi: 10.1038/nature13476. - DOI - PubMed
    1. Goldstein JL, Brown MS. A century of cholesterol and coronaries: from plaques to genes to statins. Cell. 2015;161:161–172. doi: 10.1016/j.cell.2015.01.036. - DOI - PMC - PubMed
    1. Pfisterer SG, Peranen J, Ikonen E. LDL-cholesterol transport to the endoplasmic reticulum: current concepts. Curr. Opin. Lipidol. 2016;27:282–287. doi: 10.1097/MOL.0000000000000292. - DOI - PMC - PubMed
    1. Underwood KW, Jacobs NL, Howley A, Liscum L. Evidence for a cholesterol transport pathway from lysosomes to endoplasmic reticulum that is independent of the plasma membrane. J. Biol. Chem. 1998;273:4266–4274. doi: 10.1074/jbc.273.7.4266. - DOI - PubMed

Publication types

MeSH terms