. 2019 Sep 19;9(1):13539.
doi: 10.1038/s41598-019-49328-1.

Functional organization of motor networks in the lumbosacral spinal cord of non-human primates

Affiliations

Functional organization of motor networks in the lumbosacral spinal cord of non-human primates

Amirali Toossi et al. Sci Rep. .

Abstract

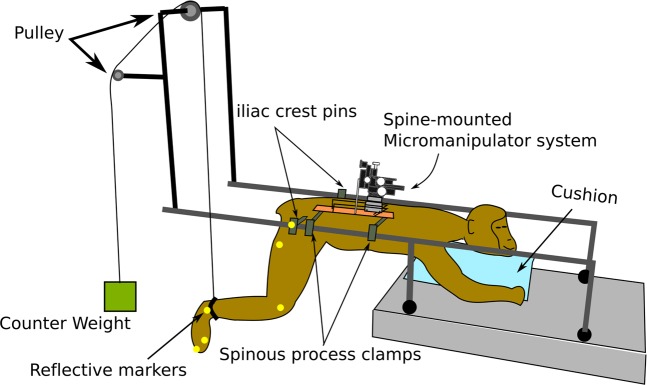
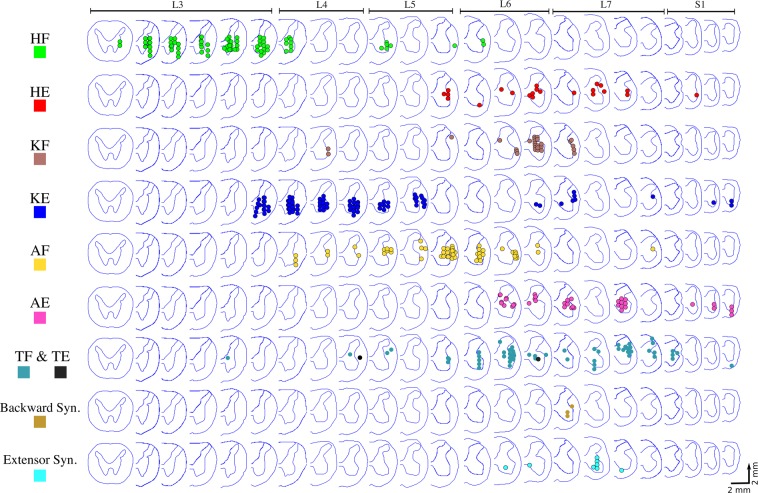
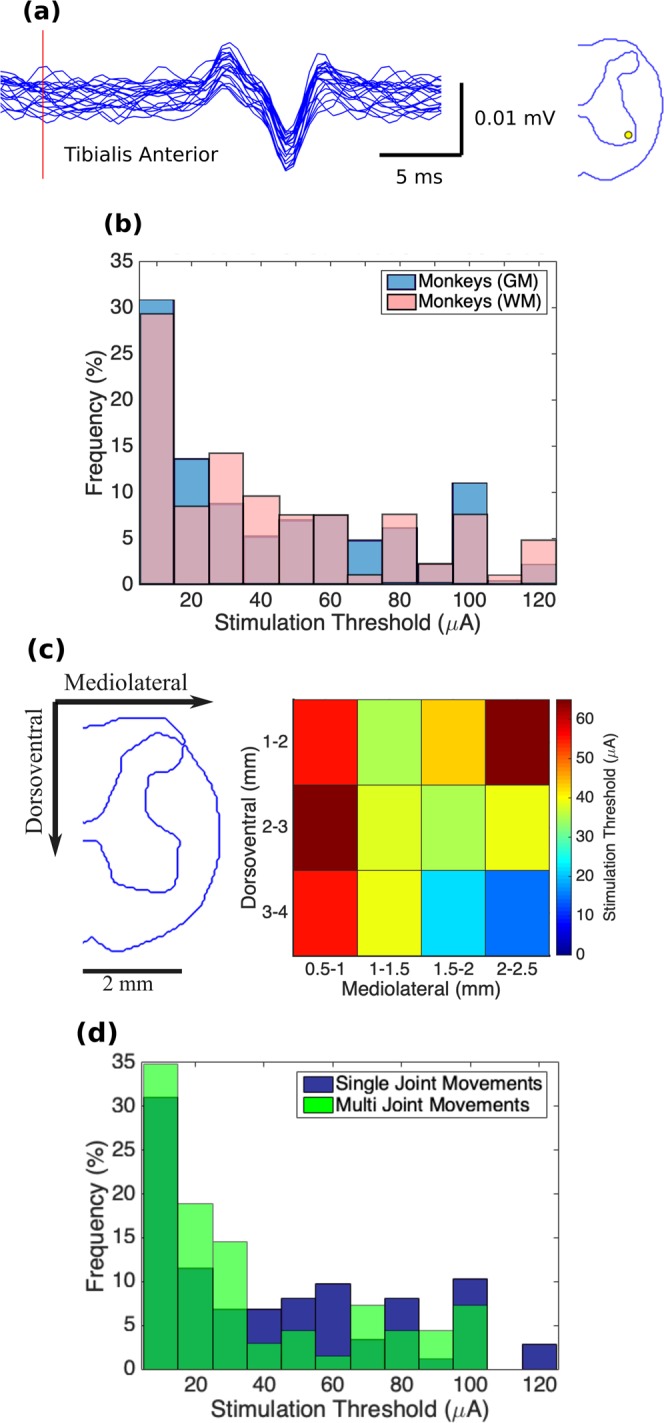
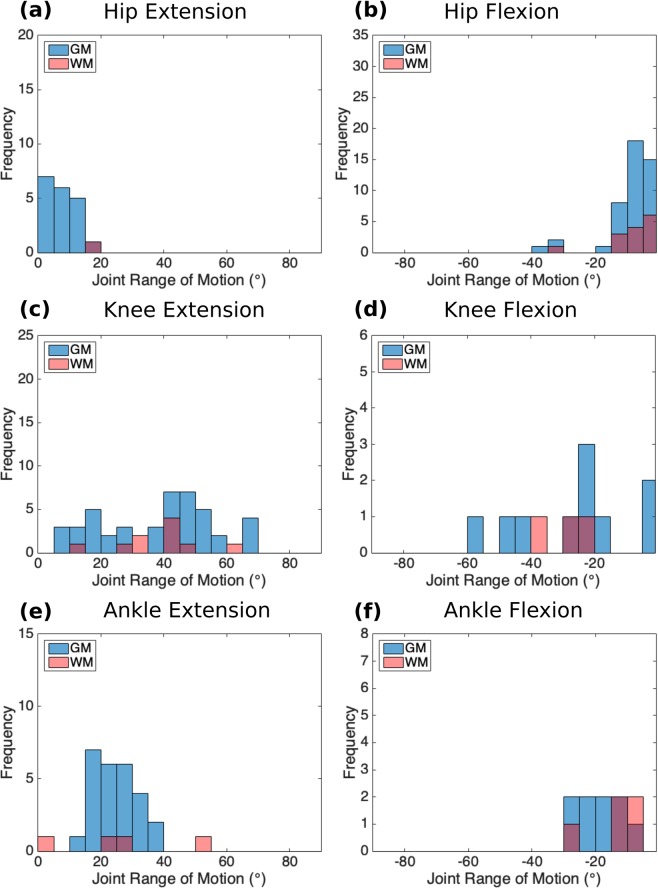
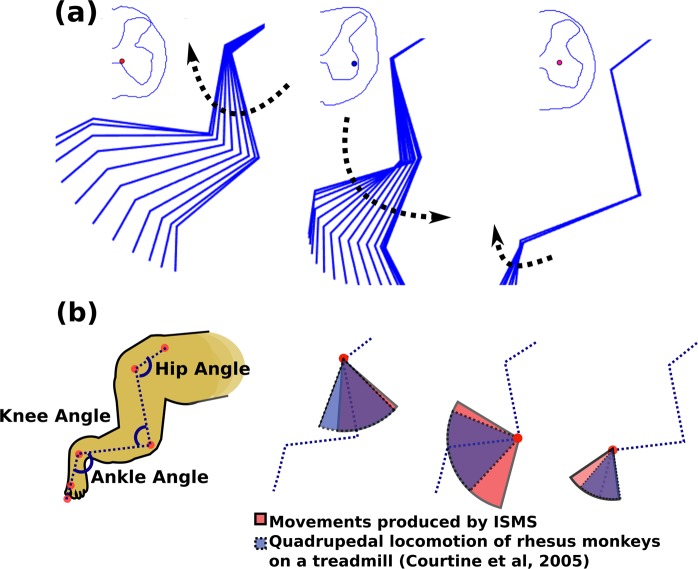
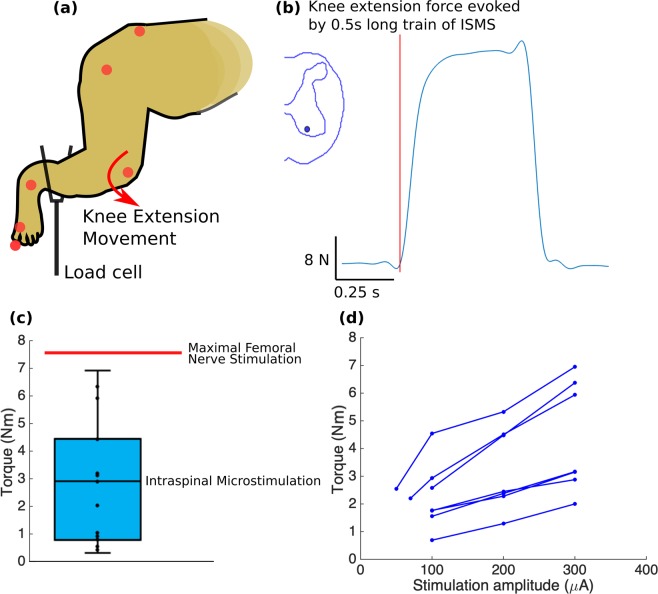
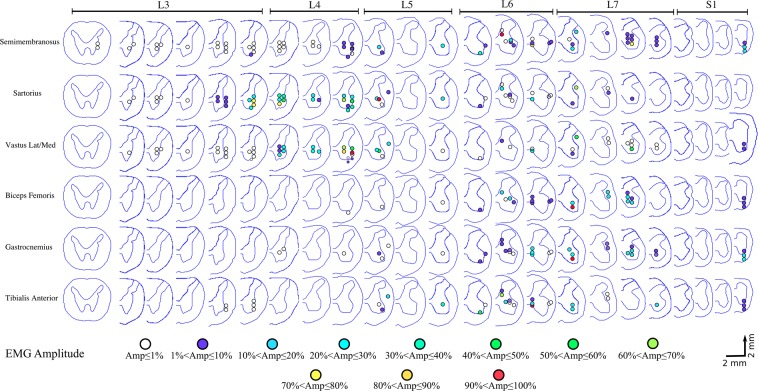
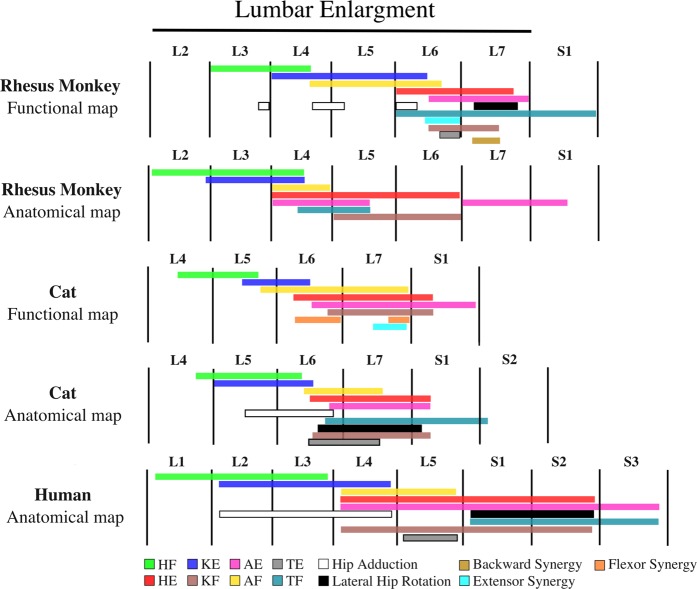
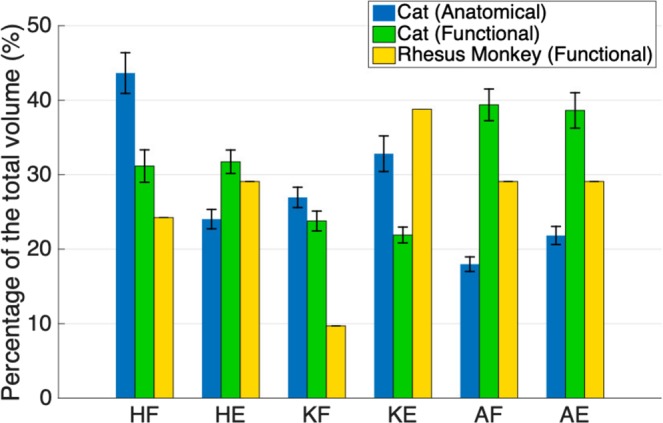
Implantable spinal-cord-neuroprostheses aiming to restore standing and walking after paralysis have been extensively studied in animal models (mainly cats) and have shown promising outcomes. This study aimed to take a critical step along the clinical translation path of these neuroprostheses, and investigated the organization of the neural networks targeted by these implants in a non-human primate. This was accomplished by advancing a microelectrode into various locations of the lumbar enlargement of the spinal cord, targeting the ventral horn of the gray matter. Microstimulation in these locations produced a variety of functional movements in the hindlimb. The resulting functional map of the spinal cord in monkeys was found to have a similar overall organization along the length of the spinal cord to that in cats. This suggests that the human spinal cord may also be organized similarly. The obtained spinal cord maps in monkeys provide important knowledge that will guide the very first testing of these implants in humans.


Conflict of interest statement

The authors declare no competing interests.

Figures

Figure 1
Figure 1
Experimental setup for functional mapping of the lumbosacral spinal cord in non-human primates.
Figure 2
Figure 2
Anatomical location of the mapped region of the spinal cord in this study (highlighted in purple). For all animals, the spinal cord segments were identified based on the entry zones of the dorsal rootlets.
Figure 3
Figure 3
Functional map of the lumbosacral enlargement of the spinal cord acquired from 4 rhesus monkeys. ISMS in the locations shown on the maps evoked movements with thresholds ≤120 µA. Each dot represents a mapped location in the spinal cord that produced a movement. Different colors represent different movements. Spinal cord cross-sections shown in each row are 2 mm apart from their neighboring cross-section, irrespective of their spacing in the figure. Total length of the spinal cord covered by the cross sections shown is ~46 mm. HF: Hip Flexion, HE: Hip Extension, KF: Knee Flexion, KE: Knee Extension, AF: Ankle Flexion, AE: Ankle Extension, TF: Toe Flexion, TE: Toe Extension, Backward syn.: Backward Synergy (HE + KF + AE), Extensor Syn.: Extensor Synergy (HE + KE + AE).
Figure 4
Figure 4
(a) Overall distribution of the main leg movements resulting from microstimulation in the gray matter (GM) and white matter (WM) of the lumbosacral spinal cord in all animals (n = 4). (b) Number of joints (hip, knee, ankle and, metatarsophalangeal (MTP)) involved in all evoked leg movements. (c) Distribution and frequency (count) of the multi-joint movements evoked by microstimulation only in the GM in all animals. HF: Hip Flexion, HE: Hip Extension, KF: Knee Flexion, KE: Knee Extension, AF: Ankle Flexion, AE: Ankle Extension, TF: Toe Flexion, TE: Toe Extension.
Figure 5
Figure 5
(a) Example of EMG activity evoked in the tibialis anterior muscle by ISMS at threshold intensity (10 μA) in Monkey D. Red vertical line represents stimulation onset. Figure on the right shows the location of the electrode tip on a transverse cross-section of the spinal cord. (b) Distribution of the stimulation thresholds for producing leg movements in the gray (GM) and white (WM) matters (nGM = 227 and nWM = 106) of the spinal cord (n = 4 animals). (c) Spatial distribution of the stimulation thresholds. Colors in each bin represent the mean threshold across all animals. Mediolateral coordinates are shown with respect to midline. Dorsoventral coordinates are shown with respect to the dorsal surface of the spinal cord. (d) Comparison of the stimulation thresholds for single- and multi-joint movements evoked by ISMS. Distribution of the stimulation thresholds for single-joint (n = 174) and multi-joint (n = 69) movements evoked by ISMS in the spinal cord of 4 animals.
Figure 6
Figure 6
Distribution of changes in joint angle (i.e., range of motion) for the movements evoked by ISMS at sites in the gray and white matter (GM and WM) in all animals. Kinematic measurements were obtained for 40% of all sites with ISMS-evoked movements. (a) Hip Extension (initial hip angle: 114.6° ± 3.2° [mean ± standard error]). (b) Hip Flexion (initial hip angle: 112.6° ± 3.3° [mean ± standard error]). (c) Knee Extension (initial knee angle: 84.8° ± 3.86° [mean ± standard error]). (d) Knee Flexion (initial knee angle: 102.9° ± 7.9° [mean ± standard error]). (e) Ankle Extension (initial ankle angle: 116.1° ± 3.9° [mean ± standard error]). (f) Ankle Flexion (initial ankle angle: 114.5° ± 5.4° [mean ± standard error]).
Figure 7
Figure 7
(a) Examples of the ISMS-evoked range of motions in the ipsilateral hindlimb of animal A. The location of the electrode tip for each movement is shown on the cross-sectional trace of the spinal cord. (b) Range of motion (ROM) of hip, knee and ankle joints produced by ISMS in the gray matter of the spinal cord (in Red). ROM of hip, knee and ankle joints of rhesus monkeys during quadrupedal locomotion on a treadmill at a speed of 1.79 m/s (in Blue). Treadmill locomotion data were obtained from Courtine et al..
Figure 8
Figure 8
(a) Isometric torque measurement setup. (b) Example of a force trace for an ISMS-evoked knee extension movement, recorded using the load cell. (c) Isometric torque measurements for knee extension movements evoked at 15 select locations across 4 animals. Whiskers show the minimal and maximal values and box represents the interquartile range. Moment arm was 15.9 ± 1.1 cm (average ± standard deviation). Knee extension torques produced with ISMS in the gray matter of the spinal cord (in cyan) and with femoral nerve stimulation (n = 1 recording - red horizontal line) are shown. (d) Knee extension torque recruitment curves recorded for 7 locations in the gray matter of the spinal cord in animals B and C. The stimulation protocol consisted of 0.5 s-train of biphasic, charge-balanced pulses, 200 µs-long and delivered at 50 Hz frequency.
Figure 9
Figure 9
Spatial distribution of the mapped locations that evoked muscle activity in the semimembranosus, sartorius, vastus lateralis and medialis, biceps femoris, gastrocnemius, and tibialis anterior muscles of the rhesus monkey. Results are obtained from electromyography (EMG) recordings from animals A, C, and D. Stimulation amplitude was 100 µA for all recordings. Amplitudes of the EMG signals recorded from each muscle in each animal were normalized to the maximal amplitude recorded for that muscle in that animal.
Figure 10
Figure 10
Rostrocaudal organization of the lumbar enlargement of the spinal cords of rhesus monkeys, cats and humans. In all species, hip flexors were activated in more rostral regions of the lumbar enlargement than knee extensors, followed by ankle flexors, hip extensors, ankle extensors and knee flexors. Data for the monkey anatomical map were obtained from Capogrosso et al.. Data for the human anatomical map were obtained from Sharrard,. The resolution of the human spinal cord anatomical map is limited to full spinal cord segments. Data for the cat functional map were obtained from Mushahwar et al., Saigal et al., and Mushahwar & Horch. Data for the cat anatomical map were obtained from Vanderhorst & Holstege, and Yakovenko et al.. The total length of the lumbar enlargement in monkeys, cats and humans are approximately 40 mm, 30 mm,, and 50 mm, respectively. Extensor synergy is defined as a combination of HE, KE, and AE and backward synergy is defined as HE, KF, and AE. HF: Hip Flexion, HE: Hip Extension, KF: Knee Flexion, KE: Knee Extension, AF: Ankle Flexion, AE: Ankle Extension, TF: Toe Flexion, TE: Toe Extension. Anatomical map of the cat lumbosacral spinal cord was adapted based on the following motoneuronal pools: HF – Psoas, Sartorius, Iliacus, Rectus Femoris, Gracilis; HE – Semimembranosus, Semitendinosus, Biceps Femoris, Gluteus maximus; Hip Adduction – Pectineus, Adductor Femoris Magnus, Gracilis, Adductor brevis, Adductor longus; Lateral Hip Rotation – Gluteus maximus, Internal obturator; KE – Rectus Femoris, Vastus Medialis, Vastus Lateralis, Vastus Intermedius;, KF – Biceps Femoris, Semitendinosus, Semimembranosus; AF – Extensor digitorum longus, Tibialis anterior; AE – Flexor halluces longus, Tibialis posterior, Plantaris, Soleus, Lateral and Medial Gastrocnemius; TE – Extensor digitorum longus muscle; TF – Intrinsic foot, Flexor hallucis longus, Flexor digitorum longus. Muscles that were used for generating the anatomical map for humans were: Psoas, Hip adductors, Quadriceps, Sartorius, Tibialis anterior, Extensor digitorum longus, Tibialis posterior, Knee flexors, Gastrocnemius, Soleus, Peroneus, Intrinsic foot, Flexor digitorum longus, Gluteus maximus, and Lateral hip rotators. Anatomical map of the monkey lumbosacral spinal cord was adapted based on the following motoneuronal pools: HF – Psoas, Rectus femoris; HE – Gluteas medius, Semitendinosus; KE – Rectus femoris; KF – Semitendinosus; AF – Tibialis anterior, Extensor digitorum longus; AE – Medial Gastrocnemius, Flexor digitorum longus; TF – Flexor Digitorum Longus.
Figure 11
Figure 11
Spatial distribution (in the rostrocaudal direction) of the maps of the lumbar enlargement in cats and rhesus monkeys. The total length of the lumbar enlargement in the spinal cords of monkeys, cats and humans are approximately 40 mm, 30 mm,, and 50 mm, respectively. Functional map data for cats were obtained from Mushahwar & Horch, Saigal et al., and Mushahwar et al.. Anatomical map data were obtained from Vanderhorst & Holstege. Functional maps only include responses from ISMS in the gray matter of the spinal cords. The sizes of the spinal cord segments in cats used to convert the maps into spatial distribution were derived from measurements obtained from 4 cat spinal cords. HF: Hip Flexion, HE: Hip Extension, KF: Knee Flexion, KE: Knee Extension, AF: Ankle Flexion, AE: Ankle Extension. Error bars represent standard deviation.

References

    1. Mushahwar VK, Jacobs PL, Normann RA, Triolo RJ, Kleitman N. New functional electrical stimulation approaches to standing and walking. J. Neural Eng. 2007;4:S181. doi: 10.1088/1741-2560/4/3/S05. - DOI - PubMed
    1. Stein RB, Mushahwar V. Reanimating limbs after injury or disease. Trends Neurosci. 2005;28:518–524. doi: 10.1016/j.tins.2005.07.007. - DOI - PubMed
    1. Tator CH, Minassian K, Mushahwar VK. Spinal cord stimulation: therapeutic benefits and movement generation after spinal cord injury. Handb. Clin. Neurol. 2012;109:283–296. doi: 10.1016/B978-0-444-52137-8.00018-8. - DOI - PubMed
    1. Holinski BJ, et al. Intraspinal microstimulation produces over-ground walking in anesthetized cats. J. Neural Eng. 2016;13:056016. doi: 10.1088/1741-2560/13/5/056016. - DOI - PMC - PubMed
    1. Saigal R, Renzi C, Mushahwar VK. Intraspinal microstimulation generates functional movements after spinal-cord injury. IEEE Trans. Neural Syst. Rehabil. Eng. 2004;12:430–440. doi: 10.1109/TNSRE.2004.837754. - DOI - PubMed

Publication types