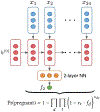
Predicting pregnancy using large-scale data from a women's health tracking mobile application
- PMID: 31538145
- PMCID: PMC6752881
- DOI: 10.1145/3308558.3313512
Predicting pregnancy using large-scale data from a women's health tracking mobile application
Abstract
Predicting pregnancy has been a fundamental problem in women's health for more than 50 years. Previous datasets have been collected via carefully curated medical studies, but the recent growth of women's health tracking mobile apps offers potential for reaching a much broader population. However, the feasibility of predicting pregnancy from mobile health tracking data is unclear. Here we develop four models - a logistic regression model, and 3 LSTM models - to predict a woman's probability of becoming pregnant using data from a women's health tracking app, Clue by BioWink GmbH. Evaluating our models on a dataset of 79 million logs from 65,276 women with ground truth pregnancy test data, we show that our predicted pregnancy probabilities meaningfully stratify women: women in the top 10% of predicted probabilities have a 89% chance of becoming pregnant over 6 menstrual cycles, as compared to a 27% chance for women in the bottom 10%. We develop a technique for extracting interpretable time trends from our deep learning models, and show these trends are consistent with previous fertility research. Our findings illustrate the potential that women's health tracking data offers for predicting pregnancy on a broader population; we conclude by discussing the steps needed to fulfill this potential.
Keywords: Pregnancy prediction; mobile health tracking.
Figures


Similar articles
-
Assessment of menstrual health status and evolution through mobile apps for fertility awareness.NPJ Digit Med. 2019 Jul 16;2:64. doi: 10.1038/s41746-019-0139-4. eCollection 2019. NPJ Digit Med. 2019. PMID: 31341953 Free PMC article.
-
Women's comfort with mobile applications for menstrual cycle self-monitoring following the overturning of Roe v. Wade.Mhealth. 2023 Oct 19;10:1. doi: 10.21037/mhealth-23-31. eCollection 2024. Mhealth. 2023. PMID: 38323149 Free PMC article.
-
Characterizing physiological and symptomatic variation in menstrual cycles using self-tracked mobile-health data.NPJ Digit Med. 2020 May 26;3:79. doi: 10.1038/s41746-020-0269-8. eCollection 2020. NPJ Digit Med. 2020. PMID: 32509976 Free PMC article.
-
Menstrual Tracking Mobile App Review by Consumers and Health Care Providers: Quality Evaluations Study.JMIR Mhealth Uhealth. 2023 Mar 1;11:e40921. doi: 10.2196/40921. JMIR Mhealth Uhealth. 2023. PMID: 36857125 Free PMC article. Review.
-
Changing factors and changing needs in women's health care.Nurs Clin North Am. 1986 Mar;21(1):111-23. Nurs Clin North Am. 1986. PMID: 3513129 Review.
Cited by
-
The association of COVID-19 vaccination and menstrual health: A period-tracking app-based cohort study.Vaccine X. 2024 May 18;19:100501. doi: 10.1016/j.jvacx.2024.100501. eCollection 2024 Aug. Vaccine X. 2024. PMID: 38832342 Free PMC article.
-
Comparison of Multivariable Logistic Regression and Other Machine Learning Algorithms for Prognostic Prediction Studies in Pregnancy Care: Systematic Review and Meta-Analysis.JMIR Med Inform. 2020 Nov 17;8(11):e16503. doi: 10.2196/16503. JMIR Med Inform. 2020. PMID: 33200995 Free PMC article. Review.
-
Feasibility of continuous distal body temperature for passive, early pregnancy detection.PLOS Digit Health. 2022 May 16;1(5):e0000034. doi: 10.1371/journal.pdig.0000034. eCollection 2022 May. PLOS Digit Health. 2022. PMID: 36812529 Free PMC article.
-
Assessment of menstrual health status and evolution through mobile apps for fertility awareness.NPJ Digit Med. 2019 Jul 16;2:64. doi: 10.1038/s41746-019-0139-4. eCollection 2019. NPJ Digit Med. 2019. PMID: 31341953 Free PMC article.
-
Advancing Obstetric Care Through Artificial Intelligence-Enhanced Clinical Decision Support Systems: A Systematic Review.Cureus. 2025 Mar 13;17(3):e80514. doi: 10.7759/cureus.80514. eCollection 2025 Mar. Cureus. 2025. PMID: 40225537 Free PMC article. Review.
References
-
- 2017. Glow and National Institutes of Health Collaborate to Advance Fertility Model. PR Newswire (2017).
-
- Barrett John C and Marshall John. 1969. The risk of conception on different days of the menstrual cycle. Population Studies 23, 3 (1969), 455–461. - PubMed
-
- Inci M Baytas, Cao Xiao, Zhang Xi, Wang Fei, K Jain Anil, and Zhou Jiayu. 2017. Patient subtyping via time-aware LSTM networks. In Proceedings of the 23rd ACM SIGKDD International Conference on Knowledge Discovery and Data Mining ACM, 65–74.
-
- Bigelow Jamie L, Dunson David B, Stanford Joseph B, Ecochard René, Gnoth Christian, and Colombo Bernardo. 2004. Mucus observations in the fertile window: a better predictor of conception than timing of intercourse. Human Reproduction 19, 4 (2004), 889–892. - PubMed
Grants and funding
LinkOut - more resources
Full Text Sources
