. 2019 Sep 20:8:e46827.
doi: 10.7554/eLife.46827.

A survey of new PIs in the UK

Affiliations

A survey of new PIs in the UK

Sophie E Acton et al. Elife. .

Abstract

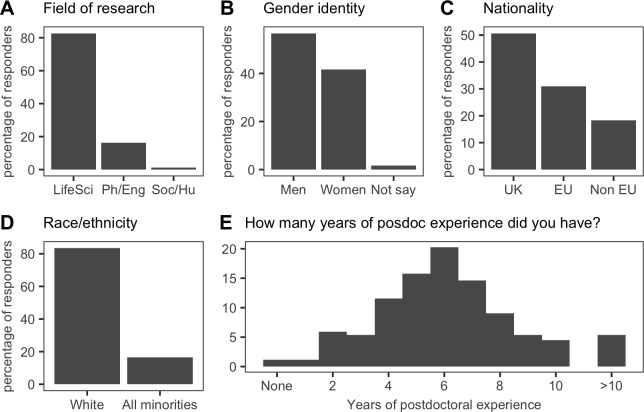
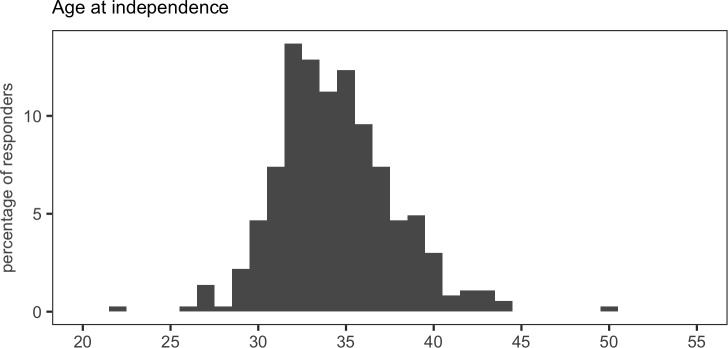
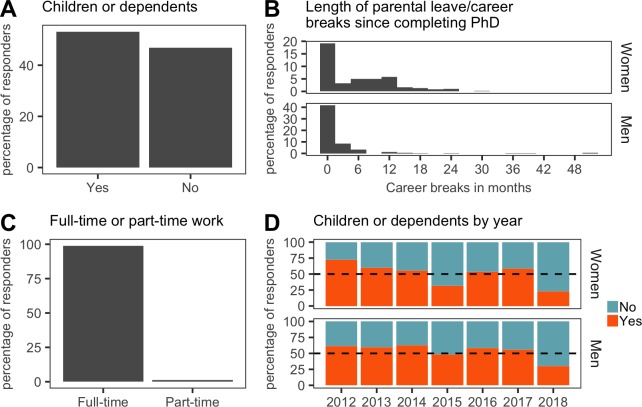
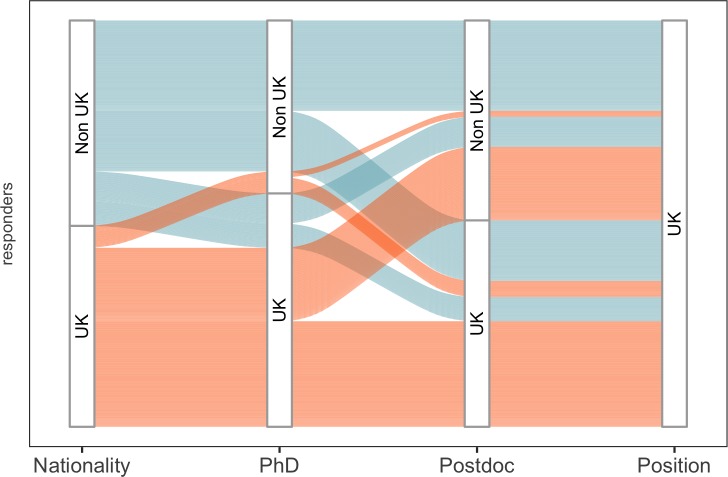
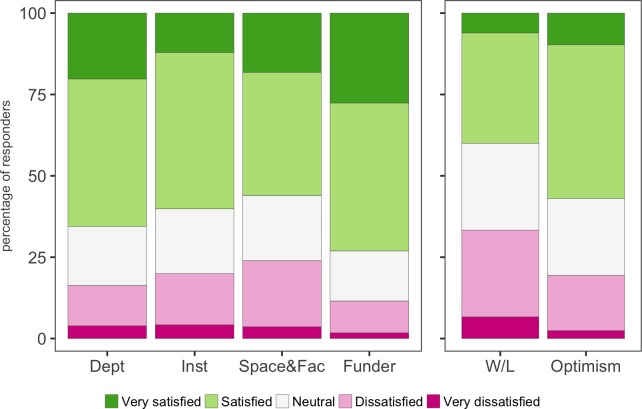
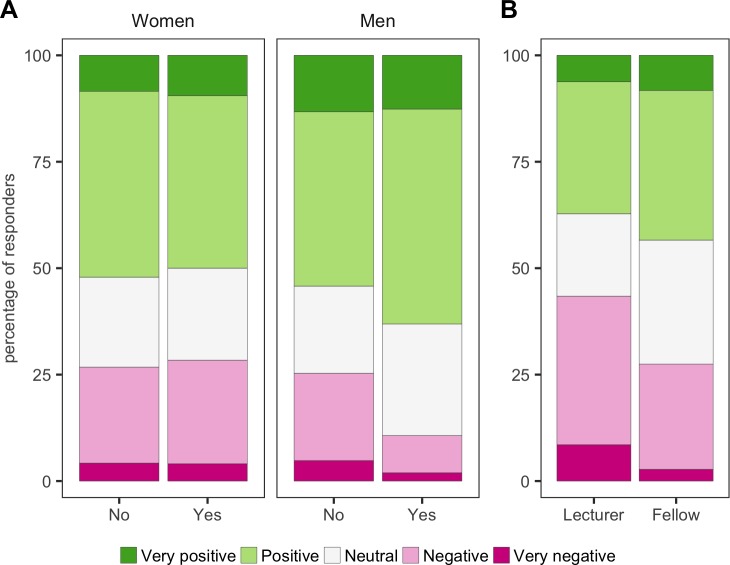
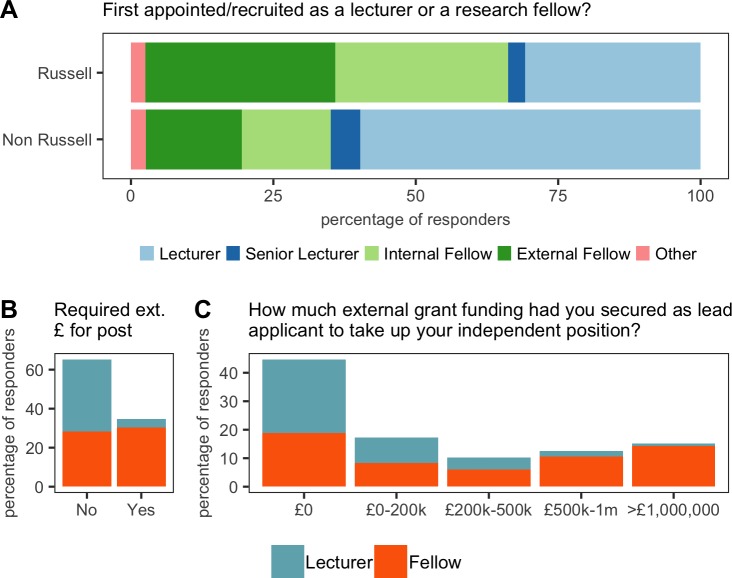
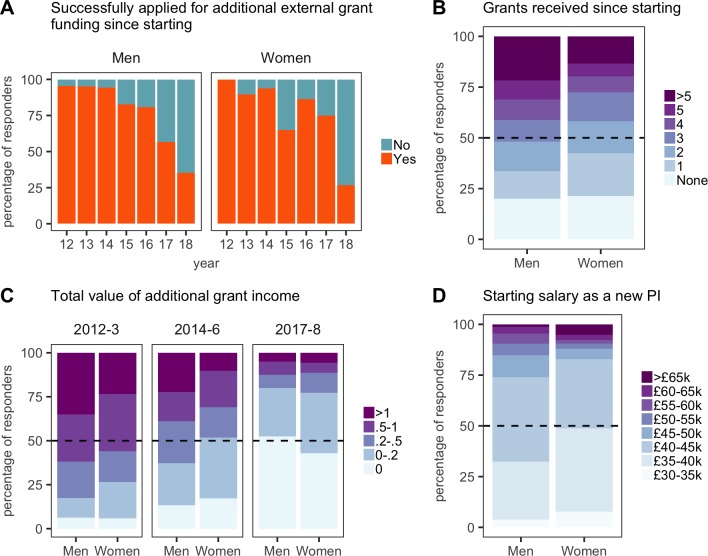
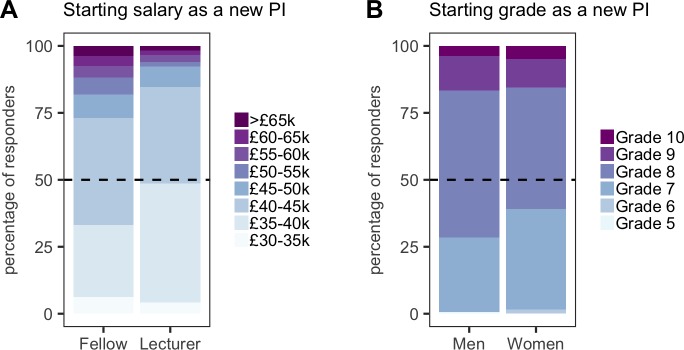
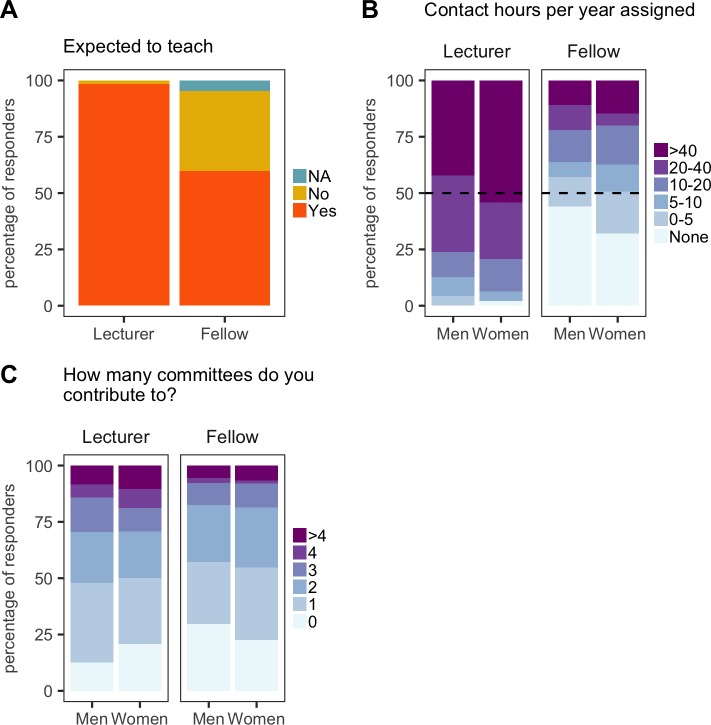
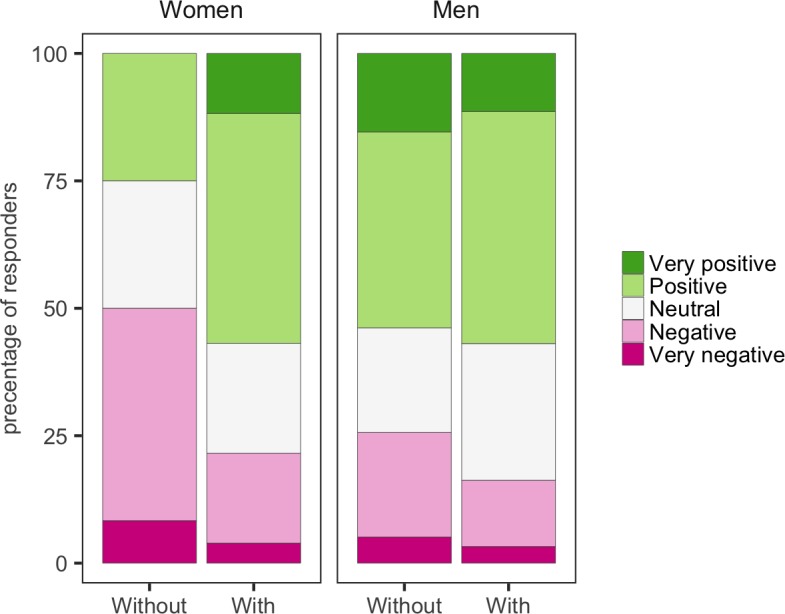
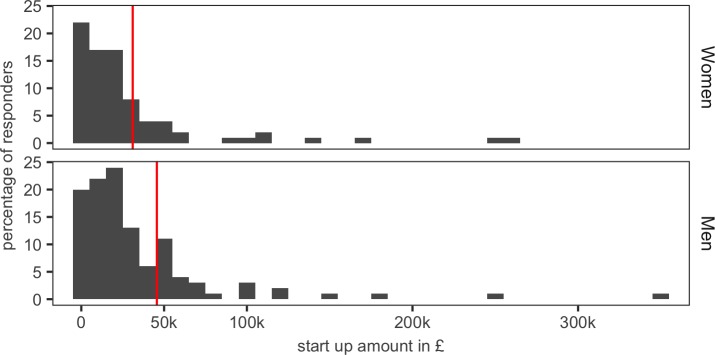
The challenges facing a new independent group leader, principal investigator (PI) or university lecturer are formidable: secure funding, recruit staff and students, establish a research programme, give lectures, and carry out various administrative duties. Here we report the results of a survey of individuals appointed as new group leaders, PIs or university lecturers in the UK between 2012 and 2018. The concerns expressed include difficulties in recruiting PhD students, maintaining a good work-life balance and securing permanent positions. Gender differences were also found in relation to starting salary and success with research funding. We make recommendations to employers and funders to address some of these concerns, and offer advice to those applying for PI positions.

Keywords: NewPI; careers in science; fellowships; gender equality; none; science policy; universities.


Conflict of interest statement

SA, AB, CT, AT No competing interests declared

Figures

Figure 1.
Figure 1.. Overview of cohort demographics.
(A) 83% (302/365) of respondents classified themselves as being in the Life Sciences (LifeSci); 16% (59/365) were in the Physical Sciences and Engineering (Ph/Eng); and 1% (4/365) were from in the Social Sciences and Humanities (Soc/Hu). (B) 56.7% (207/365) of respondents were men; 41.6% (152/365) were women; and 1.6% (6/365) were ‘Prefer not to say’. (C) 51% (185/365) of respondents were from the UK; 31% (113/365) were from other EU countries; and 18% (67/365) were from the rest of the world (Non EU). (D) 84% (305/365) of respondents were white. (E) 51% (180/355) of respondents had between five and seven years of postdoc experience prior to independence. Consequently, the majority of respondents were in their mid-thirties at the time they became new PIs (see Figure 1—figure supplement 1); the most recent new PIs were the least likely to have dependents (see Figure 1—figure supplement 2).
Figure 1—figure supplement 1.
Figure 1—figure supplement 1.. Age of respondents.
The mean age of respondents at independence was 34.
Figure 1—figure supplement 2.
Figure 1—figure supplement 2.. Dependents, career breaks and work patterns.
(A) 53.2% (194/365) of respondents care for dependents. (B) 56% of women and 45% of men had taken at least one career break. The average career break was 10 months for women and 5 months for men. (C) Despite a majority of respondents having dependents to take care of, just 4 of the 365 respondents worked part-time in their position. (D) The most recent female appointees in our cohort were the least likely to have dependents, and the most established female appointees were the most likely to have dependents.
Figure 2.
Figure 2.. Overview of cohort mobility.
An alluvial plot of cohort migration, where line width is proportional to the percentage of respondents. Colour corresponds to the nationality (UK; orange, Non-UK; blue) of participants as they move through their careers (PhD and postdoc training). 26.8% (98/365) of respondents had spent all their career in the UK, while 22.2% (81/365) had not worked in the UK before starting as a new PI in the UK.
Figure 3.
Figure 3.. Satisfaction and optimism.
Participants were asked to rate their satisfaction with their host department (Dept), host institution (Inst), lab space and access to facilities (Space&Fac) and support from their funder (Funder). Participants were also asked how they felt about their current work-life balance (W/L) and their optimism about their future career (Optimism). With the exception of work-life balance, more than 50% of respondents replied that they were satisfied or very satisfied.
Figure 3—figure supplement 1.
Figure 3—figure supplement 1.. Optimism and work-life balance of subgroups.
(A) Having dependants did not affect optimism scores for new male or female PIs. (B) Lecturers were less positive about work-life balance than fellows.
Figure 4.
Figure 4.. Initial recruitment.
(A) 75% (234/311) of respondents were from Russell Group universities, and a majority of these recruits (64%; 149/234) were brought in as research fellows (top). 25% (77/311) of respondents were from outside the Russell Group, and a majority of these recruits (60%; 46/77) were brought in as lecturers (bottom). (B) 35% (108/311) of respondents were required to have secured a major grant or fellowship in order to take up their position: 52% (94/182) of fellows were expected to have secured such funding, compared with just 11% (14/129) of lecturers. (C) Some respondents (mostly research fellows) had secured more than £1 m in external grant funding when they started as a new PI.
Figure 5.
Figure 5.. Gender comparisons in pay and grant income.
All plots are expressed as the percentage of respondents within each category. (A) Grant success versus year of independence (12 = 2012, and so on). (B) Half of the male respondents had received three or more grants since starting; half of the female respondents had received two or more. (C) Grant values (expressed in £m) for new PIs who started in 2012–13, 2014–16, and 2017–2018. (D) The self-reported salaries of new PIs at the time they were appointed show a substantial gender pay gap.
Figure 5—figure supplement 1.
Figure 5—figure supplement 1.. Starting salaries.
(A) Lecturers were appointed on lower starting salaries than fellows. (B) Women started on lower pay grades than men.
Figure 6.
Figure 6.. Teaching and administration load.
All plots are expressed as the percentage of respondents within each category. (A) Almost all (119/121) new PIs appointed as lecturers are expected to teach, along with 60% (100/167) of new PIs appointed as fellows. (B) Lecturers generally have much higher teaching loads than fellows, and women have more contact hours assigned than men (both as lecturers and fellows). (C) Women were expected to contribute to more committees than men.
Figure 7.
Figure 7.. Mentorship and optimism.
Women with mentors were more optimistic about the future than women without mentors. Men with mentors were a little more optimistic about the future than men without mentors.
Figure 8.
Figure 8.. Start-up funds.
Female respondents received an average of £31 k (red line; top panel) in start-up funds, whereas men received an average of £45.6 k (red line; bottom panel.
Figure 8—figure supplement 1.
Figure 8—figure supplement 1.. Proleptic appointments.
(A) 70% (140/200) of research fellows did not have a proleptic appointment. (B) 36% (59/164) of research fellows did not know when to expect an interview for a propleptic appointment.
Figure 9.
Figure 9.. Building a research group.
PhD students currently supervised (A), postdocs currently supervised (B), presence of a research assistant or technician (C) and current size of research group (D) for lecturers (men and women) and research fellows (men and women). Responders were asked to include undergraduates and master’s students when reporting the size of their research group. All categories are expressed as the percentage of respondents within each category.
Figure 10.
Figure 10.. Recruitment of men and women by year.
The gap between the number of men and women appointed as new PIs seems to have narrowed in recent years (with the gap being eight in 2012 and just one in 2017 and 2018), with the very noticeable exception of 2013, when 47 men and 21 women were appointed. A possible explanation for this is discussed in the text.

Publication types