. 2019 Sep 20;14(9):e0222626.
doi: 10.1371/journal.pone.0222626. eCollection 2019.

Morphological, microbiological and ultrastructural aspects of sepsis by Aeromonas hydrophila in Piaractus mesopotamicus

Affiliations

Morphological, microbiological and ultrastructural aspects of sepsis by Aeromonas hydrophila in Piaractus mesopotamicus

Fausto A Marinho-Neto et al. PLoS One. .

Abstract

Aeromonas bacteria can cause an infection characterized by septicemia and is one of the most common pathogens in tropical fish. This disease is responsible for high morbidity and mortality rates, causing considerable losses in aquaculture. Thus, the understanding of its pathophysiology is crucial to develop control strategies of this bacterial infection in farmed fish. This study aimed to characterize early pathological aspects of acute sepsis in pacu (Piaractus mesopotamicus) experimentally infected with Aeromonas hydrophila. A total of 160 juvenile pacus were inoculated intraperitoneally with A. hydrophila (1.78 x 10⁹ CFU/mL) and at 0 (control), 1, 3, 6, and 9 hours post-inoculation (hpi), animals were anesthetized and samples were collected for microbiological, light microscopy and transmission electron microscopy (TEM) analyzes. The results showed the occurrence of hemodynamic alterations, such as hemorrhage and congestion, which were observed mainly after 6 and 9 hpi. It was possible to re-isolate Aeromonas at all sampling times except in control group. However, just after 9 hpi it was possible to find the bacteria in all fish and tissues. Light microscopy analyses revealed a degenerative process, necrosis and vascular damage mainly at 6 and 9 hpi. According to the ultrastructural examination, areas of cellular death were identified in all examined tissues, especially at 6 and 9 hpi. However, the most severe, related to necrosis, were observed after 6 and 9 hpi. The findings suggested that this bacterium spreads in the first hpi through the fish organs, mainly affecting spleen, liver and kidney, causing irreversible lesions at the molecular level.


Conflict of interest statement

The authors have declared that no competing interests exist.

Figures

Fig 1
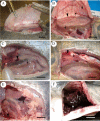
Fig 1. Macroscopic alterations of Piaractus mesopotamicus challenged with Aeromonas hydrophila.
(A) Control (no external changes). (B) Cutaneous haemorrhage (arrows). (C) Hemorrhage at fins (arrow) and operculum (asterisk). (D) Normal gills (arrow). (E) Gill congestion (arrow). (F) Hyphema (arrow). Bars A and B: 4 cm, bars C-F: 1 cm.
Fig 2
Fig 2. Macroscopic alterations of Piaractus mesopotamicus challenged with Aeromonas hydrophila.
(A) Normal celoma wall. (B) Petechial haemorrhage on the coelomic and visceral walls of the organs (arrows), vessel congestion (asterisk) and presence of serum-sanguineous liquid in coelom (arrowhead). (C) Liver (asterisk), spleen (arrowhead) and bowel (arrow) normal. (D) Hepatic congestion and hepatomegaly (arrow), presence of serum-sanguineous liquid in the coelom (arrowhead). (E) Splenic congestion and splenomegaly (arrow), presence of serum-sanguineous liquid in coelom (arrowhead). (F) Hemorrhagic enteritis (white arrow). Bars: 1 cm.
Fig 3
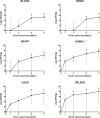
Fig 3. Isolation frequency of Aeromonas hydrophila in tissues of infected Piaractus mesopotamicus.
Vertical columns express the percentages of positive isolation for A. hydrophila (n = 10) at different times after challenged. hpi = hours post inoculation.
Fig 4
Fig 4. Bacterial population in the organs and blood of Piaractus mesopotamicus challenged with Aeromonas hydrophila.
Bacterial count at 0 (control), 1, 3, 6 and 9 hours post-inoculation (hpi) in each organ and blood is expressed in log of colony forming units per gram (CFU/g). The corresponding amount of bacteria for each group represents the median value and the bars its respective range (n = 10). Asterisks represent significant difference (p < 0.05) between the analyzed times and control group (Dunn's test 5%).
Fig 5
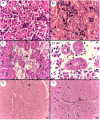
Fig 5. Photomicrograph of control and infected Piaractus mesopotamicus heart and spleen.
(A) Normal cardiac tissue. (B) Necrosis of ventricular cardiomyocytes and aggregation of inflammatory cells (asterisk). (C) Bacterial colonies adhered to the pericardium and presence of inflammatory cells infiltrates surrounding the area (arrow). (D) Normal splenic tissue. (E) Congestion of spleen vessels (arrows). (F) Bacterial colonies adhered to the splenic capsule (asterisk) and presence of leukocyte infiltrates (arrows). Bars: 20 μm, H&E.
Fig 6
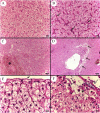
Fig 6. Photomicrograph of control and infected Piaractus mesopotamicus exocrine pancreas.
(A) Normal exocrine pancreatic tissue. (B) Congestion of large vessels (asterisk). (C) Pancreatic necrosis (asterisks) with dilated vessel and presence of leukocytes inside and surrounding tissue (arrows). (D) Bacterial colonies (arrow) and adjacent pancreatic necrosis (asterisk). Bars A-C: 20 μm and bar D: 10 μm, H&E.
Fig 7
Fig 7. Photomicrograph of control and infected Piaractus mesopotamicus kidney and encephalon.
(A) Normal organization of renal tubules. (B) Abundant melanomacrophages accumulation between renal tubules (arrows). (C) Interstitial hemorrhage in renal tissue (asterisk). (D) Necrosis with karyolysis of tubular cell’s nucleus (arrows) and loss of cytoplasmic delimitation between renal tubule epithelial cells (asterisk). (E) Capillary of normal nervous tissue without congestion (arrow). (F) Discrete capillary congestion in nervous tissue (arrow). Bars A and D: 10 μm, bars B, C, E and F: 20 μm, H&E.
Fig 8
Fig 8. Photomicrograph of control and infected Piaractus mesopotamicus liver.
(A) Control liver tissue. (B) Congestion of hepatic sinusoids (arrows). (C) Hepatic hemorrhage (asterisk). (D) Hepatic necrosis and disorganization of hepatic tissue architecture in perivascular region (arrows). (E) Normal hepatic capsule (arrow). (F) Bacterial colonies adhered to the hepatic capsule (arrow) with leukocyte infiltrate and hepatocyte necrosis (asterisk). Bars A and B: 20 ​​μm, bar C: 50 μm, bar D: 100 μm and bars E and F: 10 μm, H&E.
Fig 9
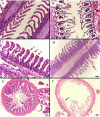
Fig 9. Photomicrograph of control and infected Piaractus mesopotamicus gill and intestine.
(A) Gill filaments and normal secondary lamellae tissue. (B) Detachment of epithelial cells from the lamella base that are thinned (arrows) and congestion of a large vessel (asterisk). (C) Congestion of secondary lamellae (arrows). (D) Secondary lamella edema (arrow). (E) Normal villi and intestinal mucosa (arrow). (F) Necrosis of the villi and intestinal mucosa (arrow). Bars A-C: 20 μm, bar D: 50 μm and bars E and F: 200 μm, H&E.
Fig 10
Fig 10. Transmission electron microscopy images of control and infected spleen cells of Piaractus mesopotamicus.
(A) Normal nucleus (N) in a lymphocyte. (B) Nuclei in karyolysis (N) in a lymphocyte. (C) Pynotic nucleus (N) in a lymphocyte. (D) Nucleus in karyorrhexis (N) in a lymphocyte. Bars: 1 μm.
Fig 11
Fig 11. Transmission electron microscopy images of control and infected kidney and heart cells of Piaractus mesopotamicus.
(A) Normal renal tubule cell showing mitochondria (MT), endoplasmic reticulum (ER) and nucleus (N). (B) Infected renal tubule cell with loss of membrane integrity and dissolution of mitochondria (MT) and endoplasmic reticulum (ER). (C) Normal cardiomyocytes showing endoplasmic reticulum (ER) with adhered ribosomes (arrows). (D) Dilatation and detachment of ribosomes (arrows) from endoplasmic reticulum (ER) of infected cardiomyocytes. Bars: 1 μm.
Fig 12
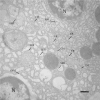
Fig 12. Transmission electron microscopy image of infected kidney cells of Piaractus mesopotamicus.
A renal tubule cell is showed in the upper right portion of the image, with normal nucleus (N), nuclear membrane (NM) and endoplasmic reticulum (ER). Separated by the cytoplasmic membrane (CM), another renal tubule cell located in the lower left portion of the image, shows endoplasmic reticulum edema (SER), nuclear membrane (SNM) and mitochondria (SMT). Bar: 1 μm.
Fig 13
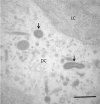
Fig 13. Transmission electron microscopy image of infected splenic hemopoietic precursor cells of Piaractus mesopotamicus.
Bacteria presence (arrows) inside a compromised cytoplasm of a dead cell or in the process of death (DC). A normal cytoplasm of a living cell (LC) is shown for comparison. Bar: 1 μm.
Fig 14
Fig 14. Transmission electron microscopy image of infected kidney cells of Piaractus mesopotamicus.
Phagocytosis process of the products of erythrocyte degradation, note the presence of a melanomacrophage (arrow) probably engulfing the products of a degraded erythrocyte (DE) and forming siderosomes (arrowhead) inside its cytoplasm, it also can be seen non-degraded erythrocytes (NDE) and renal tubule cells (RTC). Bar: 1 μm.

References

    1. FAO (Food and Agriculture Organization of the United Nations). The State of World Fisheries and Aquaculture 2016. Contributing to food security and nutrition for all. Rome. 2016;200p.
    1. IBGE (Instituto Brasileiro de Geografia e Estatística). Produção Pecuária Municipal. 2015;43:1–49.
    1. Moraes FR, Martins ML. Condições pré-disponentes e principais enfermidades de teleósteos em piscicultura intensiva In: Cyrino JEP, Urbinati EC, Fracalossi D M, Castangnolli N, editors. Tópicos especiais em piscicultura de água doce tropical intensiva. São Paulo: TecArt; 2004. p. 343–86.
    1. Holliman A. The veterinary approach to trout In: Brown L, editor. Aquaculture for veterinarians: fish husbandry and medicine. Oxford: Pergamon Press; 1993. p. 223–47.
    1. Cyrino JEP, Urbinati EC, Fracalossi DM, Castagnolli N. Tópicos Especiais em Piscicultura de Água Doce Tropical Intensiva. São Paulo: TecArte; 2004. p. 533.

Publication types

MeSH terms