. 2019 Nov 4;64(21):215020.
doi: 10.1088/1361-6560/ab467f.

A real-time Monte Carlo tool for individualized dose estimations in clinical CT

Affiliations

A real-time Monte Carlo tool for individualized dose estimations in clinical CT

Shobhit Sharma et al. Phys Med Biol. .

Abstract

The increasing awareness of the adverse effects associated with radiation exposure in computed tomography (CT) has necessesitated the quantification of dose delivered to patients for better risk assessment in the clinic. The current methods for dose quantification used in the clinic are approximations, lacking realistic models for the irradiation conditions utilized in the scan and the anatomy of the patient being imaged, which limits their relevance for a particular patient. The established gold-standard technique for individualized dose quantification uses Monte Carlo (MC) simulations to obtain patient-specific estimates of organ dose in anatomically realistic computational phantoms to provide patient-specific estimates of organ dose. Although accurate, MC simulations are computationally expensive, which limits their utility for time-constrained applications in the clinic. To overcome these shortcomings, a real-time GPU-based MC tool based on FDA's MC-GPU framework was developed for patient and scanner-specific dosimetry in the clinic. The tool was validated against (1) AAPM's TG-195 reference datasets and (2) physical measurements of dose acquired using TLD chips in adult and pediatric anthropomorphic phantoms. To demonstrate its utility towards providing individualized dose estimates, it was integrated with an automatic segmentation method for generating patient-specific models, which were then used to estimate patient- and scanner-specific organ doses for a select population of 50 adult patients using a clinically relevant CT protocol. The organ dose estimates were compared to corresponding dose estimates from a previously validated MC method based on Penelope. The dose estimates from our MC tool agreed within 5% for all organs (except thyroid) tabulated by TG-195 and within 10% for all TLD locations in the adult and pediactric phantoms, across all validation cases. Compared against Penelope, the organ dose estimates agreed within 3% on average for all organs in the patient population study. The average run duration for each patient was estimated at 23.79 s, representing a significant speedup (~700×) over existing non-parallelized MC methods. The accuracy of dose estimates combined with a significant improvement in execution times suggests a feasible solution utilizing the proposed MC tool for real-time individualized dosimetry in the clinic.


Figures

Figure 1.
Figure 1.
A simple schematic for the GPU-based MC tool developed in this study. The photons are generated at the source and filtered with a scanner-specific bowtie filter using a probability matrix defining the post-bowtie irradiation field. In case of TCM, the number of photons generated at the source is modulated according to the attenuation profile of the phantom. The photons are then tracked through the phantom to obtain an estimate for the dose absorbed in each voxel.
Figure 2.
Figure 2.
Dose measurements in (a) a pediatric 5 y.o. phantom and (b) an adult male phantom performed on the Definition Flash (Siemens Healthineers, Germany) scanner. (c) Each of the phantoms was made of 25 mm axial slices with through-holes at organ locations for TLD placement.
Figure 3.
Figure 3.
Sample slices from the CAP CT image dataset (top) for one of the patients used in this study along with corresponding masks (bottom) for automatically segmented organs used for generating models of patient-specific anatomy. The models constructed from imaging datasets of the patient population were simulated with the MC tool developed in this study to demonstrate a framework for individualized dose estimations in CT.
Figure 4.
Figure 4.
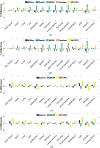
Percentage difference between the energy deposited per photon in different organs as estimated by the various MC packages (EGSnrc, Geant4, MCNP, Penelope and MC-GPU) and the mean energy deposition value as reported by AAPM’s TG-195. The percentage differences for thyroid, thymus and adrenals were excluded from the plot due to space constraints. (a) Source configuration: discrete, 56.4 keV (monoenergetic); projection Angle: 0°. (b) Source configuration: discrete, 120 kV (Bremsstrahlung); projection Angle: 0°. (c) Source configuration: random, 56.4 keV (monoenergetic). (d) Source configuration: random, 120 kV (Bremsstrahlung).
Figure 5.
Figure 5.
Measured and simulated doses (for all tube starting angles) in selected inserts for a (a) pediatric 5 y.o. phantom scanned at (a) 80 kV and (b) 120 kV, and an adult male phantom scanned at (c) 80 kV and (d) 120 kV using a CAP protocol. The error bars represent the standard error associated with the dose values. The high dose values are a result of the high tube current and low pitch used to reduce the uncertainty in absorbed dose measured by the TLDs. (a) Phantom: pediatric (5 y.o.), tube voltage: 80 kV. (b) Phantom: pediatric (5 y.o.), tube voltage: 120 kV. (c) Phantom: adult, tube voltage: 80 kV. (d) Phantom: adult, tube voltage: 120 kV.
Figure 6.
Figure 6.
Individualized organ dose estimates (in units of mGy/100 mAs) plotted against average CAP diameter for a select population of 50 adult patient models simulated using a clinical CAP protocol. The dose estimates from the GPU-based MC tool proposed in this study were also compared to estimates from a previously validated tool based on Penelope as an additional validation step.
Figure 7.
Figure 7.
Run durations (in seconds) for simulating a clinical CAP protocol for all 50 patients in the patient population used for this study. The horizontal red line represents the runtime averaged across all patients, which was used for the speedup computation summarized in table 3.

Similar articles

Cited by

References

    1. Abadi E, Harrawood B, Sharma S, Kapadia A, Segars W P and Samei E 2018. DukeSim: a realistic, rapid, and scanner-specific simulation framework in computed tomography IEEE Trans. Med. Imaging 38 1457–65 - PMC - PubMed
    1. Badal A and Badano A 2009. Accelerating Monte Carlo simulations of photon transport in a voxelized geometry using a massively parallel graphics processing unit Med. Phys 36 4878–80 - PubMed
    1. Boone J M and Hernandez A M 2017. The effect of iodine-based contrast material on radiation dose at CT: it’s complicated Radiology 283 624–7 - PMC - PubMed
    1. Brink J A and Morin R L 2012. Size-specific dose estimation for CT: how should it be used and what does it mean? Radiology 265 666–8 - PubMed
    1. Chen W, Kolditz D, Beister M, Bohle R and Kalender W A 2012. Fast on-site Monte Carlo tool for dose calculations in CT applications Med. Phys 39 2985–96 - PubMed

Publication types