. 2019 Sep 18;8(9):413.
doi: 10.3390/antiox8090413.

Glutathione Induced Immune-Stimulatory Activity by Promoting M1-Like Macrophages Polarization via Potential ROS Scavenging Capacity

Affiliations

Glutathione Induced Immune-Stimulatory Activity by Promoting M1-Like Macrophages Polarization via Potential ROS Scavenging Capacity

Da Hye Kwon et al. Antioxidants (Basel). .

Abstract

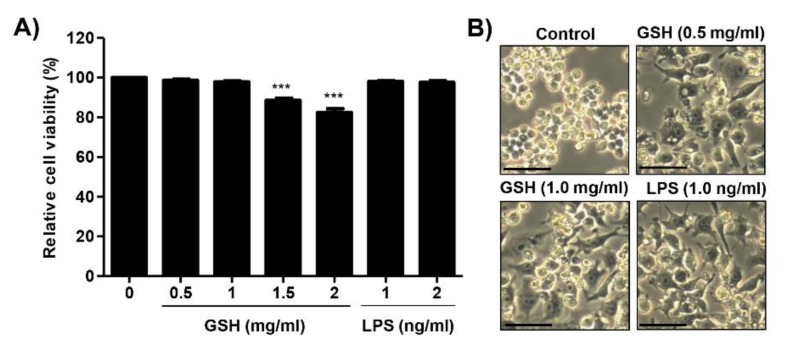
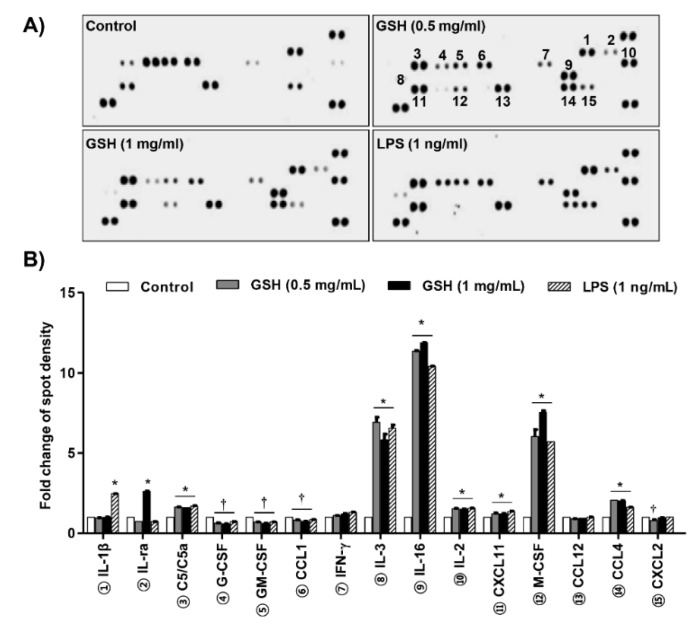
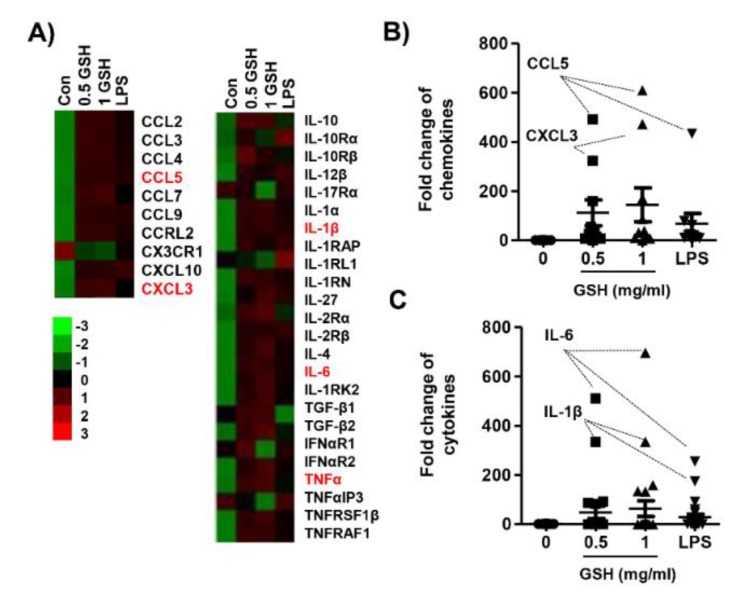
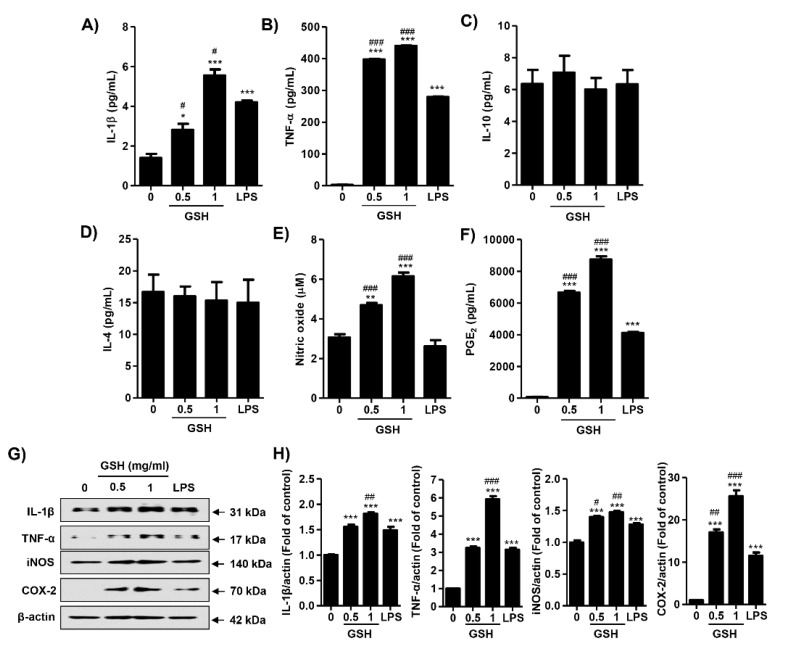
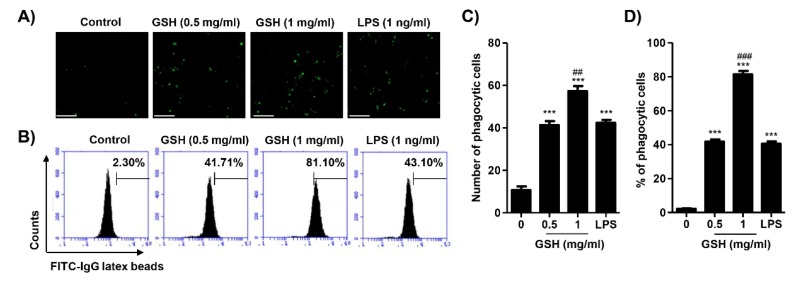
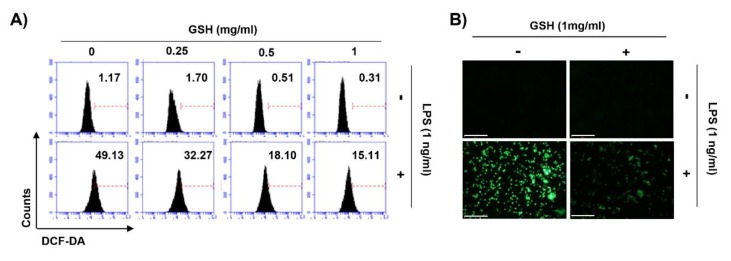
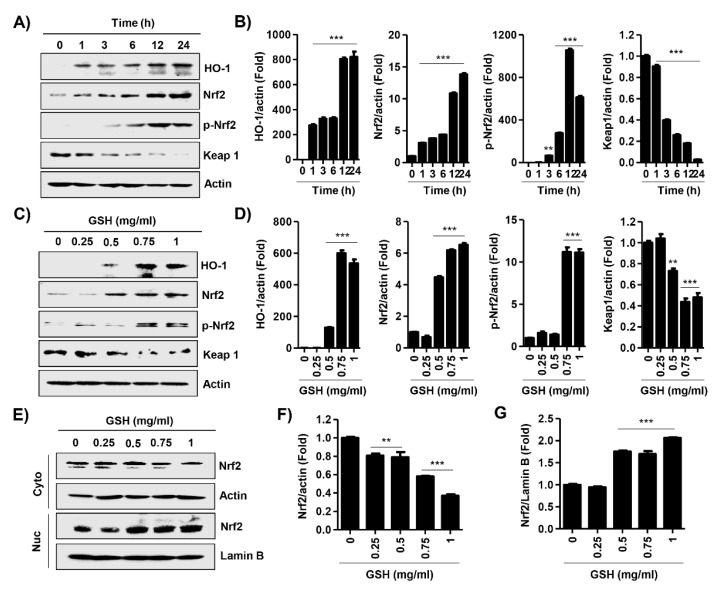
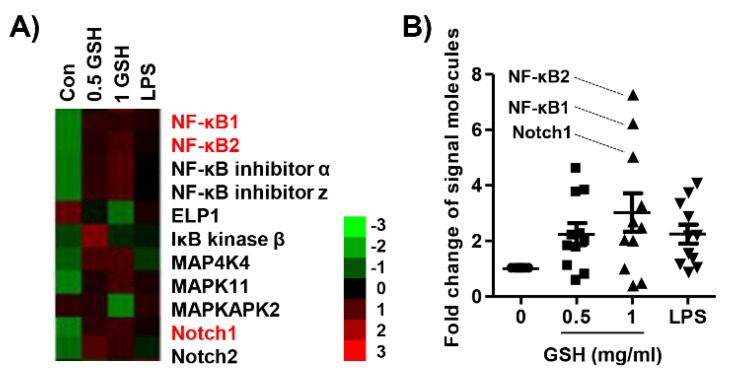
The present study investigated the immunomodulatory activity of reduced glutathione (GSH) by assessment of the macrophage polarization (MP)-mediated immune response in RAW 264.7 cells. Furthermore, we identified the signal pathway associated with immune regulation by GSH. The expressions of MP-associated cytokines and chemokines were assessed using cytokine array, nCounter Sprit platform, ELISA and immunoblotting. Phagocytosis activity and intracellular reactive oxygen species (ROS) generation were measured using fluorescence-activated cell sorter. As results of the cytokine array and nCounter gene array, GSH not only up-regulated pro-inflammatory cytokines, including interleukins and tumor necrosis factor-α, but also overexpressed neutrophil-attracting chemokines. Furthermore, GSH significantly stimulated the production of immune mediators, including nitric oxide and PGE2, as well as phagocytosis activity through nuclear factor kappa B activation. In addition, GSH significantly decreased LPS-induced ROS generation, which was associated with an activation of nuclear factor erythroid-derived 2-related factor 2 (Nrf2)/ heme oxygenease-1 (HO-1) signaling pathway. Our results suggest that GSH has potential ROS scavenging capacity via the induction of Nrf2-mediated HO-1, and immune-enhancing activity by regulation of M1-like macrophage polarization, indicating that GSH may be a useful strategy to increase the human defense system.

Keywords: antioxidant; glutathione; heme oxygenase-1; immune response; inflammatory cytokines; macrophage polarization; reactive oxygen species.


Conflict of interest statement

The authors have not any conflict of interest.

Figures

Figure 1
Figure 1
Effects of reduced glutathione on the cell viability in RAW 264.7 macrophages. Cells were treated with different concentration of GSH (0.5 to 2 mg/mL) and LPS of 1 and 2 ng/mL for 24 h. (A) Cell viability was measured by MTT assay. Data are expressed as the mean ± SD (n = 3). The statistical analyses were conducted using analysis of variance (ANOVA-Tukey’s post hoc test) between groups. *** p < 0.001 when compared to control. (B) The representative morphological changes of cells were taken using an inverted microscope (Scale bar; 20 μm).
Figure 2
Figure 2
Effects of GSH on MP-derived cytokines and chemokines. Protein array analysis demonstrating the effects of GSH on cytokine profile. Cells were treated with the indicated concentrations of GSH (0.5 to 2 mg/mL) and LPS of 1 and 2 ng/mL for 24 h. The supernatants were then analyzed using the cytokine array. (A) Spots with the most prominent differentially regulated cytokines are identified by circles. (B) Quantitative analysis of spots on the cytokine array membrane. Quantitative analysis of mean pixel density was performed using the ImageJ® software, and data are the mean ± SD of three independent experiments. * p < 0.05 and † p < 0.05 indicate up-regulation and down-regulation of significant differences compared to control group, respectively.
Figure 3
Figure 3
Heatmap of candidate gene expression for MP using NanoString nCounter® miRNA Expression Assays. The cells were treated with GSH or LPS, and then incubated for 24 h. Total RNA was collected by collecting the cells, and hybridization was performed using a reporter probe and a capture probe. After digital analysis through nCounter nanostring assay (NCT-120), the raw data was normalized using the housekeeping gene, and the gene expression change was represented by the fold change value. (A) Heatmap representing differentially expressed genes with fold-change cutoff of 0.5 and 2 (red and green, respectively). (B) and (C) Expression of each gene was indicated as fold change compared with control. Table 1 shows the abbreviations and designations defined.
Figure 4
Figure 4
Effects of GSH on most-potent cytokines, NO and PGE2 production in RAW 264.7 macrophages. Cells were treated with GSH of 0.5 to 1 mg/mL and 1 ng/mL LPS, and then incubated for 24 h. The production of IL-1β (A), TNF-α (B), IL-4 (C) and IL-10 (D) on cell supernatant were measured by ELIAS kits. (E) The amounts of NO were measured using the Griess reagent in culture supernatant. (F) The levels of PGE2 were measured by an ELIAS kit. (G) The cell lysates were immunostained for IL-1β, TNF-α, iNOS, and COX-2. Actin was used as an internal control. Images of the membranes were photographed with the Fusion Fx image acquisition system. (H) Relative band density was measured by ImageJ. All data are expressed as the mean ± SD (n = 3). The statistical analyses were conducted using analysis of variance (ANOVA-Tukey’s post hoc test) between groups. * p < 0.05 ** p < 0.01 and *** p < 0.001 indicates significant difference compared to the non-treated control group. # p < 0.05, ## p < 0.01 and ### p < 0.001 when compared to LPS treatment.
Figure 5
Figure 5
Effects of GSH on phagocytosis activity in RAW 264.7 macrophages. Cells were treated with GSH of 0.5 to 1 mg/mL and 1 ng/mL LPS, and for 24 h. (A) The phagocytosis activity was visualized by fluorescence microscopy. Scale bar; 200 μm. (B) The fluorescence intensity was counted and indicated as the number of phagocytic cells per field of view. (C) The phagocytosis capacity of GSH was gauged by flow cytometer. The images shown are representative of at least three independent experiments. (D) The statistical analyses were conducted using analysis of variance (ANOVA-Tukey’s post hoc test) between groups. *** p < 0.001 when compared to control. ## p < 0.01 and ### p < 0.001 when compared to LPS treatment.
Figure 6
Figure 6
Effects of GSH on intracellular ROS generation in RAW 264.7 macrophages. Cells were pretreated with various concentrations of GSH for 1 h, and then stimulated with LPS (1 ng/mL) for 6 h. (A) After staining with DCF-DA, DCF fluorescence was monitored by flow cytometer. Results are presented as the means of two independent experiments. (B) Images were obtained by fluorescence microscopy (scale bar; 200 μm). The images shown are representative of at least three independent experiments.
Figure 7
Figure 7
Effects of GSH on Keap1/Nrf2 activation in RAW 264.7 macrophages. (A,C) Cells were incubated with 1 mg/mL GSH for the indicated periods, or with the indicated concentration of GSH for 24 h. Expression of Nrf2, HO-1, and Keap1 was determined by Western blot analysis with total cell lysates. Actin was used as an internal control. (B,D) Relative band density was measured by ImageJ. (E) Cells were incubated with the indicated concentration of GSH for 24 h. Expression of Nrf2 was determined by Western blot analysis with cytosol and nuclear fraction. Actin and Lamin B were used as an internal control for cytosol and nuclear, respectively. (F,G) Relative band density for Nrf2 expression of cytosol and nuclear fraction was measured by ImageJ. All data are the means ± SD (n = 3). The statistical analyses were conducted using analysis of variance (ANOVA-Tukey’s post hoc test) between groups. ** p < 0.01 and *** p < 0.001 indicates significant difference compared to the non-treated control group.
Figure 8
Figure 8
Effects of GSH on NF-κB signaling systems in RAW 264.7 macrophages. Cells were treated with GSH of 0.5 to 1 mg/mL and 1 ng/mL LPS, and for 24 h. Total RNA was collected by collecting the cells, and hybridization was performed using a reporter probe and a capture probe. After digital analysis through nCounter nanostring assay (NCT-120), the raw data was normalized using the housekeeping gene, and the gene expression change was represented by the fold change value. (A) Heatmap representing differentially expressed genes with fold-change cutoff of 0.5 and 2 (red and green, respectively). (B) The expression of each gene was indicated as fold change compared with control. Table 1 shows the abbreviations and designations defined.

References

    1. Carrillo J.L.M., Garcia F.P.C., Coronado O.G., Garcia M.A.M., Cordero J.F.C. Physiology and pathology of innate immune response against pathogens. In: Rezaei N., editor. Physiology and Pathology of Immunology. IntechOpen Ltd.; London, UK: 2017. pp. 99–134. - DOI
    1. Van Rooijen N., Wijburg O.L., van den Dobbelsteen G.P., Sanders A. Macrophages in host defense mechanisms. Curr. Top. Microbiol. Immunol. 1996;210:159–165. - PubMed
    1. Mosser D.M., Edwards J.P. Exploring the full spectrum of macrophage activation. Nat. Rev. Immunol. 2008;8:958–969. doi: 10.1038/nri2448. - DOI - PMC - PubMed
    1. Murray P.J., Wynn T.A. Protective and pathogenic functions of macrophage subsets. Nat. Rev. Immunol. 2011;11:723–737. doi: 10.1038/nri3073. - DOI - PMC - PubMed
    1. Gordon S., Martinez F.O. Alternative activation of macrophages: Mechanism and functions. Immunity. 2010;32:593–604. doi: 10.1016/j.immuni.2010.05.007. - DOI - PubMed