

ALK and RET Inhibitors Promote HLA Class I Antigen Presentation and Unmask New Antigens within the Tumor Immunopeptidome
- PMID: 31540894
- PMCID: PMC6891198
- DOI: 10.1158/2326-6066.CIR-19-0056
ALK and RET Inhibitors Promote HLA Class I Antigen Presentation and Unmask New Antigens within the Tumor Immunopeptidome
Abstract
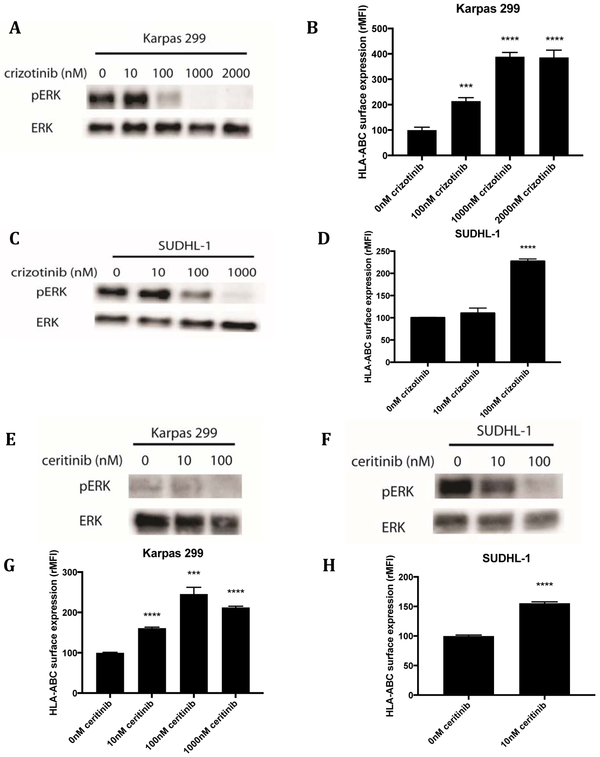
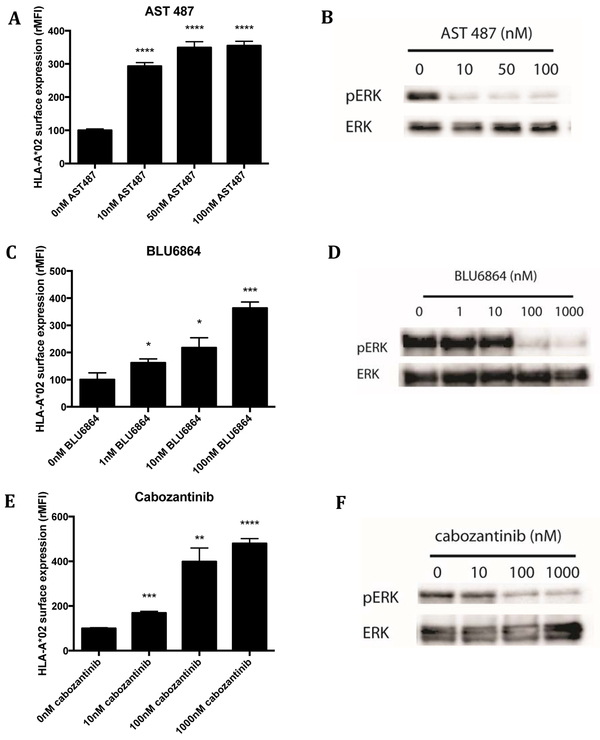
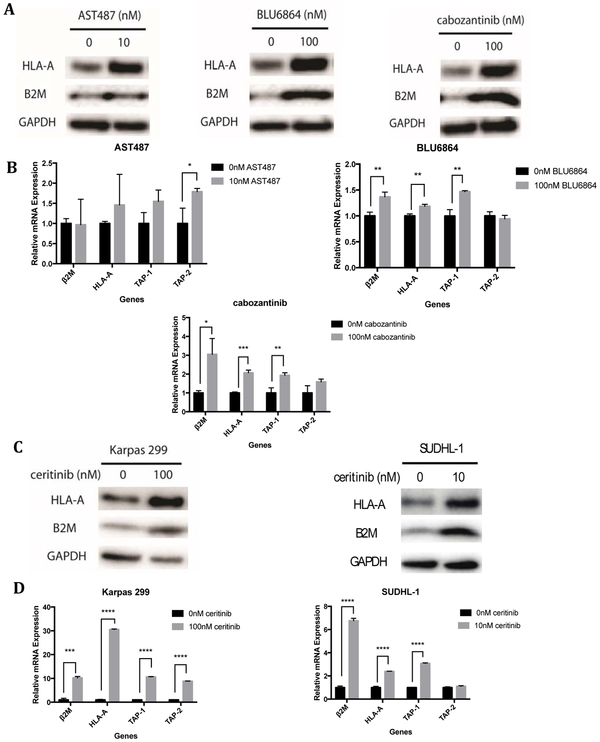
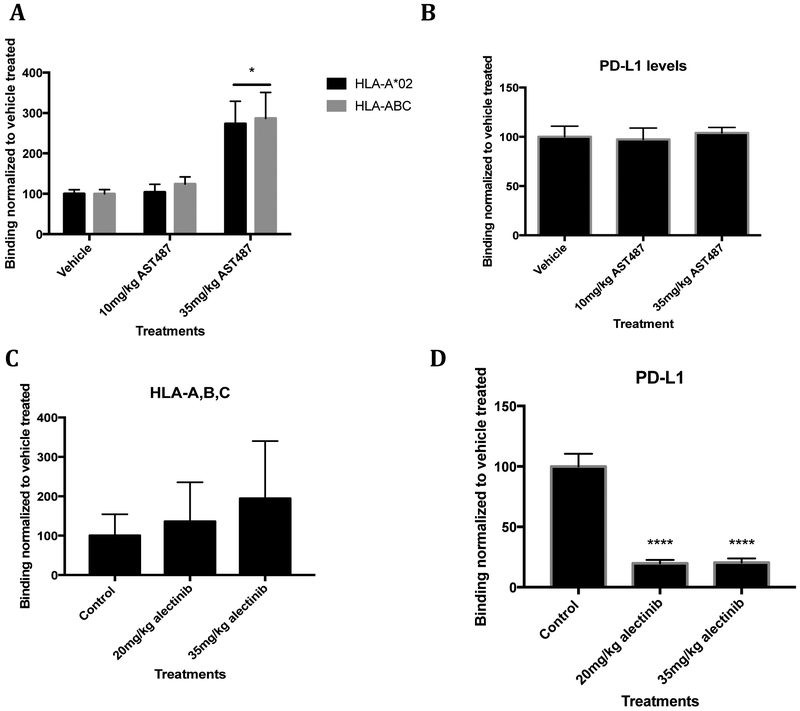
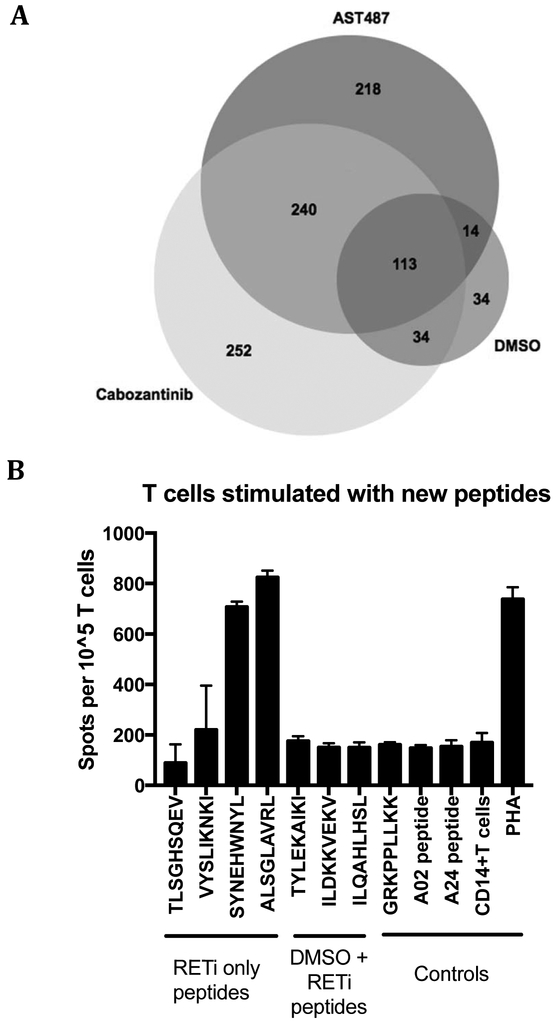
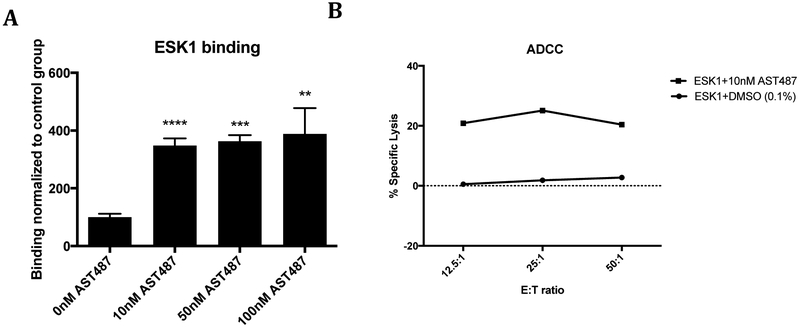
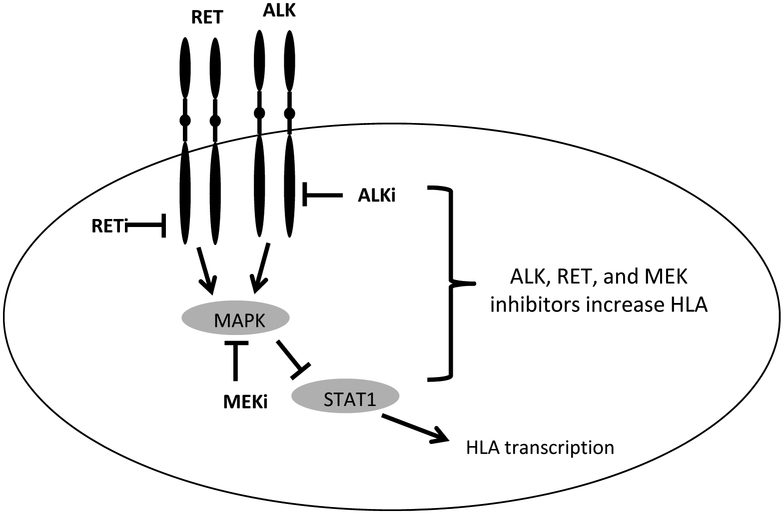
T-cell immunotherapies are often thwarted by the limited presentation of tumor-specific antigens abetted by the downregulation of human leukocyte antigen (HLA). We showed that drugs inhibiting ALK and RET produced dose-related increases in cell-surface HLA in tumor cells bearing these mutated kinases in vitro and in vivo, as well as elevated transcript and protein expression of HLA and other antigen-processing machinery. Subsequent analysis of HLA-presented peptides after ALK and RET inhibitor treatment identified large changes in the immunopeptidome with the appearance of hundreds of new antigens, including T-cell epitopes associated with impaired peptide processing (TEIPP) peptides. ALK inhibition additionally decreased PD-L1 levels by 75%. Therefore, these oncogenes may enhance cancer formation by allowing tumors to evade the immune system by downregulating HLA expression. Altogether, RET and ALK inhibitors could enhance T-cell-based immunotherapies by upregulating HLA, decreasing checkpoint blockade ligands, and revealing new, immunogenic, cancer-associated antigens.
©2019 American Association for Cancer Research.
Figures
Similar articles
-
TEIPP antigens for T-cell based immunotherapy of immune-edited HLA class Ilow cancers.Mol Immunol. 2019 Sep;113:43-49. doi: 10.1016/j.molimm.2018.03.029. Epub 2018 Apr 4. Mol Immunol. 2019. PMID: 29627136 Review.
-
Pharmacological inhibitors of anaplastic lymphoma kinase (ALK) induce immunogenic cell death through on-target effects.Cell Death Dis. 2021 Jul 16;12(8):713. doi: 10.1038/s41419-021-03997-x. Cell Death Dis. 2021. PMID: 34272360 Free PMC article.
-
IFNγ Modulates the Immunopeptidome of Triple Negative Breast Cancer Cells by Enhancing and Diversifying Antigen Processing and Presentation.Front Immunol. 2021 Apr 22;12:645770. doi: 10.3389/fimmu.2021.645770. eCollection 2021. Front Immunol. 2021. PMID: 33968037 Free PMC article.
-
Immunopeptidomics of colorectal cancer organoids reveals a sparse HLA class I neoantigen landscape and no increase in neoantigens with interferon or MEK-inhibitor treatment.J Immunother Cancer. 2019 Nov 18;7(1):309. doi: 10.1186/s40425-019-0769-8. J Immunother Cancer. 2019. PMID: 31735170 Free PMC article.
-
Background and rationale of the eXalt3 trial investigating X-396 in the treatment of ALK+ non-small-cell lung cancer.Future Oncol. 2018 Aug;14(18):1781-1787. doi: 10.2217/fon-2017-0619. Epub 2018 Mar 6. Future Oncol. 2018. PMID: 29506392 Review.
Cited by
-
Enhancing immunotherapy through PD-L1 upregulation: the promising combination of anti-PD-L1 plus mTOR inhibitors.Mol Oncol. 2025 Jan;19(1):151-172. doi: 10.1002/1878-0261.13699. Epub 2024 Sep 11. Mol Oncol. 2025. PMID: 39258533 Free PMC article.
-
Host Interactions with Engineered T-cell Micropharmacies.Cancer Immunol Res. 2023 Sep 1;11(9):1253-1265. doi: 10.1158/2326-6066.CIR-22-0879. Cancer Immunol Res. 2023. PMID: 37379366 Free PMC article.
-
Current advances in immunotherapy for atypical teratoid rhabdoid tumor (ATRT).Neurooncol Pract. 2023 Jan 28;10(4):322-334. doi: 10.1093/nop/npad005. eCollection 2023 Aug. Neurooncol Pract. 2023. PMID: 37457224 Free PMC article. Review.
-
Beneficial autoimmunity improves cancer prognosis.Nat Rev Clin Oncol. 2021 Sep;18(9):591-602. doi: 10.1038/s41571-021-00508-x. Epub 2021 May 11. Nat Rev Clin Oncol. 2021. PMID: 33976418 Review.
-
Empirical and Rational Design of T Cell Receptor-Based Immunotherapies.Front Immunol. 2021 Jan 25;11:585385. doi: 10.3389/fimmu.2020.585385. eCollection 2020. Front Immunol. 2021. PMID: 33569049 Free PMC article. Review.
References
-
- Thorsby E, “The role of HLA in T cell activation,” Hum. Immunol, vol. 9, no. 1, pp. 1–7, 1984. - PubMed
-
- Rosenberg SA, “A new era for cancer immunotherapy based on the genes that encode cancer antigens,” Immunity, vol. 10, no. 3 pp. 281–287, 1999. - PubMed
-
- Andersen MH, Schrama D, Thor Straten P, and Becker JC, “Cytotoxic T cells,” Journal of Investigative Dermatology, vol. 126, no. 1 pp. 32–41, 2006. - PubMed
-
- Demanet C et al., “Down-regulation of HLA-A and HLA-Bw6, but not HLA-Bw4, allospecificities in leukemic cells: An escape mechanism from CTL and NK attack?,” Blood, vol. 103, no. 8, pp. 3122–3130, 2004. - PubMed
Publication types
MeSH terms
Substances
Grants and funding
LinkOut - more resources
Full Text Sources
Other Literature Sources
Molecular Biology Databases
Research Materials
