. 2019 Oct 16;6(5):ENEURO.0172-19.2019.
doi: 10.1523/ENEURO.0172-19.2019. Print 2019 Sep/Oct.

Removal of the Potassium Chloride Co-Transporter from the Somatodendritic Membrane of Axotomized Motoneurons Is Independent of BDNF/TrkB Signaling But Is Controlled by Neuromuscular Innervation

Affiliations

Removal of the Potassium Chloride Co-Transporter from the Somatodendritic Membrane of Axotomized Motoneurons Is Independent of BDNF/TrkB Signaling But Is Controlled by Neuromuscular Innervation

Erica Tracey Akhter et al. eNeuro. .

Abstract

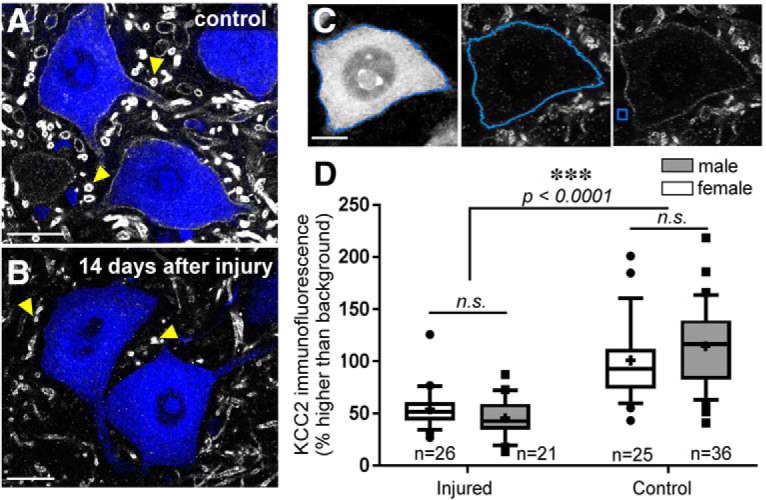
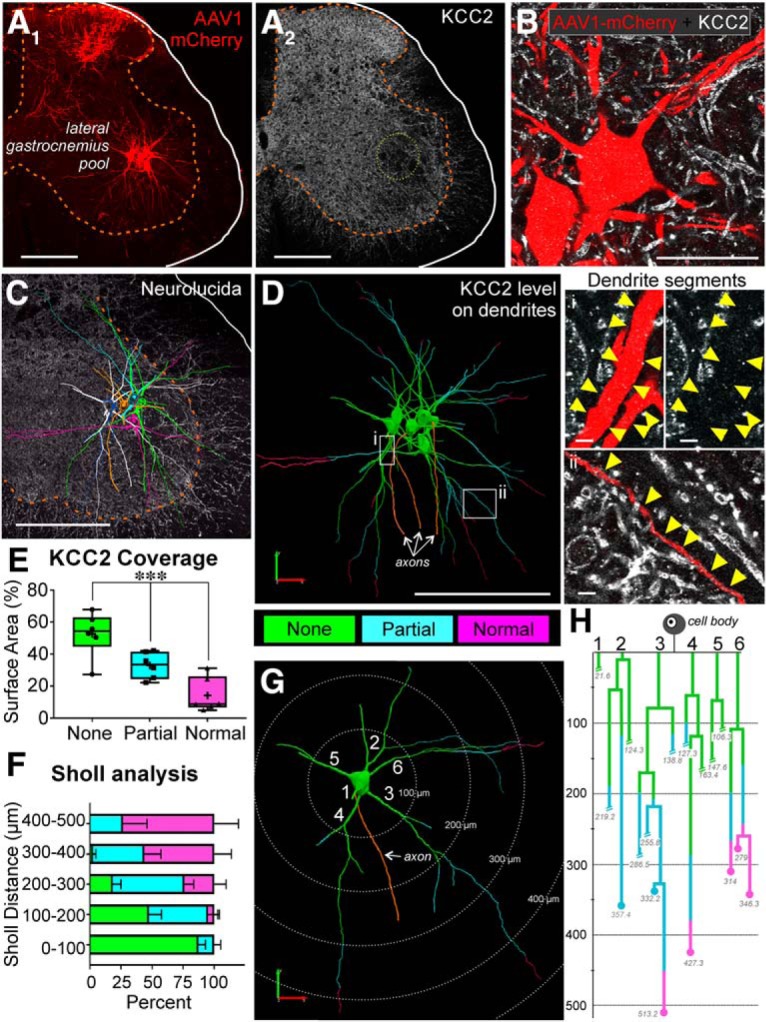
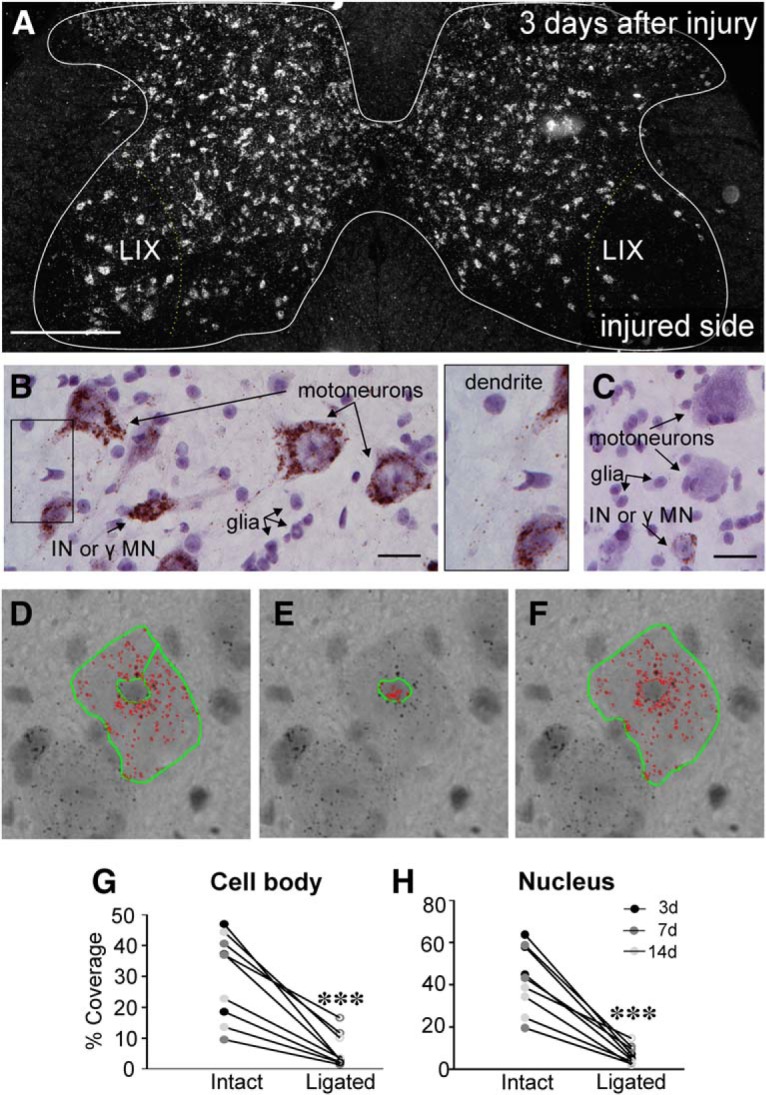
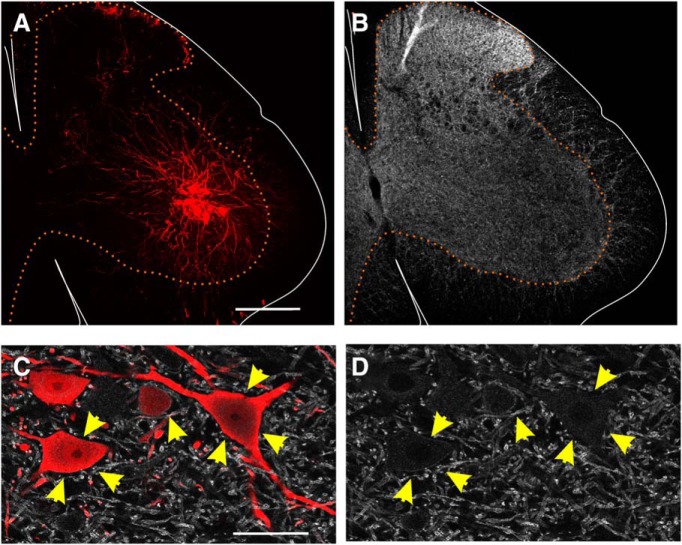
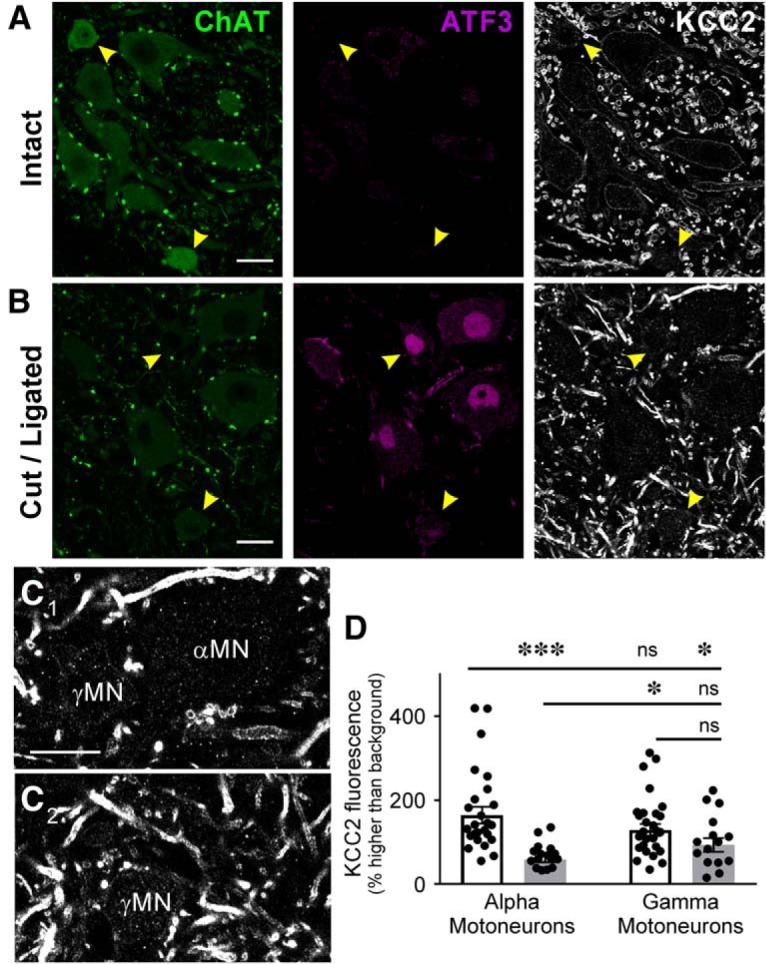
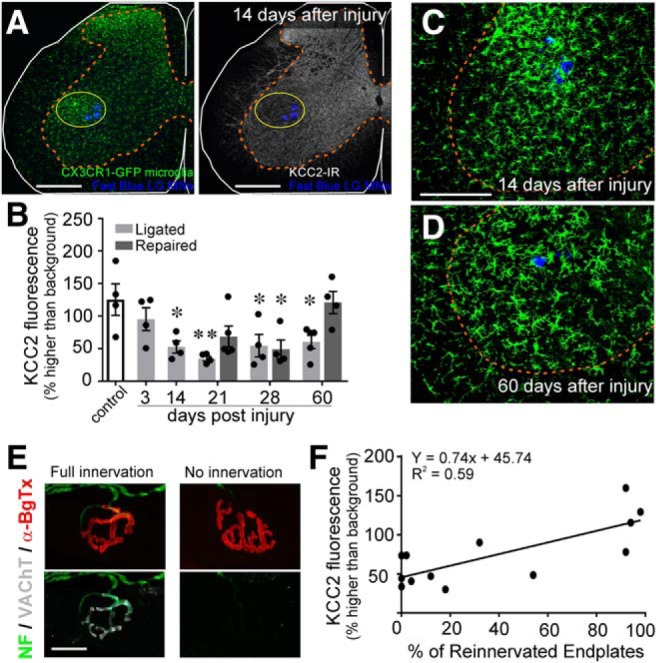
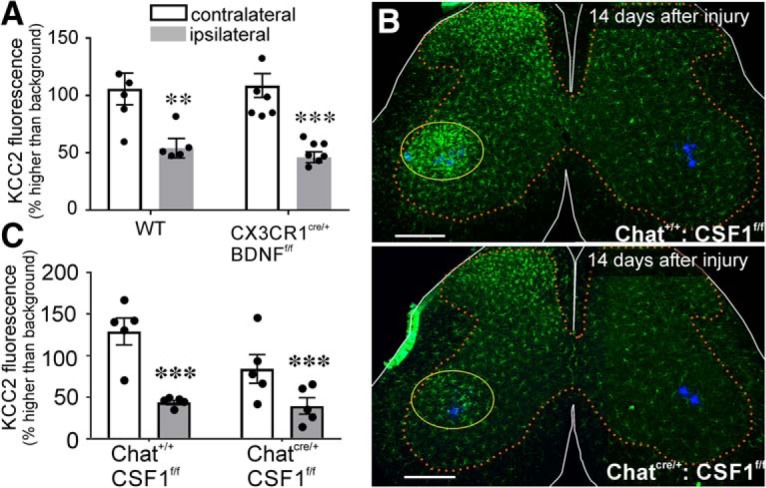
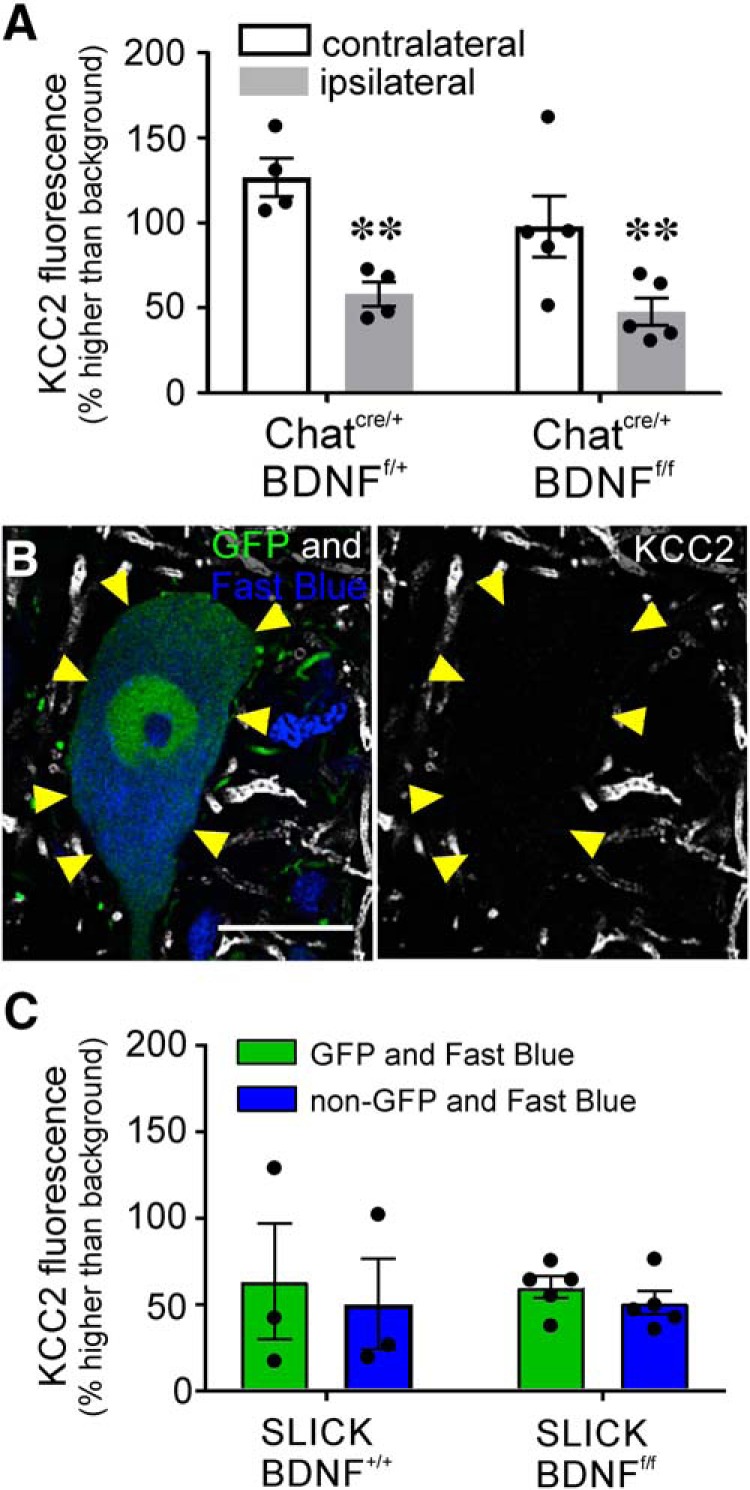
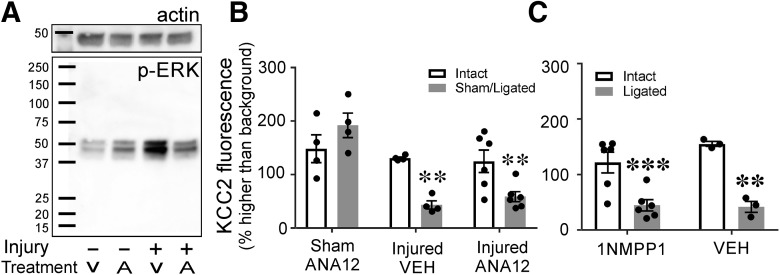
The potassium-chloride cotransporter (KCC2) maintains the low intracellular chloride found in mature central neurons and controls the strength and direction of GABA/glycine synapses. We found that following axotomy as a consequence of peripheral nerve injuries (PNIs), KCC2 protein is lost throughout the somatodendritic membrane of axotomized spinal cord motoneurons after downregulation of kcc2 mRNA expression. This large loss likely depolarizes the reversal potential of GABA/glycine synapses, resulting in GABAergic-driven spontaneous activity in spinal motoneurons similar to previous reports in brainstem motoneurons. We hypothesized that the mechanism inducing KCC2 downregulation in spinal motoneurons following peripheral axotomy might be mediated by microglia or motoneuron release of BDNF and TrkB activation as has been reported on spinal cord dorsal horn neurons after nerve injury, motoneurons after spinal cord injury (SCI), and in many other central neurons throughout development or a variety of pathologies. To test this hypothesis, we used genetic approaches to interfere with microglia activation or delete bdnf from specifically microglia or motoneurons, as well as pharmacology (ANA-12) and pharmacogenetics (F616A mice) to block TrkB activation. We show that KCC2 dysregulation in axotomized motoneurons is independent of microglia, BDNF, and TrkB. KCC2 is instead dependent on neuromuscular innervation; KCC2 levels are restored only when motoneurons reinnervate muscle. Thus, downregulation of KCC2 occurs specifically while injured motoneurons are regenerating and might be controlled by target-derived signals. GABAergic and glycinergic synapses might therefore depolarize motoneurons disconnected from their targets and contribute to augment motoneuron activity known to promote motor axon regeneration.

Keywords: GABA; KCC2; excitability; nerve injury; neuromuscular junction; regeneration.


Figures

Figure 1.
Figure 1.
KCC2 is depleted on motoneuron somata 14 d after injury. A, B, LG motoneurons of mice labeled with FB; KCC2-IR in white: sham (A) and cut/ligated (B). The axotomized motoneurons lose KCC2 protein on the soma membrane, but in some dendrites in the neuropil, KCC2 is preserved (yellow arrows). Scale bar = 25 μm. C, Images of a sham-injured LG motoneuron show the method of KCC2 quantification. Scale bar = 10 μm. Left, Sham-injured LG motoneuron filled with FB. The blue line marks the automatic tracing of the soma. Middle, Image of the KCC2 channel of same motoneuron with the cell membrane line from which fluorescent intensity is measured. Right, KCC2 immunofluorescence with example 9 μm2 of area from which background fluorescence was measured. D, Results of quantitative measures of motoneuron soma surface KCC2-IR in male and female mice 14 d after sciatic ligation. No significant sex differences in KCC2-IR were found; only injury state predicted KCC2 levels (Table 4). Box plots represent 25th, median, and 75th percentiles; whiskers = 10th and 90th percentiles; outliers = data points outside whiskers. Crosses = mean; n = number of animals. Each animal estimate was obtained from 10 MNs. n.s. = not significant.
Figure 2.
Figure 2.
KCC2 protein is lost extensively from axotomized motoneuron dendrites 14 d after sciatic cut/ligation. A, AAV1-mCherry filled LG motoneurons (A1) and KCC2-IR in the same section (A2) 14 d following sciatic cut/ligation. Note some afferents are also labeled in the dorsal horn after AAV1 mCherry muscle injections. Scale bar = 200 μm. B, High-magnification confocal image through the soma and proximal dendrites of two mCherry-labeled and axotomized motoneurons (mCherry-red). KCC2 immunofluorescence (white) was not observed around the cell body and the proximal dendrites. Scale bar = 50 μm. C, The full dendritic arbor was imaged at high magnification using confocal image tiling and then the neurons reconstructed in 3D using Neurolucida. Example of six individual motoneurons (color-coded) reconstructed within one section with KCC2-IR in the background. Note the extension of dendrites toward the dorsal horn and also entering the white matter. Scale bar = 200 μm. D, Dendrites were color-coded to indicate complete KCC2 loss (green, “none”), partial KCC2 loss (blue), or normal KCC2 levels (pink), relative to surrounding dendrites in the neuropil. Loss of fluorescence in the proximal dendrites was similar to that on the soma membranes (green and region i). IR to KCC2 was partially reduced (blue and region ii) along dendrites for various distances. However, no significant loss of KCC2 was found on distal dendrites; scale bars (i, ii) = 5 μm. E, Box plots of the percentage of surface area in each category (complete depletion, partial depletion, or no depletion) for all dendrites for which the complete length was traceable (not cut short during sectioning). More than half of the available dendritic surface area was completely depleted (Table 4; ***p < 0.001). Box plots represent 25th, median, and 75th percentiles; whiskers = 10th and 90th percentiles. Crosses = mean; points represent average for individual neurons (n = 6, 3.12 ± 0.98 dendrites/animal). F, G, Sholl analysis (100-μm bins) of dendritic length and KCC2 depletion. F, Average (±SD) percentage of dendritic lengths within each bin (n = 7 neurons, 5.29 ± 1.1 dendrites per neuron), illustrating that within the first 200 μm, the majority of dendrites have no KCC2 visible, whereas normal KCC2 levels can be observed at the most distal ends of dendrites. G, Isolated single motoneuron from C separated for Sholl analysis. The majority of KCC2 is completely lost in the first 200 μm of dendrite; at 400 μm, dendritic KCC2 is largely preserved. H, Example dendrogram of the motoneuron in G, color-coded for KCC2 depletion. Dendrite branches ending in circles represent dendrites that were fully contained within the section (quantified in E). Dendrite branches that were cut during sectioning and could not be fully traced are designated with slashes. The majority of dendrites for which the ending could be observed had normal levels of KCC2 present in their terminal regions.
Figure 3.
Figure 3.
KCC2 mRNA is lost by 3 d after peripheral axotomy. A, Darkfield image of a lumbar 4 section 3 d after unilateral sciatic nerve cut/ligation, processed using RNA-Scope. KCC2 mRNA visualized in white. Scale bar = 200 μm. Very little KCC2 mRNA is found in the area around the injured motor pool (right) in Lamina IX (LIX), relative to the contralateral intact motor pools. B, C, Brightfield images of motoneurons on the intact (B) or cut/ligated (C) sides of the spinal cord 3 d after PNI. Injured motoneurons lose KCC2 mRNA, whereas motoneurons contralateral to injury and interneurons (INs) or γ motoneurons (γMNs) on both sides of the spinal cord maintain KCC2 mRNA. Nuclei from glia are also visible and are more densely concentrated around axotomized neurons. KCC2 mRNA can also be seen extending into dendritic processes of intact motoneurons (rectangle in B, inset). Scale bar = 25 μm. D–F, RNA-Scope quantification procedure. Thresholding was used to highlight KCC2 mRNA (red). Nissl staining caused differences in background intensity, so difference thresholds were required for cytoplasm and nuclear quantification. Thus, the outlines of the motoneuron somata were traced (green) with the nucleus excluded to get the area of KCC2 mRNA within the cytoplasm (D). Nuclei (E) were traced and threshold separately. The total area, including cytoplasm and nucleus (F), was also traced for comparison of total area to KCC2 mRNA area. G, H, Percentage KCC2 coverage of soma (G) and nucleus (H). Animals were euthanized 3, 7, or 14 d (n = 3/group) after unilateral sciatic nerve cut/ligation, and sciatic motoneurons were quantified as described above. There were no differences between levels of KCC2 between time points; only injury state predicted KCC2 levels (Table 4). Thus, data from all time points were pooled and paired t tests were performed comparing motoneurons ipsilateral and contralateral to injury (Table 4; ***p ≤ 0.001).
Figure 4.
Figure 4.
KCC2 protein is not lost on motoneuron somata or dendrites 3 d after sciatic nerve cut/ligation. A, B, AAV1-mCherry filled LG motoneurons (A) and KCC2-IR (B) in the same section 3 d following sciatic nerve cut/ligation. Scale bar = 200 μm C, D, Representative high-magnification (60× 1) images of the motoneurons (red) above and the KCC2-IR (white) on their somata and dendrites (yellow arrows). There is minimal loss of KCC2-IR on both the soma and dendritic processes. No loss is visible on mid to distal dendrites. Scale bar = 50 μm.
Figure 5.
Figure 5.
KCC2 protein is not lost as dramatically on γ motoneurons (γMNs) as αMNs. A, B, Confocal images of the ventral horn containing sciatic injured MNs labeled with antibodies against ChAT (green) and ATF3 (red) to mark axotomized MNs, and KCC2 (white) 14 d after sciatic nerve cut/ligation. Uninjured MNs in the side contralateral to the injury (top) lack ATF3 and have similar levels of KCC2-IR in α (large) and γ (<475 μm2, yellow arrowheads) MNs. After injury (B) KCC2-IR consistently disappears from αMNs, but is more variably depleted in γMNs (yellow arrowheads). C, High magnification of αMNs and γMNs marked in B. γMNs has some KCC2 preserved on the somatic membrane. Scale bars = 20 μm. D, Quantification of KCC2-IR on the membrane of individual MNs (single points) ipsilateral and contralateral to injury. αMNs consistently deplete KCC2 from the somatic membrane after injury, and while there are no statistically different differences in KCC2-IR of intact MNs ipsilateral and contralateral to injury, the difference between injured and uninjured γMNs is not significantly different (Table 4). γMNs do not exhibit KCC2 loss as consistently as αMNs at this time point. ***p < 0.001; *p < 0.05; n.s. = not significant.
Figure 6.
Figure 6.
The disappearance of KCC2 coincides with microglial onset but KCC2 restoration depends on muscle reinnervation. CX3CR1EGFP/+ animals underwent unilateral sciatic nerve injury and were allowed to survive for various time points. A, Representative images of microglial (green) and KCC2 (white) IR 14 d after sciatic nerve cut/ligation, at the peak of the microglial response. Scale bars = 200 μm. Regions of KCC2 depletion overlap with the area of microglial reactivity. B, Time course of KCC2 downregulation and recovery in CX3CR1EGFP/+ animals. KCC2 protein levels begin decreasing by 3 d and are significantly reduced by two weeks following injury but are restored to control levels by 60 d in animals in which regeneration was allowed (repaired; Table 4; *p ≤ 0.05, **p ≤ 0.01). Error bars = SEM. C, D, Microglial reaction (green) around injured LG motoneurons (blue) 14 d (C) or 60 d (D) after sciatic nerve injury in cut/ligated animals. KCC2-IR loss appears to coincide with the onset of microgliosis but persists after the response has attenuated. E, Representative motor endplates in the LG muscle following sciatic nerve cut/repair. Acetylcholine receptors were labeled with α-bungarotoxin (red) and motor axons were identified by VAChT (white) and NF-H (green). Scale bars = 5 μm. Endplates with overlapping acetylcholine receptors and VAChT were designated as reinnervated. F, Correlation between KCC2-IR and endplate reinnervation of individual animals (circles). Animals with higher levels of reinnervation of the LG have higher levels of KCC2 fluorescence on LG motoneurons (linear regression; Table 4).
Figure 7.
Figure 7.
KCC2 depletion occurs independent of microgliosis. A, Relative KCC2 depletion in WT and CX3CR1 BDNF KO animals 14 d after cut/ligation. Genotype had no effect on KCC2 levels in motoneurons contralateral or ipsilateral to injury (Table 5). Removing BDNF from microglia had no impact on KCC2 expression. B, Lumbar spinal cord sections from animals expressing normal CSF1 (top) and with CSF1 removed from motoneurons (bottom) 14 d after ligation. ChatIREScre/+: : csf1f/f animals (bottom image) exhibit normal microgliosis in the dorsal horn but have the microglial reaction to injury greatly attenuated in the ventral horn compared to ChatI+/+: : csf1f/f(top image). Scale bars = 200 μm. C, KCC2 immunofluorescence 14 d after sciatic ligation in csf1f/f animals. Preventing microgliosis in the ventral horn had no impact on KCC2 within intact or injured motoneurons (Table 5). Error bars = SEM; **p ≤ 0.01, ***p ≤ 0.001.
Figure 8.
Figure 8.
Knock-out of motoneuron BDNF does not impact KCC2 downregulation. A, KCC2-IR in ChatIREScre/+: : bndff/f motoneurons 14 d after sciatic cut/ligation. Removal of BDNF from motoneurons throughout development had no impact on KCC2-IR in motoneurons ipsilateral or contralateral to injury. The same baseline levels and depletion were observed regardless of genotype. (Table 5; **p ≤ 0.01). B, SLICK: BDNFf/f LG motoneurons following tamoxifen treatment, 14 d after sciatic nerve cut/ligation. YFP+ neurons express cre and have bdnf excised with tamoxifen treatment. KCC2 is extensively removed from the somatic membrane in response to injury even after BDNF KO in adulthood. C, Quantification of KCC2 downregulation on ligated cre+ (YFP+) and cre– (YFP–) motoneurons after tamoxifen treatment and bilateral sciatic ligation (n = 4.23 ± 2.75 YFP+ and 4.22 ± 3.35 YFP– motoneurons/animal). There is no difference between cre+ (green) and cre– (blue) motoneuron loss of KCC2 regardless of BDNF KO (Table 5). Error bars = SEM. Removing motoneuron BDNF production had no impact on KCC2 expression or downregulation following peripheral axotomy.
Figure 9.
Figure 9.
Systemic blockade of TrkB does not attenuate KCC2 downregulation. A, Western blotting of pERK (bottom) and B-actin (top) from lumbar tissue 7 d after bilateral sciatic ligation or sham surgery. Animals were exposed to ANA-12 (a partial TrkB antagonist) or vehicle continuously from time of surgery to killing. In sham animals exposed to ANA-12, there is a slight increase in pERK. However, there was a much larger amount of pERK in vehicle-treated animals that underwent sciatic cut/ligation; this was not seen in injured animals treated with ANA-12. Thus, ANA-12 prevented the normal increase in TrkB signaling that typically occurs after injury. B, KCC2-IR on LG motoneurons of WT animals treated with ANA-12 or vehicle through mini osmotic pumps 14 d after unilateral sciatic sham surgery or cut/ligation. Neither exposure to ANA-12 nor sham surgery altered KCC2 levels in intact motoneurons, and motoneurons with their axons cut and ligated had the same depletion of KCC2 regardless of exposure to ANA-12 (Table 6). C, KCC2-IR on motoneurons of F616A animals 14 d after peripheral cut/ligation. Animals were given 1NMPP1 or vehicle before surgery, through time of killing. F616A animals have a mutated TrkB receptor such that when exposed to 1NMPP1 cannot autophosphorylate or signal. There was no difference in KCC2 presence or loss regardless of treatment (Table 6). Preventing TrkB signaling did not alter KCC2 protein expression or loss after injury (**p ≤ 0.01, ***p ≤ 0.001). Error bars = SEM.

References

    1. Akhter ET, Rotterman TM, English AW, Alvarez FJ (2019) Sciatic Nerve Cut and Repair Using Fibrin Glue in Adult Mice. Bio-protocol 9:e3363 10.21769/BioProtoc.3363 - DOI - PMC - PubMed
    1. Al-Majed AA, Brushart TM, Gordon T (2000a) Electrical stimulation accelerates and increases expression of BDNF and trkB mRNA in regenerating rat femoral motoneurons. Eur J Neurosci 12:4381–4390. 10.1111/j.1460-9568.2000.01341.x - DOI - PubMed
    1. Al-Majed AA, Neumann CM, Brushart TM, Gordon T (2000b) Brief electrical stimulation promotes the speed and accuracy of motor axonal regeneration. J Neurosci 20:2602–2608. 10.1523/JNEUROSCI.20-07-02602.2000 - DOI - PMC - PubMed
    1. Al-Majed AA, Tam SL, Gordon T (2004) Electrical stimulation accelerates and enhances expression of regeneration-associated genes in regenerating rat femoral motoneurons. Cell Mol Neurobiol 24:379–402. - PMC - PubMed
    1. Aldskogius H (2011) Mechanisms and consequences of microglial responses to peripheral axotomy. Front Biosci 3:857–868. - PubMed

Publication types

MeSH terms