. 2019 Oct 7;218(10):3506-3525.
doi: 10.1083/jcb.201807178. Epub 2019 Sep 20.

Perlecan regulates pericyte dynamics in the maintenance and repair of the blood-brain barrier

Affiliations

Perlecan regulates pericyte dynamics in the maintenance and repair of the blood-brain barrier

Kuniyuki Nakamura et al. J Cell Biol. .

Abstract

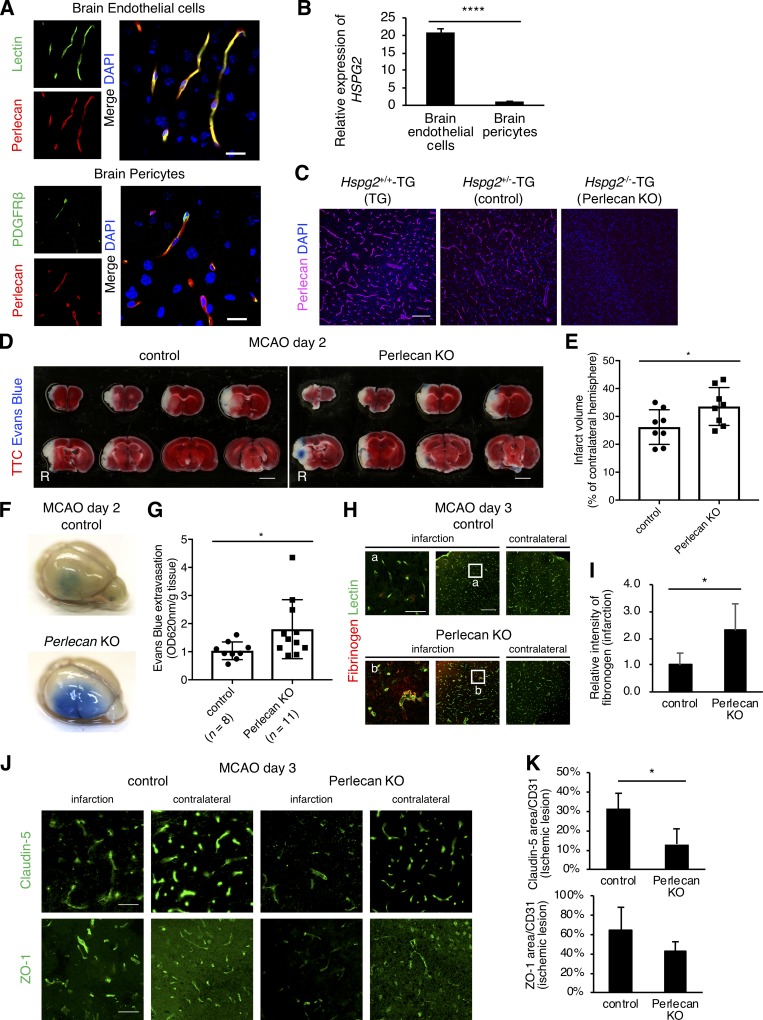
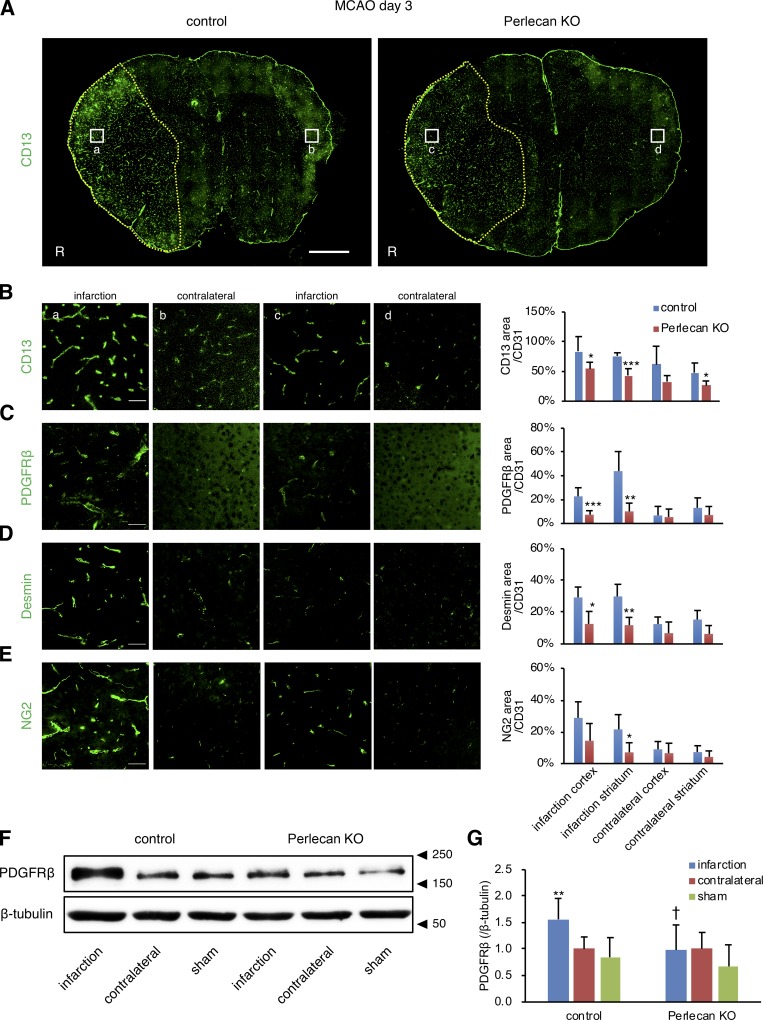
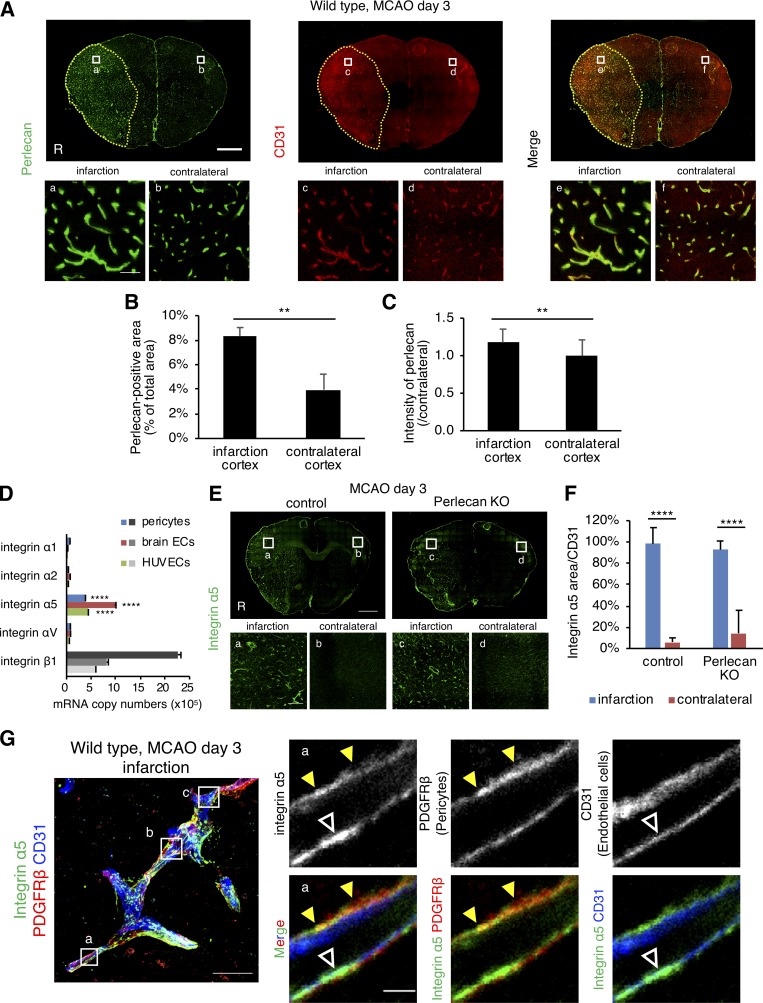
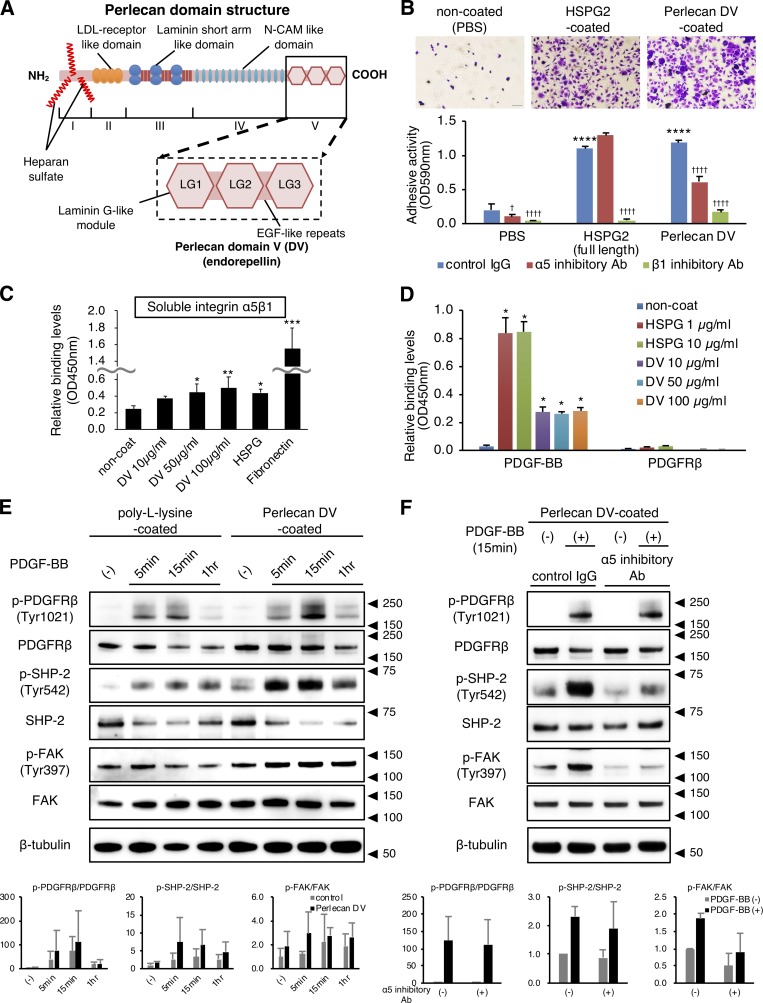
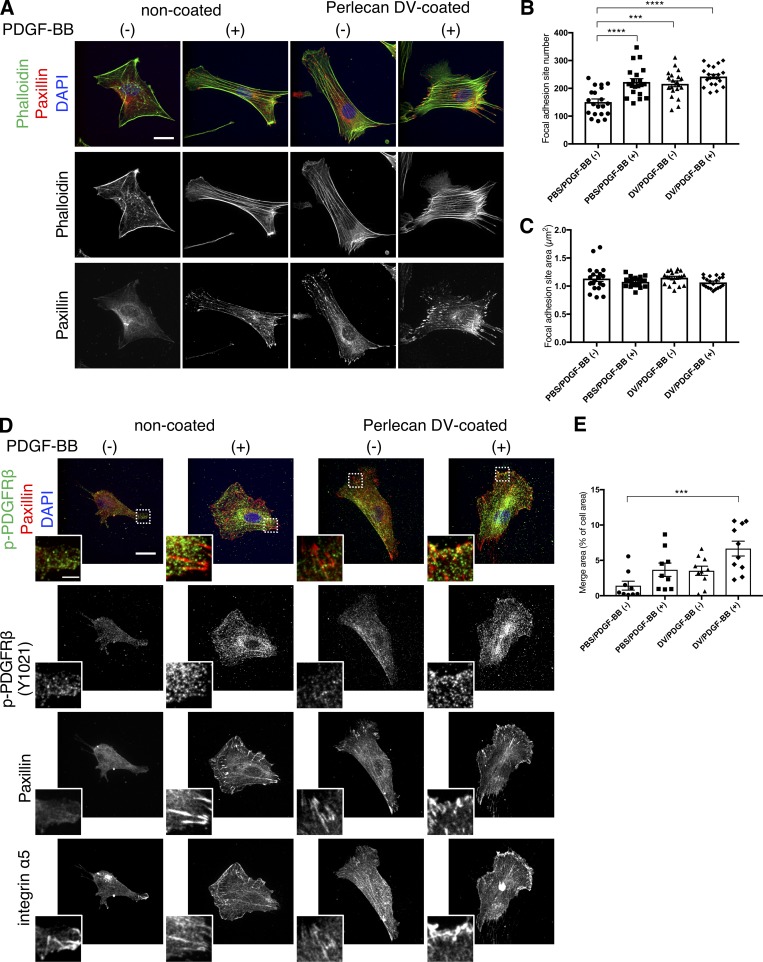
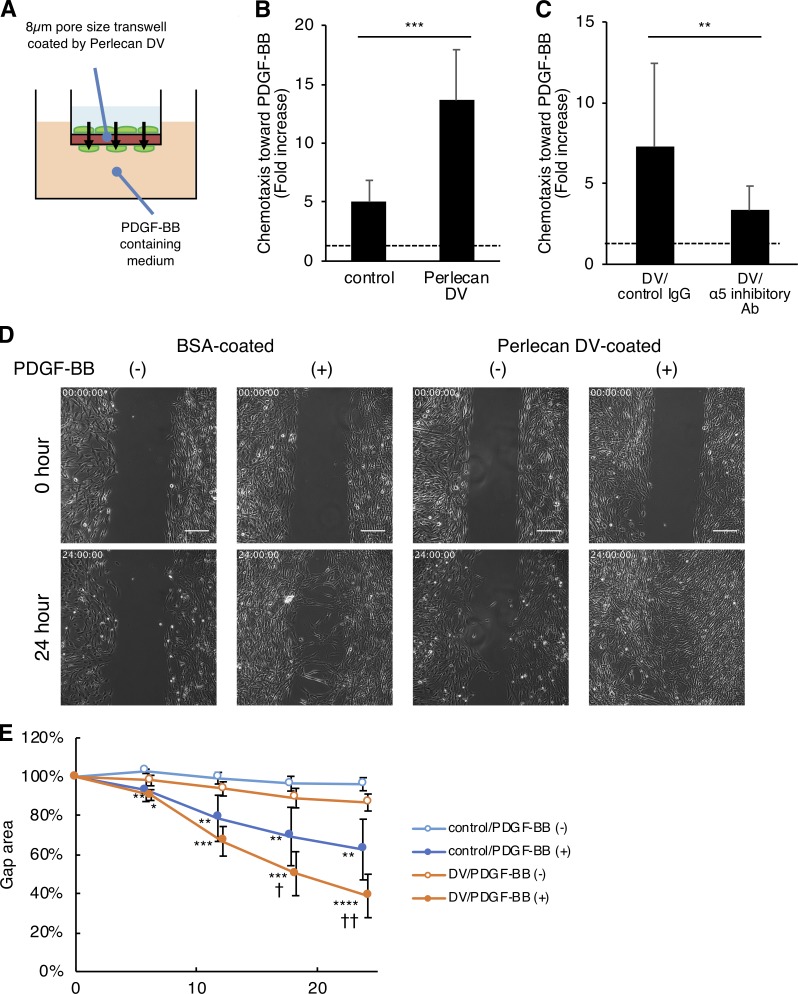
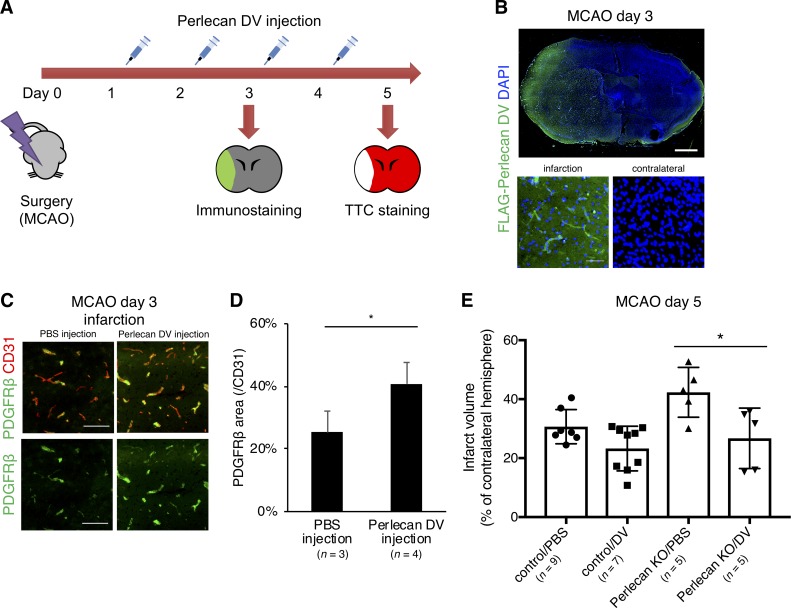
Ischemic stroke causes blood-brain barrier (BBB) breakdown due to significant damage to the integrity of BBB components. Recent studies have highlighted the importance of pericytes in the repair process of BBB functions triggered by PDGFRβ up-regulation. Here, we show that perlecan, a major heparan sulfate proteoglycan of basement membranes, aids in BBB maintenance and repair through pericyte interactions. Using a transient middle cerebral artery occlusion model, we found larger infarct volumes and more BBB leakage in conditional perlecan (Hspg2)-deficient (Hspg2 - / - -TG) mice than in control mice. Control mice showed increased numbers of pericytes in the ischemic lesion, whereas Hspg2 - / - -TG mice did not. At the mechanistic level, pericytes attached to recombinant perlecan C-terminal domain V (perlecan DV, endorepellin). Perlecan DV enhanced the PDGF-BB-induced phosphorylation of PDGFRβ, SHP-2, and FAK partially through integrin α5β1 and promoted pericyte migration. Perlecan therefore appears to regulate pericyte recruitment through the cooperative functioning of PDGFRβ and integrin α5β1 to support BBB maintenance and repair following ischemic stroke.


Figures

Figure 1.
Figure 1.
The BBB is strongly disrupted after ischemic stroke in Perlecan KO mice. (A) The expression of perlecan (red) colocalized with lectin-positive brain endothelial cells (green, upper panels) and was found adjacent to PDGFRβ-positive brain pericytes (green, lower panels) in a brain section of wild-type mice. Scale bar = 20 µm. (B) Quantitative PCR for HSPG2 (Perlecan) in cultured brain endothelial cells and pericytes. Values are mean ± SD; n = 4; ****, P < 0.0001, unpaired t test. (C) Perlecan was expressed in brain vasculature in Hspg2+/+-TG (TG) and Hspg2+/−-TG (control) mice, but not in conditional perlecan-deficient (Hspg2/-TG [Perlecan KO]) mice. Scale bar = 100 µm. (D and E) Representative images of TTC staining (D) at PSD 2 after MCAO in control and Perlecan KO mice and the quantified infarct volume (E). Evans Blue was injected into these mice to show the BBB leakage (Evans Blue extravasation). Scale bar = 3 mm. The infarction volume was significantly greater in Perlecan KO mice than in control mice. Values are mean ± SD; n = 8 mice per group; *, P < 0.05, unpaired t test. (F and G) Representative images of Evans Blue extravasation at PSD 2 after MCAO in control and Perlecan KO mice (F). Quantification of Evans Blue extracted from ipsilateral hemispheres at PSD 2 (G) showed more leakage of the dye in Perlecan KO mice than in control mice. Values are mean ± SD; n = 8–11 mice per group; *, P < 0.05, unpaired t test. (H and I) Representative images of fibrinogen extravasation at PSD 3 after MCAO in control and Perlecan KO mice. Left panels show a higher magnification of the indicated lesion in the infarction. Scale bar = 40 µm (left panels) or 150 µm (middle and right panels). Quantification of fibrinogen intensity (I) showed more leakage in Perlecan KO mice than in control mice. Values are mean ± SD; n = 5 mice per group; *, P < 0.05, unpaired t test. (J and K) Representative images of the immunostaining for Claudin-5 (upper panels) and ZO-1 (lower panels) at PSD 3 after MCAO in the brain cortex of control and Perlecan KO mice (J). Scale bar = 50 µm. Claudin-5–positive and ZO-1–positive areas were quantified and standardized by CD31-positive areas in the ischemic lesions of control and Perlecan KO mice (K). Values are mean ± SD; n = 4 mice per group; *, P < 0.05, unpaired t test.
Figure 2.
Figure 2.
The infarction-induced up-regulation of pericytes is attenuated in Perlecan KO mice. (A) Representative images of immunostaining for the pericyte marker CD13 at PSD 3 after MCAO in control and Perlecan KO mice. The control mice showed an increase in the number of CD13+ pericytes in the ischemic lesion at PSD 3, while this up-regulation was not observed in Perlecan KO mice. Yellow dotted line = infarct area, defined by MAP2 and GFAP staining (Fig. S2 A). Scale bar = 1 mm. (B–E) CD13+ (B), PDGFRβ+ (C), desmin+ (D), or NG2+ (E) areas were quantified and standardized by CD31+ areas in the ischemic lesions of control and Perlecan KO mice. Left panels indicate a higher magnification of the brain cortex. Scale bar = 50 µm. Values are mean ± SD; n = 5 mice per group; *, P < 0.05; **, P < 0.01; ***, P < 0.001 versus control mice, unpaired t test. (F and G) The immunoblotting for PDGFRβ in brain cortex lysates of ipsilateral or contralateral hemispheres at PSD 3 after MCAO, or sham surgery control of control and Perlecan KO mice. A representative example of five independent experiments is shown (F). Quantitative analysis by densitometry normalized with β-tubulin is represented as the fold increase above the expression of PDGFRβ in the contralateral hemisphere of control mice (G). Values are mean ± SD; n = 7 mice per group or 5 (sham surgery mice); **, P < 0.01 versus contralateral hemisphere; , P < 0.05 versus control mice, one-way ANOVA followed by Dunnett’s test.
Figure 3.
Figure 3.
The expression levels of perlecan and integrin α5 are increased after ischemic stroke. (A–C) The expression of perlecan (green) and CD31 (red) was significantly higher in the infarct areas than in the contralateral hemisphere at PSD 3 after MCAO. Scale bar = 1 mm (upper panels) or 50 µm (lower panels). Yellow dotted line = infarct area. Perlecan-positive areas (B) and the intensity (C) were quantified in brain cortex areas of wild-type mice. Values are mean ± SD; n = 5; **, P < 0.01, unpaired t test. (D) Quantitative real-time PCR for the expression of integrins in brain pericytes, brain endothelial cells (ECs), and human umbilical vein endothelial cells (HUVECs). Values are mean ± SD; n = 3; ****, P < 0001 versus other integrin α isoforms, one-way ANOVA followed by Tukey–Kramer’s HSD test. (E and F) The expression of integrin α5 was significantly increased compared with the contralateral hemisphere at PSD 3 after MCAO in control and Perlecan KO mice. Scale bar = 1 mm (top panel) or 100 µm (bottom panels). Integrin α5–positive areas were quantified in brain cortex areas (F). Values are mean ± SD; n = 6 mice per group; ****, P < 0001, one-way ANOVA followed by Tukey–Kramer’s HSD test. (G) Representative images of the immunostaining for integrin α5 in brain microvessels. A maximum-intensity projection image was constructed from Z-stack images (left panel). The boxed regions in the left panel are magnified in right panels (a) and in Fig. S3 C (b and c). The expression of Integrin α5 (green) was detectable in both pericytes (PDGFRβ, red, yellow arrowheads) and endothelial cells (CD31, blue, white arrowheads). Scale bar = 20 µm (left panel) or 2 µm (right panels).
Figure 4.
Figure 4.
Perlecan DV promotes PDGFRβ signaling through integrin α5β1. (A) Structure of perlecan. The five domains are numbered from the N terminus to the C terminus. Domain I contains the binding sites for heparan sulfate side chains. DV/endorepellin contains three globular domains that have homology to the laminin G module (LG) and that are each separated by epidermal growth factor (EGF)-like repeats (Noonan et al., 1991; Iozzo, 2005). (B) Representative images of brain pericytes attached to immobilized full-length perlecan (HSPG2, 10 µg/ml) or perlecan DV (500 nmol/liter; upper panels). Scale bar = 100 µm. The adhesion of pericytes to perlecan DV was inhibited by integrin function-blocking antibodies against integrins α5 (mAb16, 50 mg/ml) and β1 (mAb13, 50 mg/ml). Values are mean ± SD; n = 5; ****, P < 0.0001 versus PBS; , P < 0.05; ††††, P < 0.0001 versus control IgG, one-way ANOVA followed by Tukey–Kramer’s HSD test. (C) Solid-phase binding assays of soluble integrin α5β1 (4 µg/ml) to the immobilized perlecan DV (10–100 µg/ml), full-length perlecan (HSPG2, 10 µg/ml), or fibronectin (10 µg/ml). Values are mean ± SD; n = 6; *, P < 0.05; **, P < 0.01; ***, P < 0.0001 versus noncoated, one-way ANOVA followed by Dunnett’s test. (D) Solid-phase binding assays of soluble PDGF-BB (0.5 µg/ml) or PDGFRβ (2 µg/ml) to the immobilized full-length perlecan (HSPG2) or perlecan DV. Values are mean ± SD; n = 3; *, P < 0.0001 versus noncoated, one-way ANOVA followed by Dunnett’s test. (E) The immunoblotting for the temporal profiles of p-PDGFRβ (Y1021)/PDGFRβ, p-SHP-2 (Y542)/SHP-2, and p-FAK (Y397)/FAK in pericytes. Cells were cultured on either poly-l-lysine (control, 15 µg/ml) or perlecan DV (500 nmol/liter). After serum starvation for 16 h, PDGF-BB (50 ng/ml) was added at the indicated time. A representative example of three independent experiments is shown (upper panels). The phosphorylated protein was quantitatively evaluated by densitometry, normalized with the total protein, and represented as the fold increase above the level obtained with control substrate without PDGF-BB (lower panels). Values are mean ± SD; n = 3. (F) The immunoblotting for p-PDGFRβ (Y1021)/PDGFRβ, p-SHP-2 (Y542)/SHP-2, and p-FAK (Y397)/FAK in pericytes under an inhibitory antibody for integrin α5. The cells were cultured on perlecan DV, serum-starved, pretreated with either control IgG or mAb16 (50 µg/ml) for 1 h, and incubated with PDGF-BB (20 ng/ml) for 15 min. A representative example of three independent experiments is shown (upper panels). The data represent the fold increase above the level obtained with control IgG treatment without PDGF-BB (lower panels). Values are mean ± SD; n = 3.
Figure 5.
Figure 5.
Perlecan DV promotes PDGF-BB–induced actin organization and focal adhesions in pericytes. (A) Representative images of the actin staining. Brain pericytes cultured on coverslips coated with PBS or perlecan DV (500 nmol/liter) were treated with or without PDGF-BB (50 ng/ml) for 5 min after 24-h serum starvation. Cells were stained with Alexa Fluor 488–conjugated phalloidin and anti-paxillin antibody. Scale bar = 20 µm. (B and C) The number (B) and area (C) of focal adhesion was analyzed by MetaMorph software. Values are mean ± SEM; n = 20; ***, P < 0.001; ****, P < 0.0001, one-way ANOVA followed by Tukey–Kramer’s HSD test. (D) Representative images of the immunostaining for phospho-PDGFRβ (Y1021), integrin α5, and paxillin. Brain pericytes cultured on coverslips coated with PBS or perlecan DV (500 nmol/liter) were treated with or without PDGF-BB (50 ng/ml) for 5 min after 24-h serum starvation. Scale bar = 20 µm. Insets indicate a higher magnification of the boxed region, scale bar = 5 µm. (E) Quantification of the merged area for phospho-PDGFRβ (Y1021), integrin α5, and paxillin. The area of all colocalized particles was measured and standardized by each cell area using ImageJ. Values are mean ± SEM; n = 10; ***, P < 0.001, one-way ANOVA followed by Tukey–Kramer’s HSD test.
Figure 6.
Figure 6.
Perlecan DV promotes the PDGF-BB–induced migration of pericytes. (A and B) Brain pericytes migrating toward PDGF-BB (50 ng/ml) through a membrane coated with BSA (control) or perlecan DV (500 nmol/liter), normalized against a no-chemoattractant negative control. Values are mean ± SD from three independent experiments conducted in triplicate; ***, P < 0.001, unpaired t test. (C) The migration of brain pericytes treated with control IgG or integrin α5 inhibitory Ab (mAb16) toward PDGF-BB (25 ng/ml) through a membrane coated with perlecan DV (500 nmol/liter), normalized against a no-chemoattractant negative control. Values are mean ± SD from four independent experiments with triplicates; **, P < 0.01, unpaired t test. (D) Brain pericytes cultured with a 500-µm-wide gap insert on plates coated with BSA (control) or perlecan DV (500 nmol/liter) were treated with or without PDGF-BB (50 ng/ml) in serum-free medium. Representative images for the wound healing at 0 and 24 h are shown. Scale bar = 250 µm. (E) The cell-covered area of the wound healing assay was analyzed with ImageJ and is shown as a percentage of the initial gap area. Values are mean ± SD; n = 4–6 per group; *, P < 0.05; **, P < 0.01; ***, P < 0.001; ****, P < 0.0001 versus without PDGF-BB; , P < 0.05; ††, P < 0.01 versus control substrate (BSA), one-way ANOVA followed by Tukey–Kramer’s HSD test.
Figure 7.
Figure 7.
Perlecan DV may promote the repair process of the BBB in ischemic stroke. (A) Perlecan DV was intraperitoneally injected daily for two or four consecutive days starting 24 h after MCAO. The mice were sacrificed at PSD 3 after MCAO for immunostaining or at PSD 5 for TTC staining. (B) Representative images of the immunostaining for FLAG. The administered recombinant perlecan DV with 3×FLAG tag was in infarct lesion at PSD 3 after MCAO. Scale bar = 1 mm or 50 µm. (C) Representative images of the immunostaining for PDGFRβ (green) and CD31 (red) at PSD 3 after MCAO, followed by perlecan DV injection in control mice. Perlecan DV–injected mice showed increased numbers of PDGFRβ-positive pericytes in the ischemic lesion at PSD 3. Scale bar = 100 µm. (D) PDGFRβ-positive areas were quantified and standardized by CD31-positive areas in the brain cortex. Values are mean ± SD; n = 3–4 per mice group; *, P < 0.05, unpaired t test. (E) The infarction volume in Perlecan KO mice at PSD 5, evaluated by TTC staining, was significantly smaller in the mice administered perlecan DV than in mice administered PBS-vehicle. Values are mean ± SD; n = 5–9 per mice group; *, P < 0.05, one-way ANOVA followed by Tukey–Kramer’s HSD test.
Figure 8.
Figure 8.
Perlecan DV regulates pericyte migration through cooperative action of PDGFRβ and integrin α5β1. Schematic model depicting the synergistic action of PDGFRβ and integrin α5β1 in brain pericytes. (A) The up-regulated perlecan attaches to both endothelial cells (EC) and pericytes to maintain the integrity of the BBB. Perlecan interacts with pericytes to promote cell migration, thereby contributing to the repair process of the BBB. (B) In brain pericytes, PDGF-BB stimulation and perlecan DV synergistically induce SHP-2 phosphorylation and downstream FAK phosphorylation, causing a subsequent acceleration of focal adhesion turnover, actin reorganization, and cell migration.

References

    1. Arikawa-Hirasawa E., Watanabe H., Takami H., Hassell J.R., and Yamada Y.. 1999. Perlecan is essential for cartilage and cephalic development. Nat. Genet. 23:354–358. 10.1038/15537 - DOI - PubMed
    1. Arimura K., Ago T., Kamouchi M., Nakamura K., Ishitsuka K., Kuroda J., Sugimori H., Ooboshi H., Sasaki T., and Kitazono T.. 2012. PDGF receptor β signaling in pericytes following ischemic brain injury. Curr. Neurovasc. Res. 9:1–9. 10.2174/156720212799297100 - DOI - PubMed
    1. Baeten K.M., and Akassoglou K.. 2011. Extracellular matrix and matrix receptors in blood-brain barrier formation and stroke. Dev. Neurobiol. 71:1018–1039. 10.1002/dneu.20954 - DOI - PMC - PubMed
    1. Bederson J.B., Pitts L.H., Tsuji M., Nishimura M.C., Davis R.L., and Bartkowski H.. 1986. Rat middle cerebral artery occlusion: evaluation of the model and development of a neurologic examination. Stroke. 17:472–476. 10.1161/01.STR.17.3.472 - DOI - PubMed
    1. Bix G., Fu J., Gonzalez E.M., Macro L., Barker A., Campbell S., Zutter M.M., Santoro S.A., Kim J.K., Hook M., et al. . 2004. Endorepellin causes endothelial cell disassembly of actin cytoskeleton and focal adhesions through alpha2beta1 integrin. J. Cell Biol. 166:97–109. 10.1083/jcb.200401150 - DOI - PMC - PubMed

Publication types

MeSH terms

Associated data