. 2019 Oct 15;203(8):2328-2338.
doi: 10.4049/jimmunol.1801604. Epub 2019 Sep 20.

T Cell-Specific Adaptor Protein Regulates Mitochondrial Function and CD4+ T Regulatory Cell Activity In Vivo following Transplantation

Affiliations

T Cell-Specific Adaptor Protein Regulates Mitochondrial Function and CD4+ T Regulatory Cell Activity In Vivo following Transplantation

Johannes Wedel et al. J Immunol. .

Abstract

The T cell-specific adaptor protein (TSAd), encoded by the SH2D2A gene, is an intracellular molecule that binds Lck to elicit signals that result in cytokine production in CD4+ T effector cells (Teff). Nevertheless, using Sh2d2a knockout (KO; also called TSAd-/-) mice, we find that alloimmune CD4+ Teff responses are fully competent in vivo. Furthermore, and contrary to expectations, we find that allograft rejection is accelerated in KO recipients of MHC class II-mismatched B6.C-H-2bm12 heart transplants versus wild-type (WT) recipients. Also, KO recipients of fully MHC-mismatched cardiac allografts are resistant to the graft-prolonging effects of costimulatory blockade. Using adoptive transfer models, we find that KO T regulatory cells (Tregs) are less efficient in suppressing Teff function and they produce IFN-γ following mitogenic activation. In addition, pyrosequencing demonstrated higher levels of methylation of CpG regions within the Treg-specific demethylated region of KO versus WT Tregs, suggesting that TSAd, in part, promotes Treg stability. By Western blot, Lck is absent in the mitochondria of KO Tregs, and reactive oxygen species production by mitochondria is reduced in KO versus WT Tregs. Full transcriptomic analysis demonstrated that the key mechanism of TSAd function in Tregs relates to its effects on cellular activation rather than intrinsic effects on mitochondria/metabolism. Nevertheless, KO Tregs compensate for a lack of activation by increasing the number of mitochondria per cell. Thus, TSAd serves as a critical cell-intrinsic molecule in CD4+Foxp3+ Tregs to regulate the translocation of Lck to mitochondria, cellular activation responses, and the development of immunoregulation following solid organ transplantation.


Conflict of interest statement

Conflicts of Interest

Potential conflicts of interest have been reviewed by the Office of General Counsel at Boston Children’s Hospital. The authors of this manuscript declare no conflicts of interest.

Figures

Figure 1.
Figure 1.. Effect of TSAd on CD4+ T cell activation responses in vitro.
(A) Purified CD4+ T cells from WT or TSAd knockout mice (labeled ΔTSAd) were cultured in media with/without plate-bound anti-CD3 and soluble anti-CD28 (1 μg/mL each) for 24 hours, and IFN-γ production was evaluated by ELISPOT. (B) Bead-sorted CD4+CD25 naive T cells or (C) CD4+CD25high Tregs from WT or TSAd−/− mice were stimulated with increasing concentrations of anti-CD3 alone (0.1-3 μg/mL) or anti-CD3 (1 μg/mL) with increasing concentrations of IL-2. Proliferation was assessed after 72 hours by 3H-thymidine incorporation. Data is expressed as mean counts per minute (CPM) ± SD of a representative experiment performed in triplicate. Each figure is representative of 5 independent experiments. Statistical analyses were performed using the Student’s t-test (A) or one-way ANOVA (B-C).
Figure 2.
Figure 2.. Accelerated rejection of cardiac allografts in TSAd knockout recipient mice.
(A) Graft survival following transplantation of fully MHC mismatched BALB/c hearts into C57BL/6 WT or TSAd knockout (labeled ΔTSAd) recipient mice. (B) Graft survival following transplantation of MHC class II mismatched B6.C-H-2bm12 hearts into WT or TSAd knockout recipients (Gehan-Breslow-Wilcoxon test). (C) Histology of B6.C-H-2bm12 cardiac allografts harvested on day 18 post-transplantation from WT and TSAd knockout recipients; the upper panels are representative photomicrographs and the lower plots show infiltration as identified by standard grid counting in 3 allografts per condition (Student’s t-test). (D-G) Intragraft infiltrates were evaluated on day 18 post-transplantation in allografts harvested from WT or TSAd knockout recipients. (D) Representative flow cytometry analysis, (E) the mean frequency of CD3+, CD4+ and CD8+ cells, (F) the CD4+ to CD8+ ratio ± SD of n=3 animals per group, and (G), representative flow cytometry, and bar graphs of the frequency of Foxp3+ cells within the CD4+ population ± SD in n=3 mice/group. (H) Intragraft cytokine mRNA expression on day 18 post-transplantation by qPCR. Bar graphs represent the relative mRNA expression ± SD of n=3/condition (One sample t-test).
Figure 3.
Figure 3.. CD4+ T effector/regulatory cell phenotype and expansion in TSAd knockout recipients of cardiac allografts.
Splenocytes from either C57BL/6 WT or TSAd knockout (ΔTSAd) recipients of B6.C-H-2bm12 donor allografts were harvested on day 18 post-transplantation and were analyzed by flow cytometry and by ELISPOT. (A) Representative flow cytometry analysis, (B) the mean frequency of CD3+, CD4+ and CD8+ cells, and (C) the CD4+ to CD8+ ratio ± SD of n=4 animals per group. (D) Representative flow cytometry, and bar graphs of the frequency of Foxp3+ cells within the CD4+ population ± SD in n=4 mice. (E) The ratio of CD4+CD44highCD62Llow Teff cells to CD4+Foxp3+ Treg ± SD in n=4 mice. (F) The frequency or mean fluorescence intensity (MFI) of CD4+Foxp3+ Treg subsets expressing CD44, CD62L, and NRP-1, (G) the transcription factors IRF-4, Helios, EOS and Blimp-1, and (H) the immunomodulatory proteins Lag3, CTLA4, PD-1 and GITR. (I) On day 15 post-transplantation, recipients were pulsed with BrdU intraperitoneally (every 12 hours for a total of 3 days) and splenocytes were harvested on day 18. A representative dot plot of BrdU incorporation within CD4+Foxp3 Teffs (lower quadrants) and within CD4+Foxp3+ Tregs (upper quadrants) by flow cytometry. The bar graph illustrates the mean percent of BrdU+ cells ± SD within the Teff or Treg populations in n=4 animals per group. (J) Recipient splenocytes were co-cultured with irradiated (1700 rad) donor antigen presenting cells (B6.C-H-2bm12) in a mixed lymphocyte reaction and allopriming was evaluated by the analysis of IFN-γ (upper panel) and IL-2 (lower panel) production by ELISPOT. Assays were performed in triplicates and are depicted as mean spots/well ± SD of 6 independent experiments. In each panel, statistical analysis and P-values were calculated using the Student’s t-test.
Figure 4.
Figure 4.. TSAd knockout recipients are resistant to the graft prolonging effects of costimulatory blockade.
Fully MHC mismatched BALB/c hearts were transplanted into WT or TSAd knockout (ΔTSAd) recipients respectively and were treated with (A) anti-CD40L or (B) CTLA4-Ig intraperitoneally on days 0, 2 and 4 post-transplantation. Graft survival was monitored by palpation. Statistics were performed by comparing outcomes in treated ΔTSAd vs. treated WT recipients. (C) Fully MHC mismatched BALB/c hearts were transplanted into C57BL/6 Rag2 Il2rg double knock-out recipients. On day 2 post-transplantation, recipients received FACS-sorted CD4+Foxp3+ Treg cells (2×10⁵) from either WT or TSAd knockout mice by tail vein injection. On day 18 post-transplantation, recipients were challenged with WT CD4+CD25 Teffs (3×10⁶ cells) by tail vein injection. Control recipients did not receive Tregs on day 2. Graft survival following Teff transfer was evaluated by palpation. Statistics in A-C were performed using the Gehan-Breslow-Wilcoxon test.
Figure 5.
Figure 5.. Cell intrinsic function of TSAd in CD4+Foxp3+ Tregs.
(A-D) Transcriptomic analysis of FACS-sorted WT and TSAd knockout (Δ) CD4+CD25high Tregs either unactivated or following treatment with anti-CD3 (1 μg/mL) for 2-24 hours. (A) Heatmaps illustrate 222 differentially expressed genes (KO vs. WT; Padj<0.001 at each time-point). (B) Principal component analysis of differential expressed genes (Padj<0.001) following activation of WT (black line/arrow) and TSAd KO Tregs with anti-CD3 for 2-24 hours (each time point is color coded). (C) Gene set enrichment analysis against genes that are upregulated in resting vs. activated Tregs (GSE15659: resting Treg vs. activated Treg up). (D) Gene set enrichment analysis against genes that are upregulated in Tregs vs. Teff (each time-point is color coded; GSE20366: TregLP vs. TconvLP up). (E) CD4+Foxp3+ Tregs and CD4+Foxp3 Teffs were FACS-sorted from the spleens of male WT and TSAd knockout (ΔTSAd) mice, and DNA methylation was assessed by bisulfite-conversion and pyrosequencing. Heat maps represent the mean level of methylation of 14 CpG islands within the TSDR region of the Foxp3 gene in 2 independent experiments. (F-H) In vitro Treg suppression assays were performed using naive CD4+ T cells as responders (Tresp) in combination with increasing ratios of FACS-sorted WT or TSAd knockout CD4+CD25high Tregs. Suppression was assessed by the evaluation of Tresp proliferation (CFSE-dilution in F-G) or IFN- γ production (ELISPOT in H). (G) Expansion indices were calculated from n=3 independent experiments normalized for Treg suppressive capacity ± SD (Two-way ANOVA; P=n.s.). (H) The bar graphs illustrating Treg-mediated suppression of responder IFN-γ production ± SD are representative of n=2 experiments performed in triplicate.
Figure 6.
Figure 6.. TSAd regulates Lck activity and functional responses within mitochondria of Tregs.
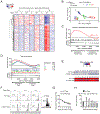
(A) Western blot analysis of cytosolic [C], mitochondrial [M] and nuclear [N] TSAd expression in bead-sorted WT CD4+CD25high Tregs. Each blot is representative of n=3 independent experiments. (B) Lck expression in cytosolic [C] and mitochondrial [M] extracts from bead-sorted WT or TSAd knockout (ΔTSAd) CD4+CD25high Tregs by Western blot analysis (representative of n=2 experiments). (C) Mitochondrial membrane potential of WT and TSAd knockout (ΔTSAd) CD4+CD25high Tregs (gated) as analyzed by flow cytometry using JC-1. The bar graph represents the relative ratio of the mean fluorescence intensity (MFI) of the dimeric to monomeric JC-1 probe ± SD in n=7 experiments (Kruskal-Wallis test). (D) Activation-induced ROS generation by WT or TSAd knockout (ΔTSAd) CD4+CD25high Tregs (gated) following stimulation with 1 μg/mL anti-CD3 for 30 min. CM-H2-DCFDA was analyzed by flow cytometry and the bar graph illustrates the relative MFI ± SD of n=3 independent experiments (Kruskal-Wallis test). (E) Bead-sorted WT and TSAd knockout CD4+CD25high Tregs were stimulated with anti-CD3/anti-CD28 (both at 1 μg/mL) and IL-2 (10 ng/mL) for 24 hours. Left Panel: Glycolysis was evaluated by measuring the extracellular acidification rate (ECAR) following the sequential addition of 10 mM glucose (Gluc), 1 μM oligomycin (Oligo) and 100 mM 2-deoxy glucose (2-DG). Right Panel: Oxidative phosphorylation was evaluated by measuring the oxygen consumption rate (OCR) following the sequential addition of 2 μM oligomycin (Oligo), 1.5 μM carbonyl cyanide-4-trifluoromethoxy-phenylhydrazone (FCCP), and 1 μM antimycin A and 500 nM rotenone into cultures. One representative of n=2 identical experiments is illustrated (mean ECAR/OCR ± SD of triplicate conditions; Two-way ANOVA, P=n.s.). (F) Transmission electron microscopy of bead-sorted CD4+C25high WT and TSAd knockout Tregs. Mitochondria are highlighted with an asterix [*]; the nucleus is labeled [Nuc]. Upper panel: Representative cross-sections (1 μm/bar). Lower Panel: Box insert from the upper panels at 250 nm/bar. The scatter graph represents the mean number of mitochondria per cell ± SD; one cross section/cell and a total of 40 cells/group (Student’s t-test). (G) Mitochondrial mass of WT or TSAd knockout CD4+CD25high Tregs (gated) was analyzed by flow cytometry using MitoTracker Green. Bars represent the relative MFI ± SD of n=6 independent experiments (One-sample t-test). (H) DNA was isolated from bead-sorted WT or TSAd knockout CD4+CD25high Tregs and the mitochondrial mass was evaluated using the ratio of mitochondrial vs. nuclear DNA content by qPCR. Bars represent mean mitochondrial DNA copies/cell ± SD of n=3 experiments (Student’s t-test).

References

    1. Spurkland A,Brinchmann JE,Markussen G,Pedeutour F,Munthe E,Lea T,Vartdal F, and Aasheim HC. 1998. Molecular cloning of a T cell-specific adapter protein (TSAd) containing an Src homology (SH) 2 domain and putative SH3 and phosphotyrosine binding sites. J Biol Chem. 273: 4539–46. - PubMed
    1. Dai KZ,Vergnaud G,Ando A,Inoko H, and Spurkland A. 2000. The SH2D2A gene encoding the T-cell-specific adapter protein (TSAd) is localized centromeric to the CD1 gene cluster on human Chromosome 1. Immunogenetics. 51: 179–85. - PubMed
    1. Rajagopal K,Sommers CL,Decker DC,Mitchell EO,Korthauer U,Sperling AI,Kozak CA,Love PE, and Bluestone JA. 1999. RIBP, a novel Rlk/Txk- and itk-binding adaptor protein that regulates T cell activation. J Exp Med. 190: 1657–68. - PMC - PubMed
    1. Choi YB,Kim CK, and Yun Y. 1999. Lad, an adapter protein interacting with the SH2 domain of p56lck, is required for T cell activation. J Immunol. 163: 5242–9. - PubMed
    1. Lapinski PE,Oliver JA,Bodie JN,Marti F, and King PD. 2009. The T-cell-specific adapter protein family: TSAd, ALX, and SH2D4A/SH2D4B. Immunol Rev. 232: 240–54. - PubMed

Publication types

Substances